Lead Conversion Rate: Benchmarks, Formula, and What "Good" Looks Like in 2026
Your VP of Sales just asked why only 3% of leads are converting. You pull up the dashboard, and then it hits you - you don't actually know which "3%" they mean. Is that visitors turning into form fills? MQLs becoming SQLs? Leads closing into revenue? The answer changes everything, and most teams are measuring the wrong one.
The confusion is everywhere. One r/PPC marketer reports 13% completion in a 6-step estimate funnel. An IT consultant says "Contact Us" forms convert at 3-5% with half the leads being junk. Over on r/sales, someone insists B2B SaaS teams "need at least 15% conversion rate" without specifying what's being converted. None of them are wrong. They're measuring completely different things.
What Is Lead Conversion Rate?
It isn't one metric. It's at least four.
DemandScience defines lead-to-sale conversion rate as the share of leads that become buyers. Corporate Finance Institute defines it as the proportion of qualified leads that result in actual sales. Both are right. Both produce wildly different numbers depending on where you draw the line.
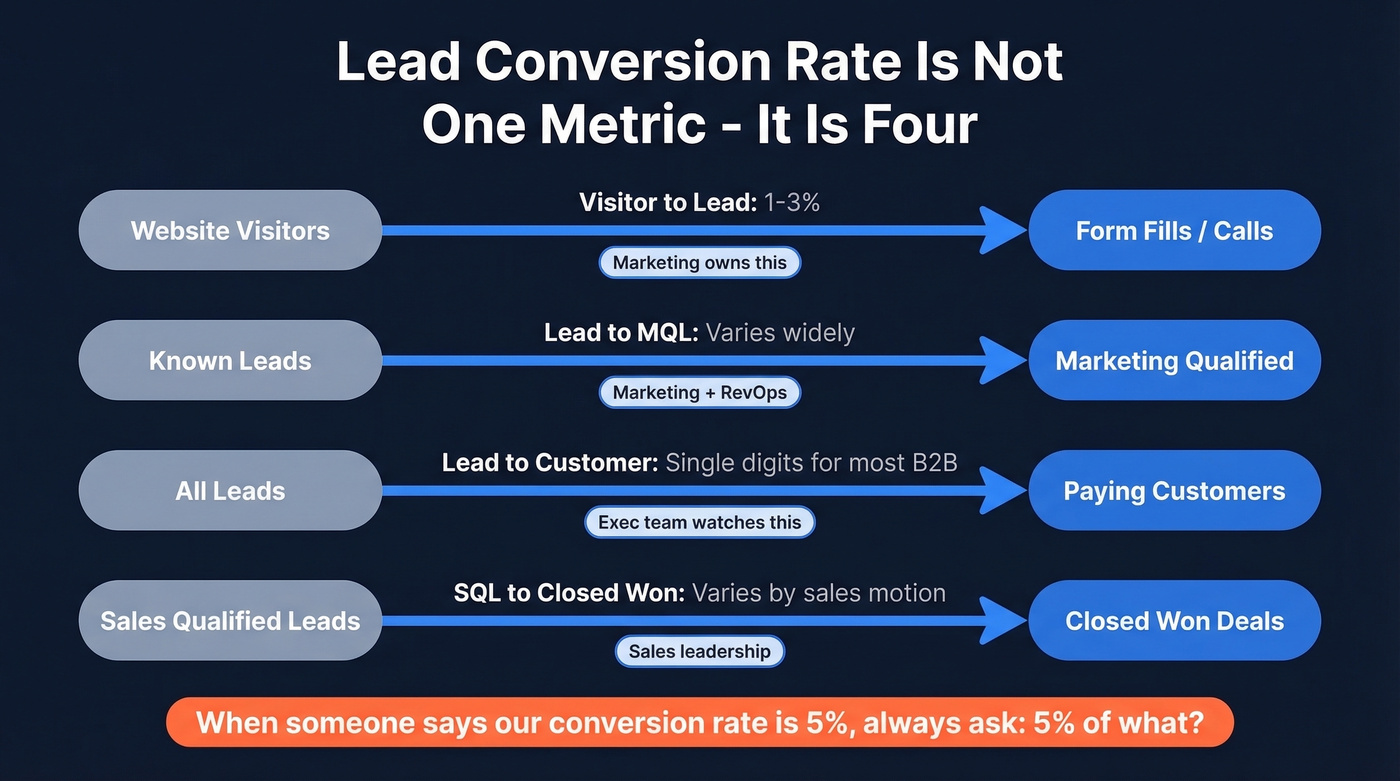
The simplest definition: lead conversion rate is the percentage of leads that advance to a specific next stage in your funnel - whether that's MQL, SQL, opportunity, or closed-won customer. The stage you choose determines the number you get.
| Metric | What It Measures | Typical Range | Who Cares Most |
|---|---|---|---|
| Visitor → Lead | Site traffic to form fill/call | ~1-3% for most B2B | Marketing |
| Lead → MQL | Known lead to qualified | Varies widely by definition | Marketing/RevOps |
| Lead → Customer | End-to-end close rate | Single digits for most B2B | Exec team |
| SQL → Closed Won | Late-stage to revenue | Varies by sales motion | Sales leadership |
When someone says "our conversion rate is 5%," you need to ask: 5% of what? A 5% visitor-to-lead rate would be exceptional for most B2B industries. A 5% lead-to-customer rate is solid for mid-market deals. A 5% opportunity-to-close rate means your pipeline is leaking badly.
Never benchmark a number without specifying which conversion you're measuring. Everything else here builds on that principle.
How to Calculate Lead Conversion Rate
The formula is simple. The execution is where teams get it wrong.
Lead Conversion Rate = (Conversions ÷ Leads) x 100
That works for any stage-to-stage conversion - just swap the numerator and denominator for the relevant stages. The real challenge is the denominator.
Cognism's methodology gets this right. Instead of pulling "total leads this month" and "total customers this month" - which mixes cohorts and inflates or deflates the number - you track a specific cohort through the funnel:
- Pick your cohort window. All leads created in September, for example.
- Deduplicate by person or company ID. One person filling out three forms is one lead, not three.
- Count conversions from that same cohort who eventually closed - even if they closed in November.
- Divide and multiply by 100.
Worked example: 1,200 leads enter in September. By December, 84 have become customers. That's a 7.0% lead-to-customer conversion rate for the September cohort.
Here's the thing: the most common mistake isn't a math error. It's mixing leads from different months into a single snapshot report. Your October "conversion rate" looks great because you're counting customers who were actually September leads. Cohort tracking eliminates this entirely.
Benchmarks by Industry and Funnel Stage
Visitor-to-Lead Benchmarks
These numbers represent the percentage of unique website visitors who take a conversion action - filling out a form, requesting a demo, making a call. First Page Sage's dataset covers January 2022 through August 2025 across 25 industries.
| Industry | Visitor → Lead Rate |
|---|---|
| B2B SaaS | 1.1% |
| IT & Managed Services | 1.5% |
| Financial Services | 1.9% |
| Manufacturing | 2.2% |
| Higher Education | 2.8% |
| Legal Services | 7.4% |
For broader context, Ruler Analytics reports a 2.9% average qualified lead rate across 100M+ datapoints and 14 industries - broken down as 1.7% from forms and 1.2% from inbound calls. That call number matters more than most teams realize, because phone conversions are often invisible in standard analytics setups.
If you're benchmarking visitor-to-lead, compare like-for-like. Paid search vs paid search, organic vs organic. Blending everything into one sitewide average hides more than it reveals.
Full-Funnel Stage Benchmarks
These are stage-to-next-stage rates, not end-to-end. A 39% Lead→MQL rate doesn't mean 39% of leads become customers - it means 39% advance to the next stage. The compounding effect across stages is what produces the single-digit end-to-end numbers most teams see.
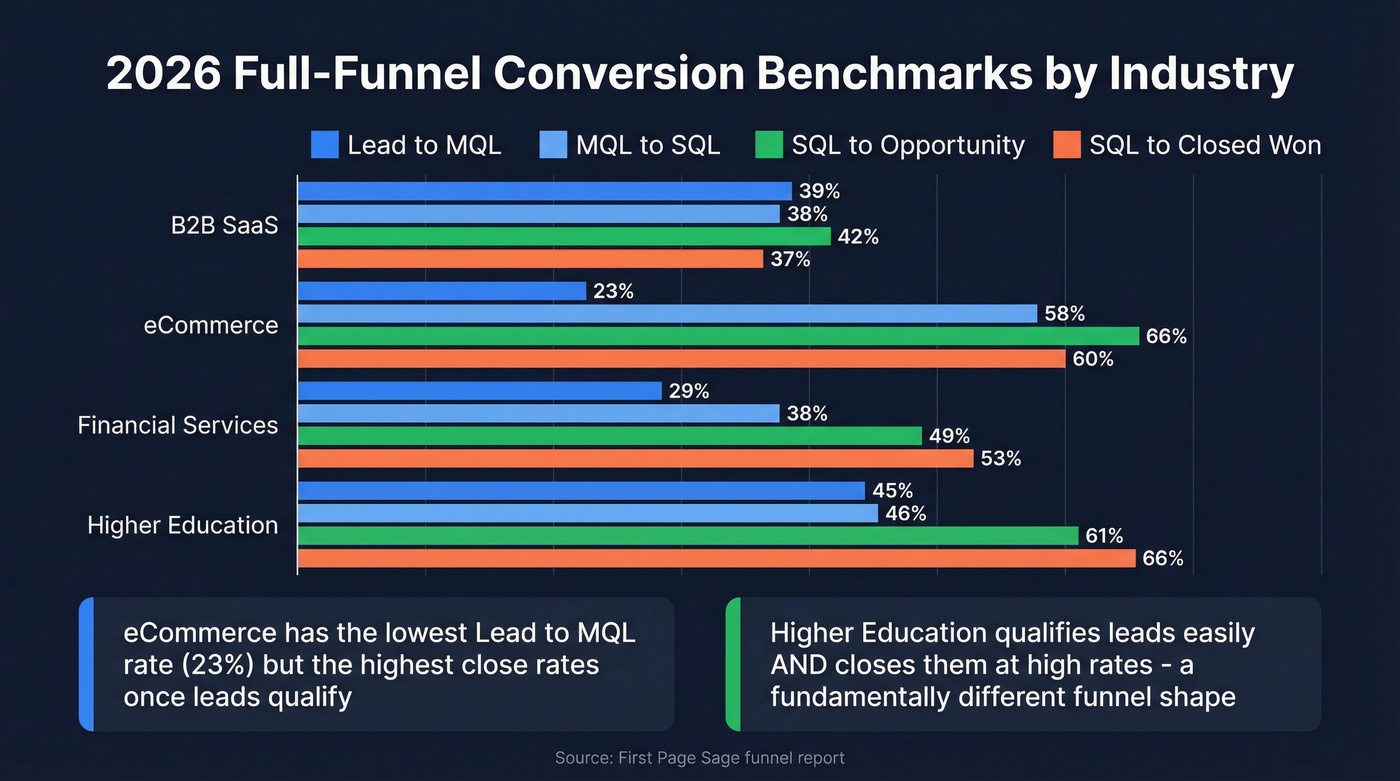
| Stage | Definition |
|---|---|
| Lead | Known to marketing but no clear intent |
| MQL | Clear buying interest, can afford, not yet sales-qualified |
| SQL | Received pricing info and wants to continue |
| Opportunity | Proposal or contract in hand |
Per First Page Sage's funnel report:
| Industry | Lead → MQL | MQL → SQL | SQL → Opp | SQL → Closed |
|---|---|---|---|---|
| B2B SaaS | 39% | 38% | 42% | 37% |
| eCommerce | 23% | 58% | 66% | 60% |
| Financial Services | 29% | 38% | 49% | 53% |
| Higher Education | 45% | 46% | 61% | 66% |
Notice how eCommerce has a low Lead→MQL rate but high close rates once leads qualify. Higher Education is the opposite pattern - lots of leads qualify, and they close at high rates too. The shape of your funnel matters as much as the headline number. DemandScience pegs the cross-industry average at roughly 12% for lead-to-opportunity, which gives you a useful gut-check.
Why Industry Averages Mislead
A 3% lead-to-customer rate for a $500 product is a disaster. A 3% rate for a $100K enterprise deal is excellent.
Let's be honest: if you're selling deals under $10K, stop benchmarking against enterprise SaaS conversion rates. A PLG company comparing itself to enterprise software benchmarks will either panic or get complacent - both for the wrong reasons. Internal benchmarking - month-over-month improvement on the same metric, measured the same way - is almost always more useful than chasing someone else's number.
Low conversion rates rarely start at the close - they start with bad data entering the funnel. When 35% of your emails bounce, every stage-to-stage metric collapses. Prospeo's 98% email accuracy and 5-step verification mean the leads in your pipeline are real people at real companies.
Stop diagnosing conversion problems that bad data created.
Why Your Conversion Rate Is Low
Before you optimize tactics, run through this diagnostic. Most conversion problems aren't sales problems - they're measurement and infrastructure problems.
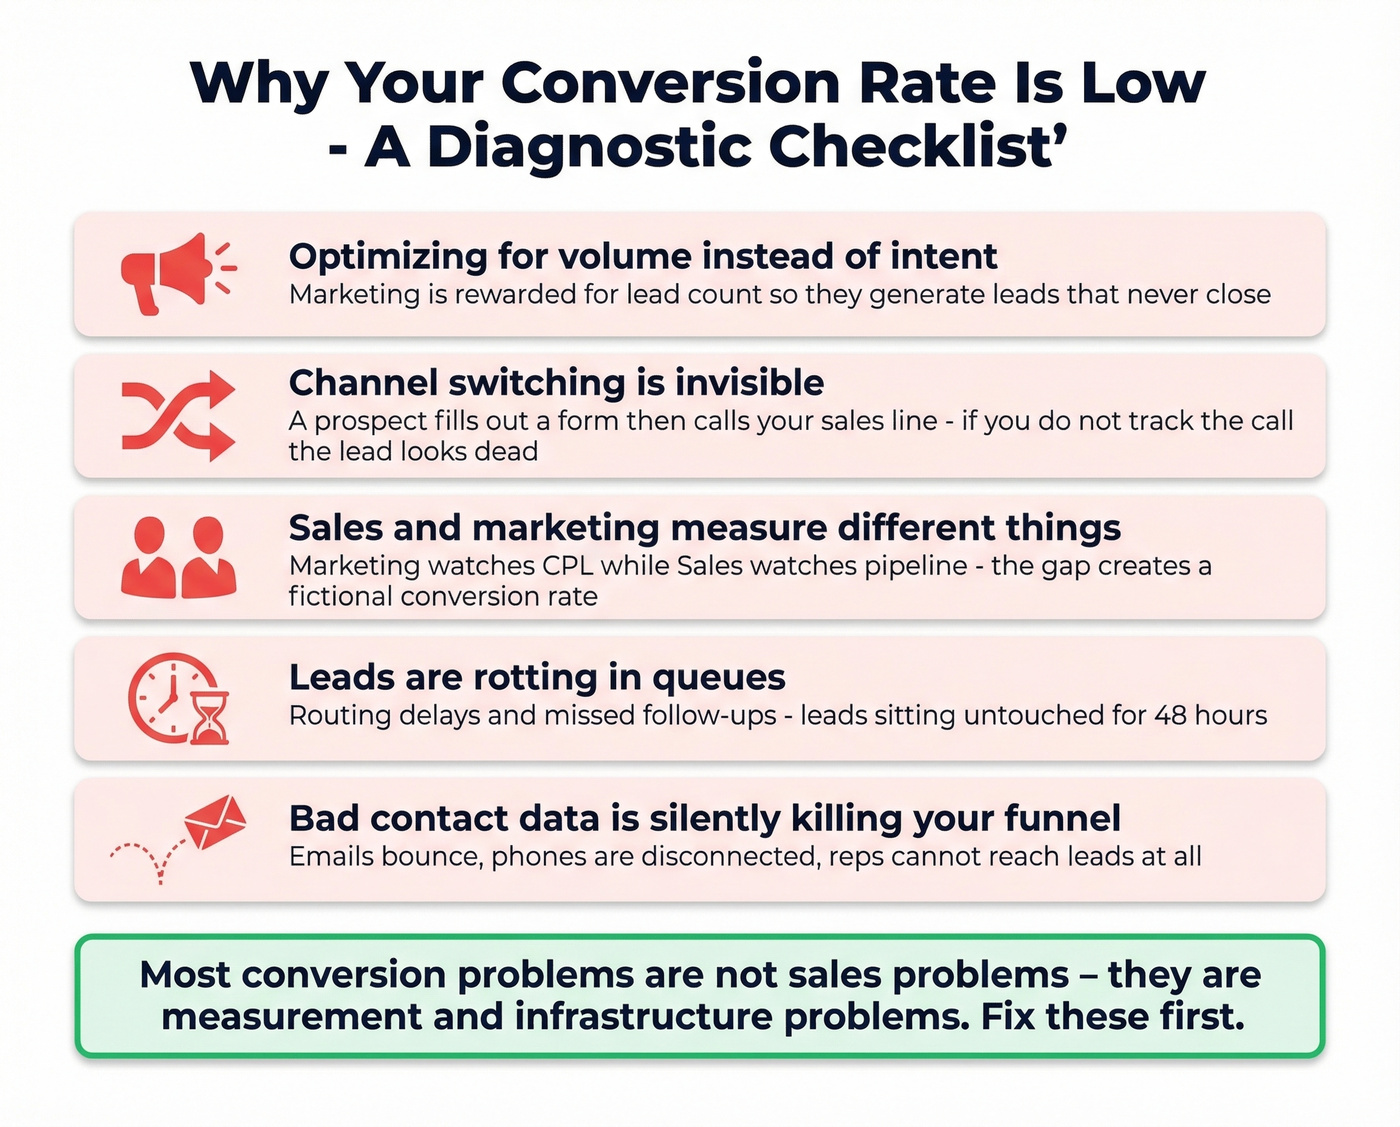
You're optimizing for volume instead of intent. If marketing is rewarded for lead count, they'll generate leads that never close. Clicks and form fills aren't pipeline.
Channel switching is invisible. A prospect fills out a form, then calls your sales line. If you're not tracking that call, the lead looks like it went cold. Infinity's research highlights this as a common blind spot, and we've seen it trip up teams that otherwise have solid analytics.
Sales and marketing are measuring different things. Marketing watches CPL. Sales watches pipeline. The gap between them creates a conversion rate that reflects organizational misalignment, not funnel performance.
Leads are rotting in queues. Routing delays, missed follow-ups, leads sitting untouched for 48 hours - none of this shows up in your dashboard. It just shows up as a lower number.
Bad contact data is silently killing your funnel. Emails bounce, phones are disconnected, reps can't reach leads at all. Your conversion rate absorbs this damage without ever flagging the root cause.
How to Improve Lead Conversion Rate
Fix Your Data First
This is the most underrated conversion lever in B2B. If 20-30% of your emails bounce, your reps are wasting cycles on unreachable leads, your domain reputation is degrading, and your conversion rate is absorbing damage that has nothing to do with your sales process.
Prospeo's email verification delivers 98% accuracy at roughly $0.01 per email, with a 7-day data refresh cycle. There's a free tier at 75 verifications per month if you want to test it before committing. The results speak for themselves: Snyk's team of 50 AEs cut their bounce rate from 35-40% to under 5%, and AE-sourced pipeline jumped 180%.
Before you redesign your landing page or rewrite your sequences, check how many of those leads your reps can actually reach. In our experience, the answer explains more than any A/B test.
Respond in Under 5 Minutes
The 2011 Lead Response Management Study by Dr. James Oldroyd found that leads contacted within 5 minutes are 21x more likely to enter the sales process than those contacted after 30 minutes. The decay curve is brutal: at 5-10 minutes you're at roughly 80% effectiveness, at 10-30 minutes you're at 50%, and at 30-60 minutes you're down to 25%.
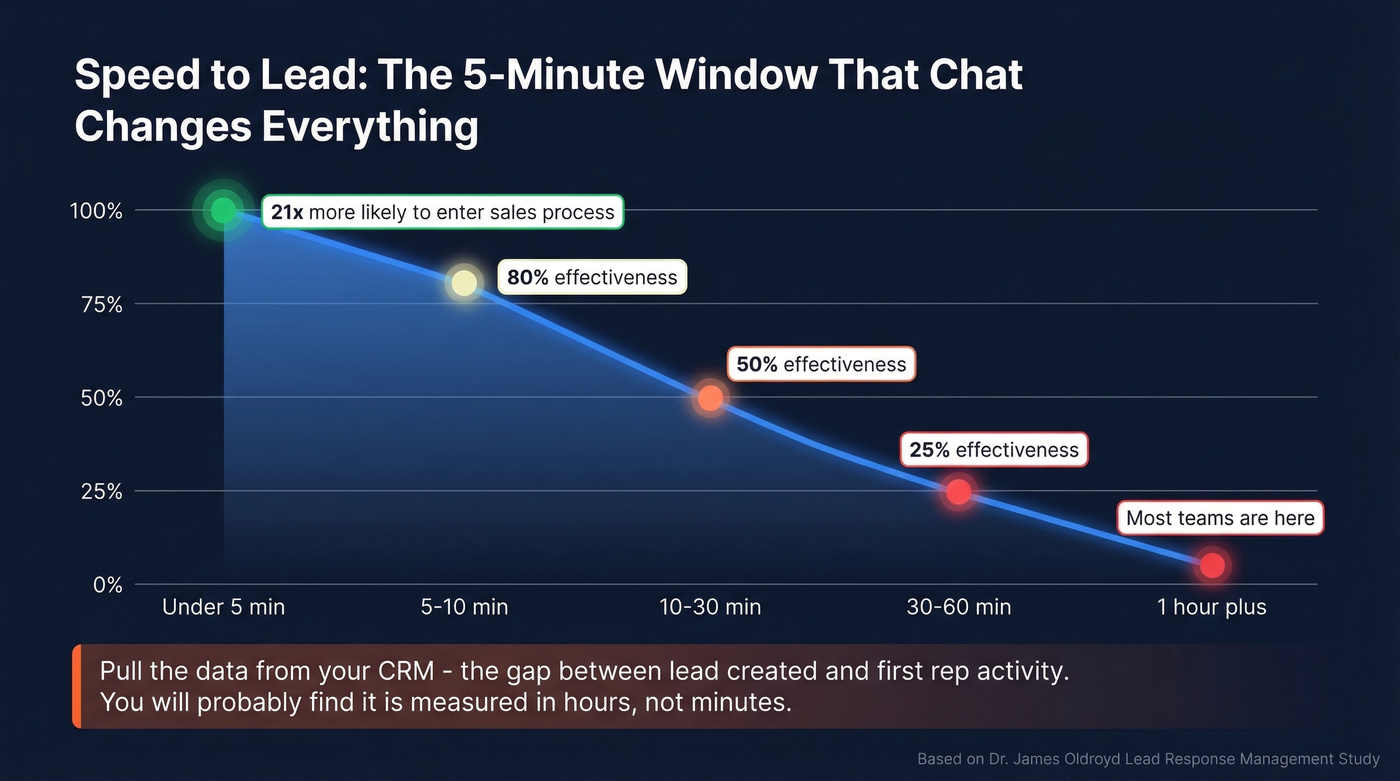
Most teams know this stat. Very few actually measure their response time. Pull the data from your CRM - the gap between "lead created" and "first rep activity" - and you'll probably find it's measured in hours, not minutes.
Align on Definitions
If marketing counts form fills as "leads" and sales counts discovery calls as "leads," your "conversion rate" is fiction. Get both teams to agree on stage definitions using the framework above. It takes 30 minutes and saves months of finger-pointing.
Capture Intent, Not Just Information
Generic "Contact Us" forms convert at 3-5% with half the leads being low-quality. Self-serve scoping tools, ROI calculators, and interactive assessments capture higher-intent signals because the prospect is doing real work, not just filling in fields. The lead volume drops, but the quality - and downstream conversion - goes up dramatically.
Skip this approach if your average deal size is under $2K. The engineering cost of building an interactive tool won't pay back at that price point. A well-designed form with qualifying questions gets you 80% of the way there.
Measure Cohorts, Not Snapshots
If you're pulling "leads this month" and "customers this month" into the same report, you're mixing time periods and getting a number that doesn't mean anything. Track the September cohort through to close. Track the October cohort separately. Your conversion rate will be lower - and it'll be real.
Benchmarking conversion rates is pointless if your denominator is polluted with junk leads. Prospeo's 30+ filters - buyer intent, technographics, headcount growth, funding - let you build lists of in-market buyers so your lead-to-customer rate reflects sales execution, not data quality.
Better inputs, better conversion rates. Start at $0.01 per email.
What a 1% Improvement Is Worth
Say you generate 1,000 leads per month with a 5% lead-to-customer conversion rate and a $10,000 average deal. That's 50 customers and $500,000 in monthly revenue.
A single percentage point improvement - from 5% to 6% - means 10 more customers per month. At $10,000 each, that's $100,000 in additional monthly revenue, or $1.2M per year. No additional ad spend. No new headcount. Just 10 more leads converting that weren't converting before.
Context matters here. At a $500 ACV, that same 1% lift is worth $5,000/month - meaningful but not transformative. At $100K ACV, it's $1M/month. CRO agencies typically target 5-7% conversion rate growth per engagement, and even the low end of that range produces outsized revenue returns.
Before you buy another tool or hire another SDR, calculate what a single percentage point is worth to your business. For most B2B companies, the answer is large enough to justify serious investment in data quality and speed-to-lead - the two cheapest levers to pull.
FAQ
What is a good lead conversion rate?
For B2B visitor-to-lead, 1-3% is typical; above 3% is strong. For lead-to-customer, 5-10% is solid for mid-market deals, while enterprise cycles with $100K+ ACV often see 2-4% and still perform well. The most useful benchmark is your own month-over-month trend on the same metric, not a generic industry average.
How do you calculate lead conversion rate?
Divide the number of next-stage conversions from a specific lead cohort by the total leads in that cohort, then multiply by 100. Use a defined time window (all September leads, for example) and deduplicate by person or company ID. Cohort-based tracking prevents the common mistake of mixing leads from different time periods into one misleading snapshot.
How does bad data hurt conversion rates?
If 20-30% of your contact data is invalid, reps can't reach those leads at all - and your conversion rate silently absorbs the loss. Snyk cut bounce rates from 35-40% to under 5% after switching to verified data, and AE-sourced pipeline jumped 180%. Verifying emails before outreach is the fastest way to lift conversion without changing your sales process.
What's the fastest way to improve lead conversion?
Speed-to-lead has the highest ROI: leads contacted within 5 minutes are 21x more likely to enter the sales process than those contacted at 30 minutes. Pair sub-5-minute response times with verified contact data and clear stage definitions between sales and marketing for the biggest immediate impact.