LTV:CAC Calculator - Plus What Your Ratio Actually Means
Your LTV:CAC ratio is probably the most-cited metric in your investor deck and the least-trusted number in your spreadsheet. This calculator gives you the ratio instantly, but the formula is simple. The assumptions behind it are where things break.
The quick version:
- Your ratio should be at least 3:1 - but above 5:1 may mean you're under-investing in growth.
- Pair it with CAC payback period (target 12 months or less). A great ratio with 3-year payback still kills your cash.
- If your formula LTV feels too good to be true, it probably is. Validate against actual cohort revenue.
LTV:CAC Calculator
Plug in your monthly ARPA, gross margin %, churn rate %, total sales & marketing spend, and new customers acquired. You'll get LTV, CAC, the ratio, and your CAC payback period in months.
Don't trust the output blindly. The sections below explain why.
The Formulas Behind the Calculator
LTV = (ARPA x Gross Margin %) / Monthly Churn Rate
CAC = Total S&M Spend / New Customers Acquired
LTV:CAC Ratio = LTV / CAC
One detail most calculators skip: use gross margin, not revenue. Harvard Business School recommends contribution-margin-based LTV. Using raw revenue inflates your number dramatically for a typical SaaS business running 70-85% gross margins. That's the difference between a healthy-looking ratio and a misleading one. Getting this step right determines whether every downstream metric - ratio, payback, fundraising narrative - holds up under scrutiny.
Worked Example
Say your SaaS company has ARPA of $100/mo, 80% gross margin, 5% monthly churn, $50,000/mo in S&M spend, and 50 new customers per month.
LTV = ($100 x 0.80) / 0.05 = $1,600 CAC = $50,000 / 50 = $1,000 Ratio = $1,600 / $1,000 = 1.6:1 Payback = $1,000 / ($100 x 0.80) = 12.5 months
Acceptable but tight. A 1.6:1 ratio with 12.5-month payback means you're recovering costs with almost no margin for error. If churn ticks up even slightly, this breaks.
A 1.6:1 ratio breaks when churn ticks up - but it also breaks when 30% of your outreach bounces. Every dead email inflates CAC without producing a single conversation. Prospeo delivers 98% verified emails at ~$0.01/lead, so your acquisition spend actually reaches real buyers.
Fix your CAC denominator before you optimize anything else.
What's a Good LTV:CAC Ratio?
| Ratio | Interpretation | What to Do |
|---|---|---|
| < 1:1 | Broken economics | Pause paid acquisition |
| 1-2:1 | Urgent | Fix unit economics now |
| 2-3:1 | Acceptable | Optimize aggressively |
| 3-5:1 | Healthy | Scale with confidence |
| > 5:1 | Possibly under-investing | Spend more on growth |
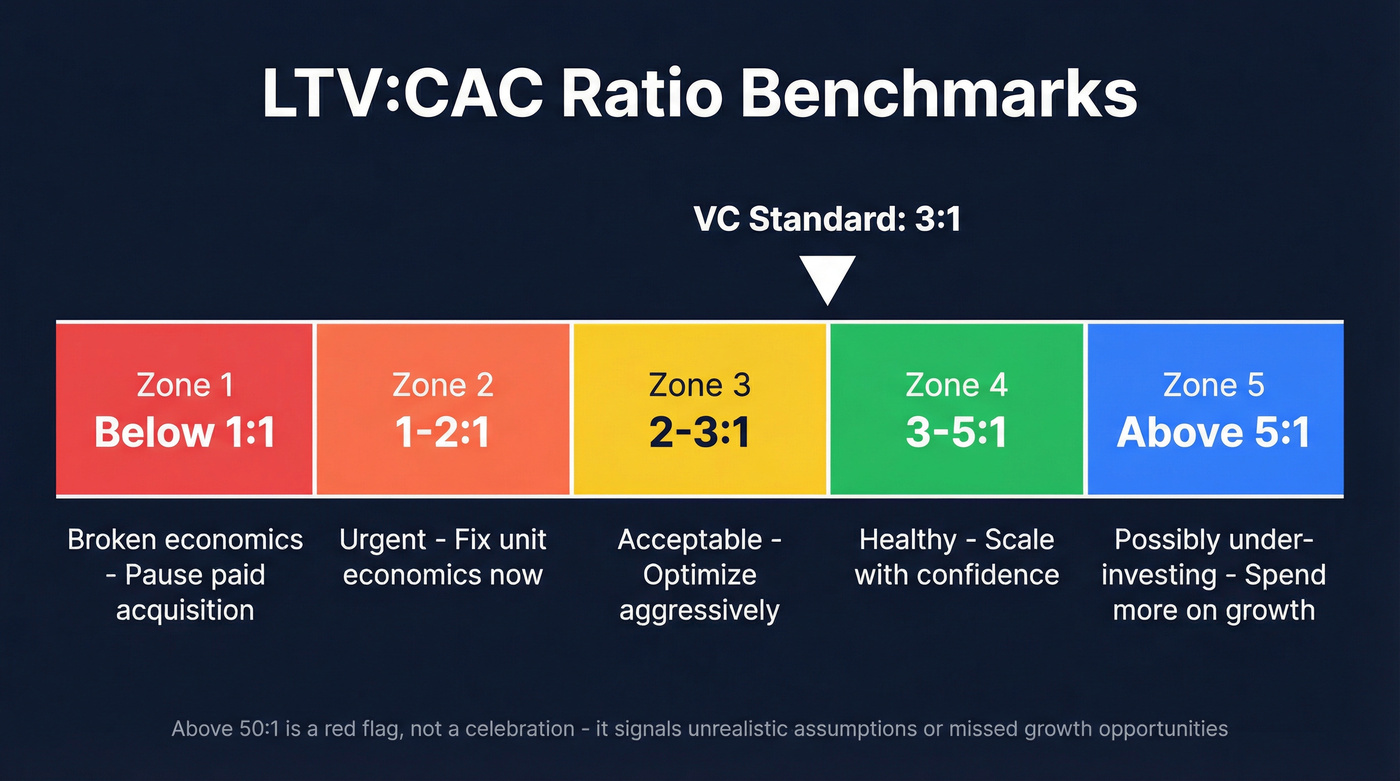
The 3:1 benchmark is the standard VC heuristic. Here's the thing: if your ratio is above 50:1, VCs don't celebrate - they close the deck. A ratio that high signals wildly optimistic assumptions or a company leaving growth on the table.
Track your ratio quarterly. A single snapshot is less useful than the trend. A declining 4:1 is more alarming than a stable 2.5:1.
When LTV:CAC Lies to You
Your ratio is probably wrong - and that's okay, as long as you know why.
A SaaS founder on r/analytics shared a perfect example: ARPU of $40 with 10% monthly churn gives a formula LTV of $400. When they analyzed what churned customers actually spent, the average was around $160. The formula assumes customers churn at a steady, predictable rate. They don't.
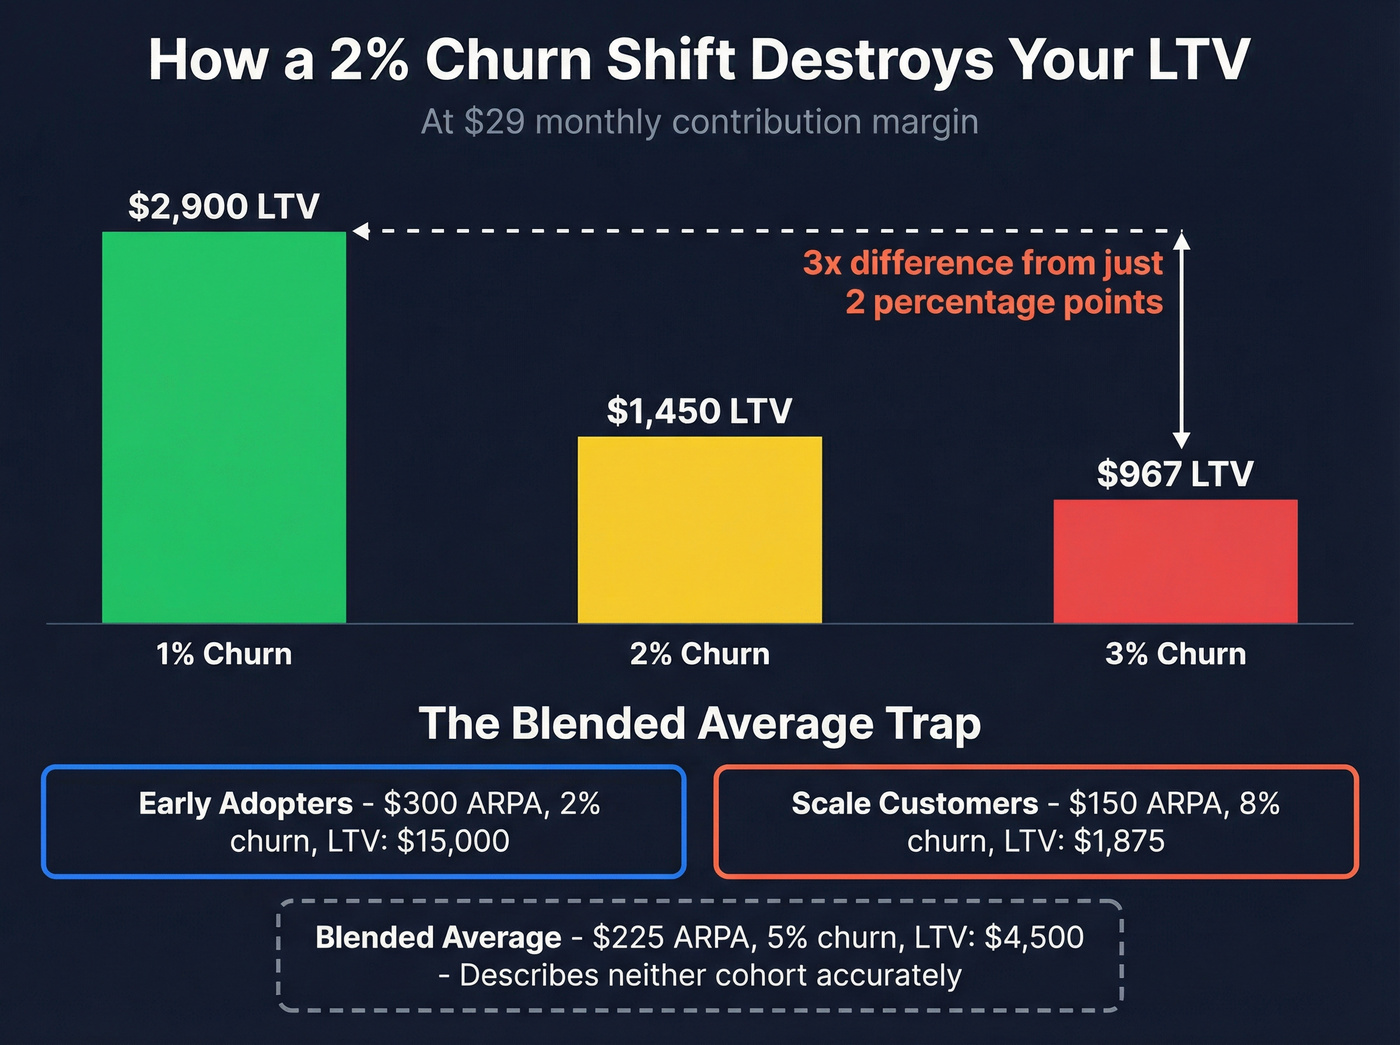
Churn sensitivity is brutal. At a $29 monthly contribution margin, changing your churn assumption from 1% to 3% swings LTV from $2,900 to $967 - a 3x difference from a 2-percentage-point shift. That single input change can flip your entire fundraising story.
Then there's the blended average trap. Imagine Early Adopters at $300 ARPA with 2% churn (LTV: $15,000) alongside Scale customers at $150 ARPA with 8% churn (LTV: $1,875). Blend them and you get ARPA of $225 with 5% churn - LTV of $4,500. That number describes neither cohort accurately. The cohort-based approach fixes this, but it requires actual retention data, not assumptions.
A common take on r/SaaS is that LTV is "theoretical" and payback period is the metric that actually matters for operational decisions. They're not wrong.
CAC Payback Period
Payback tells you when you get your money back. The calculator above uses the simple version: CAC / (ARPA x Gross Margin). For operational planning, the more precise formula subtracts average cost-to-serve from that denominator.
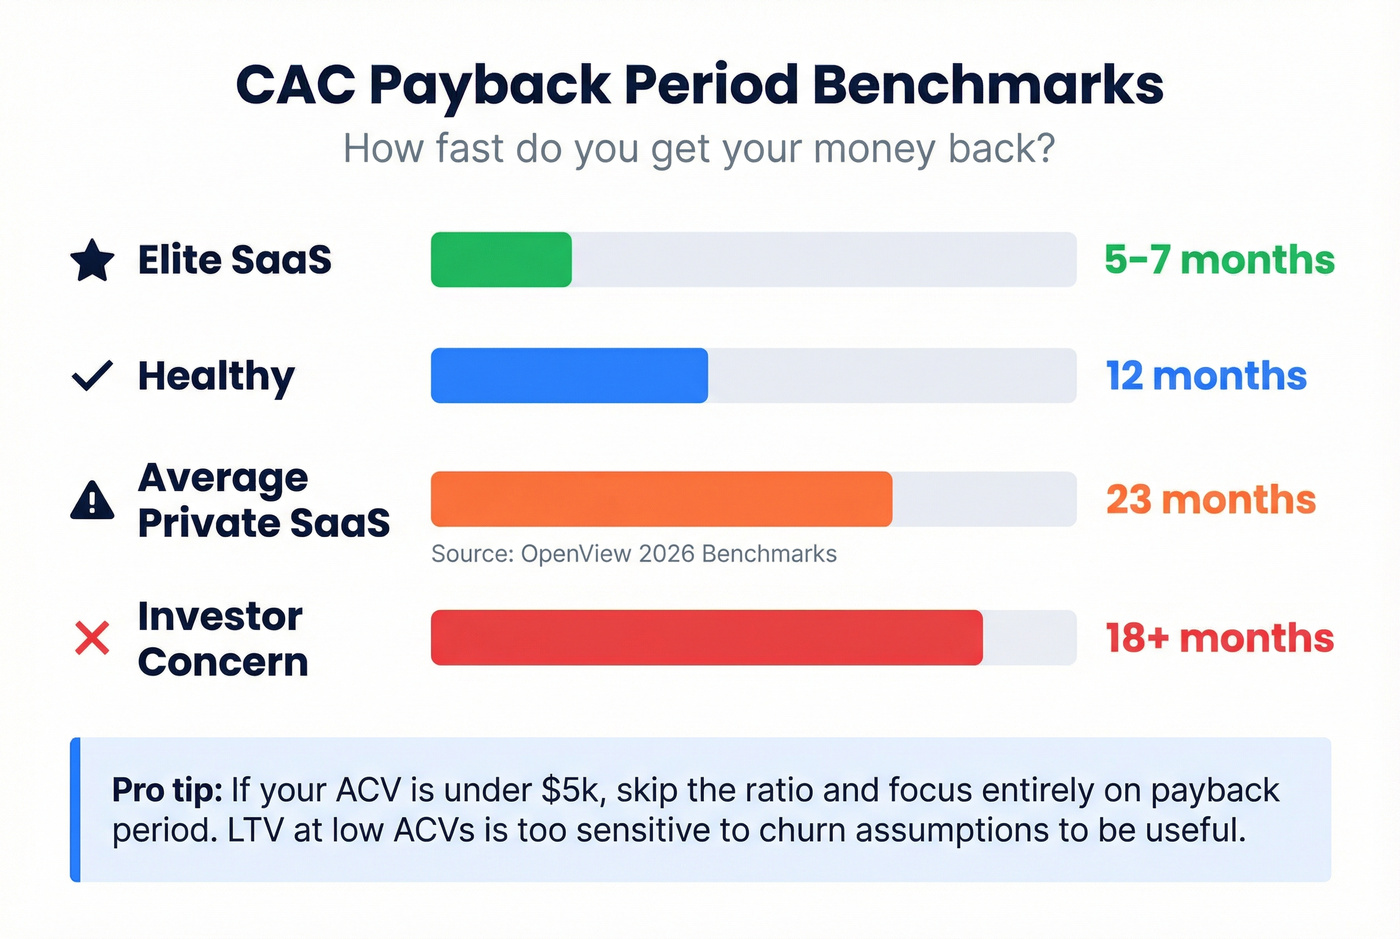
Benchmarks worth knowing:
- Elite SaaS: 5-7 months
- Healthy: 12 months or less
- Average private SaaS: ~23 months per OpenView's 2026 benchmarks
- Investor concern threshold: 18+ months
The decision is simple. Prioritize payback when you're cash-constrained, prioritize the ratio when you're fundraising. A 2:1 ratio with 6-month payback can be better than 5:1 with 36-month payback, because the second scenario ties up cash for years.
Let's be honest: if your annual contract value is under $5k, stop obsessing over the ratio and focus entirely on payback period. LTV calculations at low ACVs are so sensitive to churn assumptions that the number becomes fiction. Payback is grounded in actual cash flow.
How to Improve Your Ratio
Increase LTV
Reduce churn. It's the highest-leverage move. Even a 1% improvement in monthly churn compounds dramatically over a customer's lifetime, and it costs far less than acquiring a new customer to replace the one you lost. Beyond retention, expand revenue through upsells and cross-sells. In our experience, teams that segment by cohort and target retention efforts at their highest-value segments see 2-3x the impact of blanket retention programs.
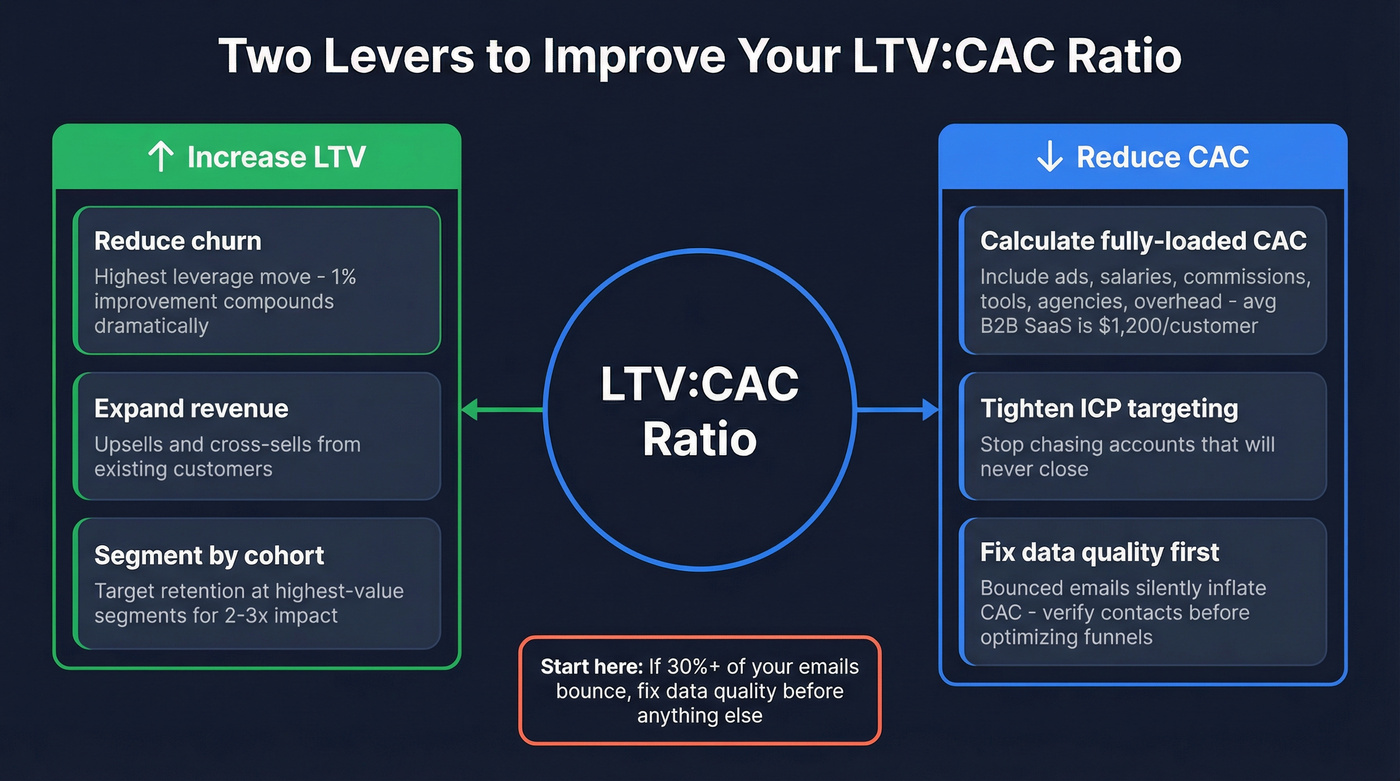
Reduce CAC
First, make sure you're calculating fully-loaded CAC: ads, salaries, commissions, tools, agencies, and overhead. Average B2B SaaS CAC runs around $1,200/customer - if yours is far below that, you're probably undercounting.
Then attack the waste. Tighten ICP targeting so reps aren't chasing accounts that'll never close. And cut wasted outreach. If 30% of your emails bounce, your effective CAC is materially higher than your spreadsheet says. Every bounced email is acquisition spend that produced nothing. We've seen teams drop their bounce rate from 35% to under 4% just by switching to verified contact data through Prospeo, which runs 98% email accuracy at roughly $0.01/lead. That alone moved the needle on their real CAC.
Skip the ratio optimization entirely if you haven't fixed your data quality first. Bad contacts inflate CAC silently, and no amount of funnel tweaking compensates for emails that never land.
Teams using Prospeo cut bounce rates from 35% to under 4% and book 26% more meetings than ZoomInfo users. That's a direct hit on your fully-loaded CAC - and a ratio improvement you can measure in weeks, not quarters.
Stop inflating CAC with emails that never land.
FAQ
What LTV:CAC ratio do investors want?
Most VCs target 3-5:1. Above 5:1 is excellent, but anything past 50:1 raises red flags - it signals under-investment in growth or unrealistic retention assumptions baked into the model.
Should I use revenue or gross margin for LTV?
Always gross margin. Revenue-based LTV inflates the number by 15-30% for a typical SaaS company running 70-85% margins, making your ratio look healthier than it actually is.
Why is my ratio good but I'm still burning cash?
Your CAC payback period is probably too long. A 5:1 ratio with 36-month payback ties up cash for years - target 12 months or less. Also check whether bad contact data is inflating your CAC. Bounced emails and wrong numbers are pure waste that silently drags your real acquisition cost higher.
How often should I recalculate LTV:CAC?
Quarterly at minimum, using the latest 90-day churn and spend data. A single snapshot tells you almost nothing. The trend is what matters - a declining 4:1 is more alarming than a stable 2.5:1.