SaaS Magic Number: Formula, Benchmarks & What to Do (2026)
Your board deck is due Friday, and the magic number your SaaS team obsesses over just dropped from 0.71 to 0.52. Last quarter's slide had a green arrow. Now you're staring at a red one, your VP of Sales wants answers, and your CFO is asking whether the GTM engine is broken.
Before you panic - or worse, start cutting headcount - make sure you actually understand what this number is telling you. And what it isn't.
The quick version:
Formula: (Current Quarter Revenue - Previous Quarter Revenue) x 4 / Previous Quarter S&M Spend
| Magic Number | What It Means | What to Do | |---|---|---| | < 0.5 | GTM model isn't working yet | Rethink the motion | | 0.5 - 0.75 | Workable but inefficient | Optimize before scaling | | 0.75 - 1.0 | Efficient - scale with confidence | Pour on the gas | | > 1.0 | Exceptional efficiency | Accelerate aggressively |
If you need to present this Friday, the table above is enough. If you need to understand what the number actually means and what to do when it's ugly, keep reading.
What Is the SaaS Magic Number?
The metric traces back to Rory O'Driscoll at Scale Venture Partners. While evaluating Omniture, he noticed the company was generating more than $2 in first-year revenue for every $1 invested in go-to-market. He called it "Magic" - and the name stuck.
The core problem it solves is simple. Traditional S&M-as-a-percentage-of-revenue is misleading for subscription businesses because revenue in any given quarter reflects prior selling, not current-quarter efficiency. A company could be spending wildly inefficiently right now, but last year's deals are still generating recurring revenue that masks the problem. You need a metric that isolates the return on incremental GTM investment.
O'Driscoll's insight was to compare the change in revenue to the S&M spend that presumably caused it. He insisted on GAAP inputs rather than internal metrics, for a reason he put bluntly: "If you fudge your GAAP numbers you go to prison." That makes the metric comparable across public companies - no creative accounting, no custom definitions. It's crude, but it's honest.
The tradeoff? O'Driscoll himself admits the metric is "way too simple." It ignores churn, gross margins, and the distinction between new sales and upsells. We'll get to why that matters.
The Formula (Both Variants)
Two ways to calculate the magic number exist, and which one you use depends on what data you have access to.
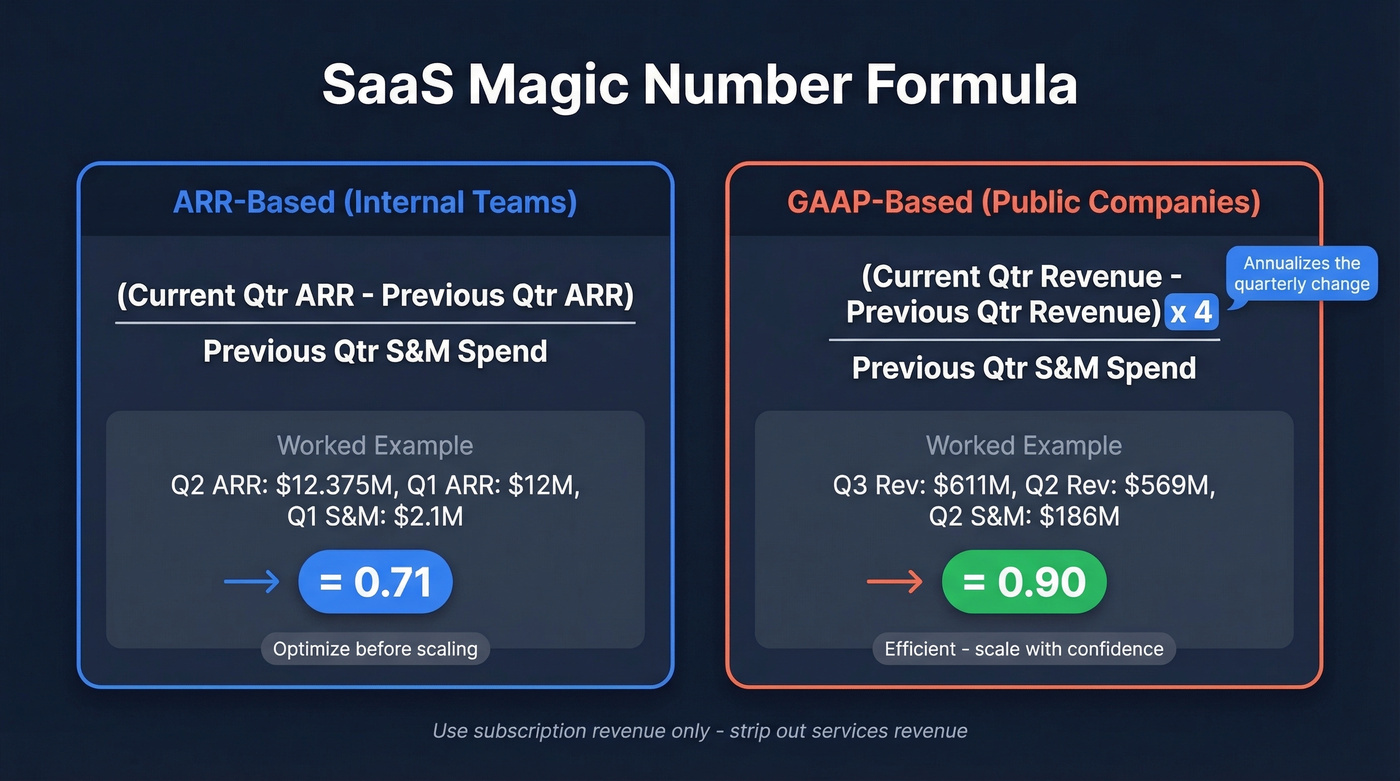
ARR-Based (Internal Teams)
Magic Number = (Current Quarter ARR - Previous Quarter ARR) / Previous Quarter S&M Spend
Use this when you have ARR data - meaning you're on the finance team, in the investor data room, or running the model internally.
Worked example: Your company ended Q1 at $12M ARR and Q2 at $12.375M ARR. Q1 S&M spend was $2.1M.
Magic Number = ($12.375M - $12M) x 4 / $2.1M = $0.375M x 4 / $2.1M = $1.5M / $2.1M = 0.71
That's right in the "workable but optimize before scaling" zone.
GAAP-Based (Public Companies)
Magic Number = (Current Quarter Revenue - Previous Quarter Revenue) x 4 / Previous Quarter S&M Spend
Use this when you're analyzing from a 10-Q filing - benchmarking competitors, evaluating acquisition targets, or building a public-company comp set. The x4 annualizes the quarterly revenue change.
One important caveat: use subscription (recurring) revenue only. If a company has significant professional services revenue, including it will inflate the numerator and distort the ratio. Strip out services revenue before calculating.
Worked example: A company's subscription revenue grew from $569M in Q2 to $611M in Q3, and Q2 S&M expense was $186M.
Magic Number = ($611M - $569M) x 4 / $186M = $42M x 4 / $186M = $168M / $186M = ~0.90
Which Variant to Use
If you have ARR data, use ARR - it's cleaner for internal analysis. If you're analyzing from a 10-Q, use GAAP subscription revenue with the annualization multiplier. Don't mix the two in the same analysis, and don't compare an ARR-based number to a GAAP-based one without noting the difference.
Benchmarks That Actually Help
The Standard Thresholds
| Magic Number | Interpretation | Recommended Action |
|---|---|---|
| < 0.5 | Model isn't working | Pause scaling, diagnose |
| 0.5 - 0.75 | Functional but inefficient | Optimize unit economics |
| 0.75 - 1.0 | Efficient growth | Scale with confidence |
| > 1.0 | Exceptional | Accelerate aggressively |
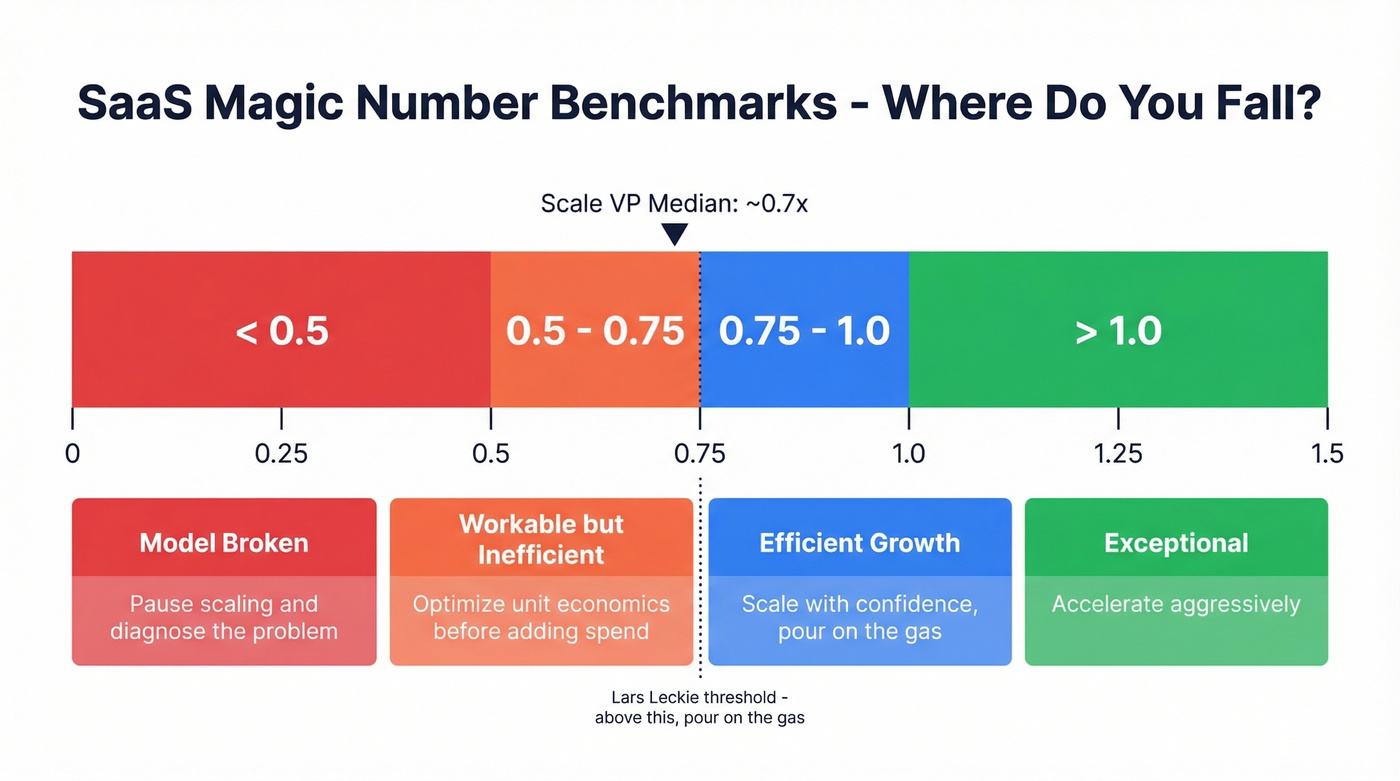
Investor Lars Leckie put it memorably: if you're below 0.75, step back; if you're above 0.75, pour on the gas; if you're anywhere above 1.5, call him immediately.
The most authoritative baseline comes from Scale VP's own dataset. Their long-term median across private SaaS companies hovers around ~0.7x - healthy, but not spectacular. That's the number most companies should benchmark against, not the aspirational 1.0+.
Context Matters More Than the Number
A Series A company at $3M ARR and an enterprise company at $100M ARR should interpret these thresholds completely differently. The Series A company might post a 1.2x ratio simply because a handful of large deals closed in the same quarter. The enterprise company hitting 0.6x might be performing well given its market maturity and 9-month sales cycles.
Benchmarkit's 2025 report provides useful adjacent context. Median growth across their dataset was 26%, and median New CAC Ratio was $2.00 per $1 of new customer ARR. S&M as a percentage of revenue ran 47% for VC-backed companies versus 33% for PE-backed ones. Expansion ARR accounted for 40% of total new ARR - a number that rises above 50% for companies past $50M.
Here's a dynamic worth understanding: AI-native SaaS companies are reaching $100M ARR in an average of 5.7 years versus the 7.5-year average across the broader Cloud 100. That compressed timeline can produce inflated efficiency ratios driven by market tailwinds rather than GTM discipline - another reason to look past the raw number.
There's also a macro cycle to consider. Scale VP documented a negative correlation between public EV/Revenue multiples and private-company efficiency scores. When capital is cheap and public multiples are high, companies step on the gas, efficiency drops, and the metric declines. When the market tightens, efficiency improves - partly because it has to. Your number doesn't exist in a vacuum. It exists in a market. This insight alone is worth more than the benchmark table above, and almost nobody talks about it.
A magic number below 0.75 often means your S&M spend is leaking - reps chasing bad contacts, emails bouncing, pipelines full of dead leads. Prospeo's 98% email accuracy and 30% mobile pickup rate mean more of every GTM dollar converts to actual conversations. Teams using Prospeo book 26% more meetings than ZoomInfo users.
Stop optimizing a formula when the real fix is better data.
When the SaaS Magic Number Lies
The Causation Problem
The formula implicitly attributes all revenue growth to S&M spend. That's a convenient assumption and often a wrong one.
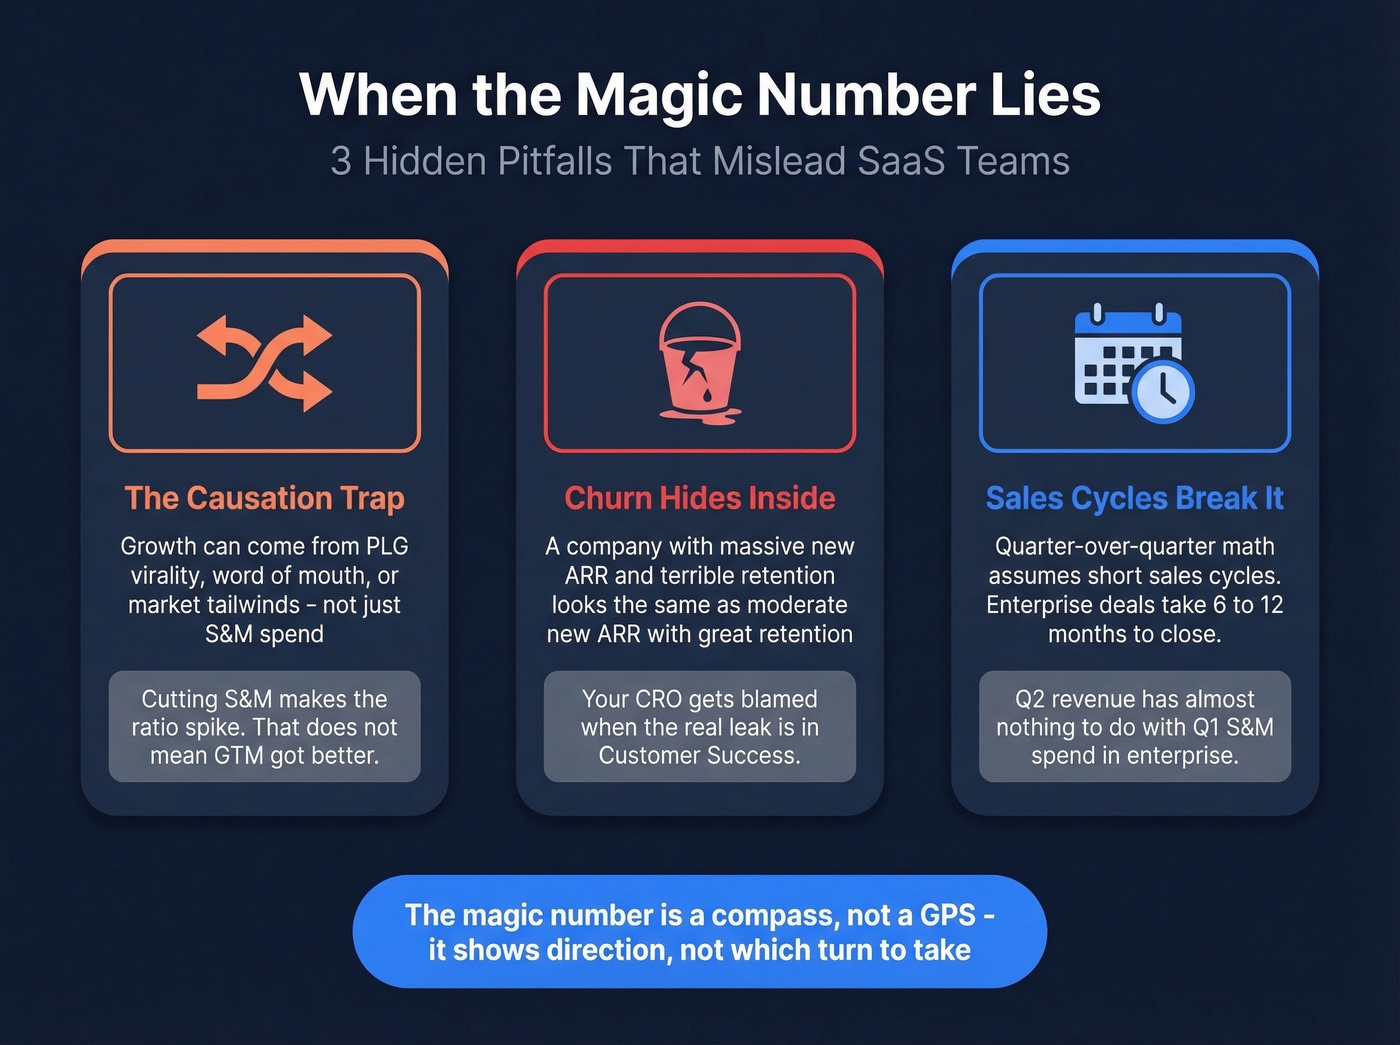
Growth can come from R&D improvements, PLG virality, organic inbound, word-of-mouth, or pure market tailwinds - none of which show up in the S&M line. As Nnamdi Okike articulated well, the metric confuses correlation with causality. It can rise mechanically when S&M is cut (the denominator shrinks) and fall when S&M ramps (the denominator inflates before revenue catches up). A company that fires half its marketing team might see its ratio spike - that doesn't mean the GTM engine got more efficient.
Churn Hides Inside the Number
Net revenue growth equals new ARR minus churned ARR. A company with massive gross new ARR and terrible retention can post the same result as one with moderate new ARR and excellent retention. The metric can't tell the difference.
To separate these effects, many operators track gross sales efficiency (new ARR generated per S&M dollar) alongside net sales efficiency (which accounts for churn and contraction). The magic number only captures the net view, so a declining figure could signal either a sales problem or a retention problem - and the fix is completely different depending on which one it is.
Here's the thing: beating up your CRO over a bad number when the real problem is logo churn is a common and expensive mistake. We've seen this pattern play out at multiple companies - the board fixates on the ratio while the actual leak is in customer success.
Enterprise Sales Cycles Break It
The quarter-over-quarter structure assumes relatively short sales cycles. If your average deal takes 6-12 months to close, Q2 revenue has almost nothing to do with Q1 S&M spend. For enterprise motions, the measurement window should match the cycle length. A trailing-12-month comparison is far more meaningful than QoQ.
The consensus on r/SaaS and r/sales is that the metric is useful for investor communication, but day-to-day decisions come more from sales cycle length, win rate by rep, and churn by cohort.
That doesn't make it useless. It makes it a compass, not a GPS. It tells you the general direction. It doesn't tell you which turn to take.
How to Improve Your Sales Efficiency
If your magic number is below where you want it, you have four levers.
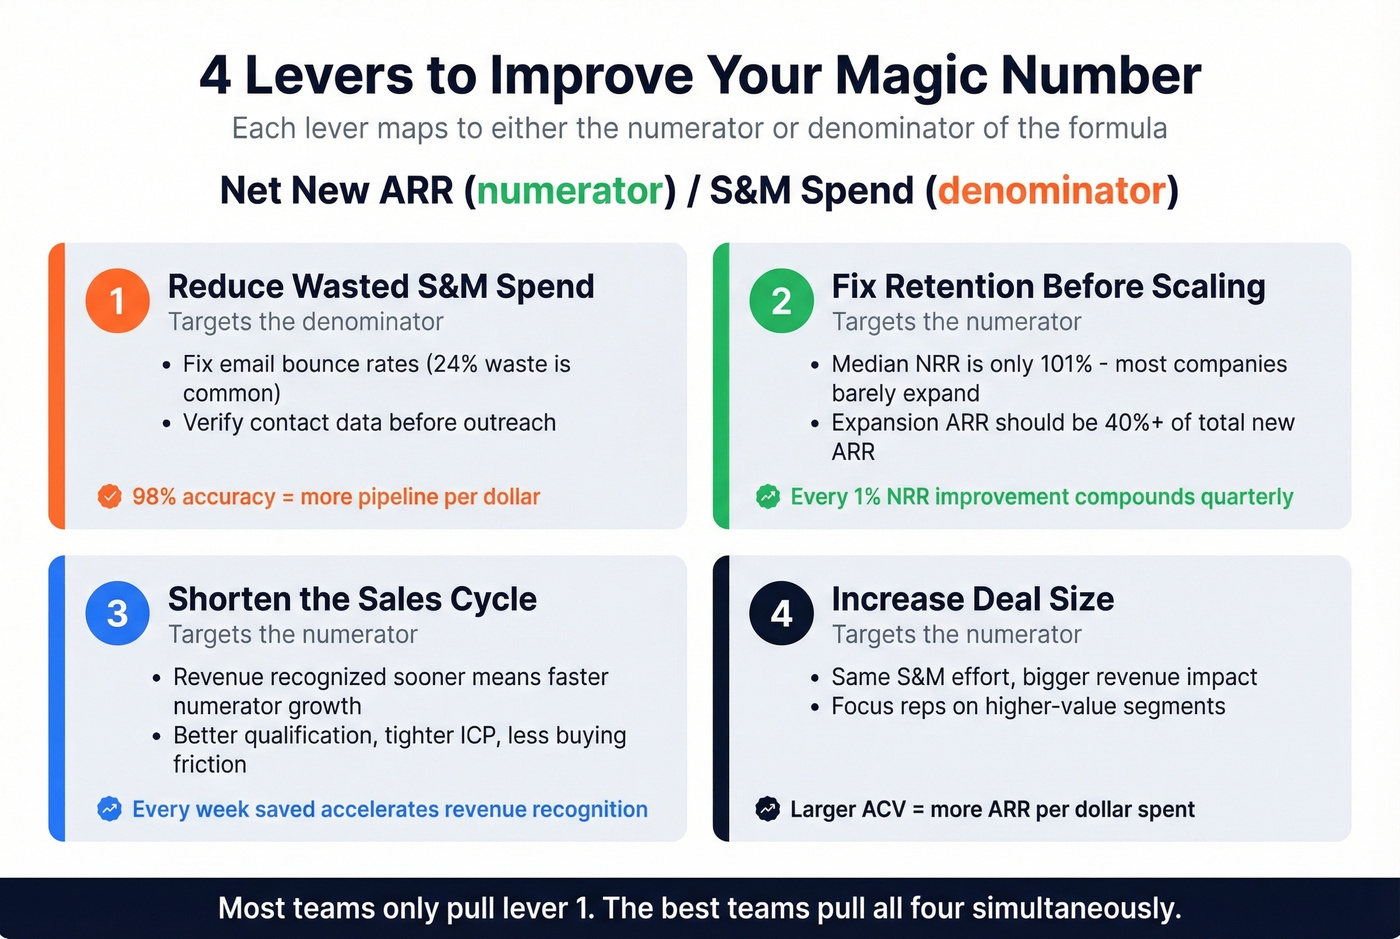
Reduce Wasted S&M Spend
The denominator problem is underappreciated. Every dollar spent on outreach that goes nowhere inflates S&M cost without generating a dollar of pipeline. If your SDR team sent 50,000 emails last quarter and 12,000 bounced, that's 24% of your outbound volume contributing to S&M spend without generating anything.
This is where data quality becomes a GTM efficiency problem, not just an ops annoyance. Prospeo's 98% email accuracy and 7-day data refresh cycle mean your outbound actually reaches real inboxes - teams using it book 26% more meetings than those using ZoomInfo, which translates directly to more pipeline per S&M dollar. At roughly $0.01 per verified email, it barely registers in your S&M budget, but the impact on the denominator is real.

Fix Retention Before Scaling Acquisition
Let's be honest: fixing retention is one of the highest-leverage moves for your efficiency ratio, and most teams ignore it in favor of pouring more into acquisition. Churn reduces net revenue growth, which reduces the numerator. If you can improve retention and expansion, the number improves even if S&M spend stays flat.
Benchmarkit's data shows a median NRR of 101%, which means most SaaS companies are barely expanding within their existing customer base. Expansion revenue accounts for 40% of total new ARR in their dataset. If your expansion motion is underperforming that benchmark, you're leaving efficiency points on the table.
Shorten the Sales Cycle
Faster close means revenue gets recognized sooner, which means the numerator grows faster relative to the same S&M spend. Better qualification, tighter ICP targeting, and removing friction from the buying process are the levers here. Every week you shave off the average deal cycle shows up in the ratio within a quarter or two.
This is one of the most overlooked paths to improving revenue efficiency - it costs nothing extra and directly accelerates the numerator.
Align Measurement to Reality
If you have a 9-month enterprise cycle, stop measuring QoQ. Use trailing-12-month. Segment by motion - PLG self-serve and enterprise outbound will have fundamentally different efficiency profiles. Blending them into one ratio is like averaging the temperature in Phoenix and Anchorage and calling it useful.
Magic Number vs. CAC Payback vs. LTV:CAC
These three metrics get conflated constantly. They measure different things.
| Metric | Includes Margin? | Time Horizon | Output | Best For |
|---|---|---|---|---|
| Magic Number | No | Quarter-over-quarter | Ratio (e.g., 0.7x) | Public-company benchmarking |
| CAC Payback | Yes | Months to break even | Months (e.g., 18 mo) | Internal planning |
| LTV:CAC | Yes | Full customer lifetime | Ratio (e.g., 3:1) | Long-run unit economics |
| Bessemer CAC Ratio | Yes | Annual | Ratio (margin-adjusted) | Margin-aware efficiency |
The biggest blind spot is that the magic number ignores gross margin entirely. A score of 1.0 means you covered S&M in about a year - but you could still be underwater once you factor in COGS. CAC Payback and LTV:CAC both adjust for margin, which is why they're more useful for internal planning and budgeting.
The Bessemer CAC Ratio deserves a mention here. It's a margin-adjusted efficiency metric designed to tie growth more directly to the gross profit that can pay back acquisition costs. If your gross margins vary significantly across customer segments, a margin-adjusted view will give you a more honest picture than the raw ratio.
If you can only track one efficiency metric, make it CAC Payback. But if you're presenting to investors or benchmarking against public companies, you need the magic number SaaS investors expect to see. They're complementary, not competing.
FAQ
What is a good SaaS magic number?
Scale VP's long-run median is ~0.7x across private SaaS companies. Above 0.75x signals efficient growth worth scaling; above 1.0x is exceptional. Below 0.5x suggests the go-to-market model needs rethinking before further investment. Stage, ACV, and sales motion all shift what "good" means for your specific business.
How often should you calculate it?
Quarterly, aligned to your financial reporting cadence. For enterprise motions with 6-12 month sales cycles, also compute a trailing-12-month version to smooth out quarter-to-quarter noise that makes the standard QoQ calculation unreliable.
Can you improve the ratio without increasing revenue?
Yes - by reducing wasted S&M spend in the denominator. Eliminating bad contact data, cutting underperforming channels, and tightening ICP targeting all shrink the denominator without requiring a single additional dollar of revenue.
How does the magic number relate to CAC payback?
The magic number measures incremental revenue per S&M dollar without adjusting for gross margin. CAC payback measures months to recoup fully loaded acquisition cost using gross-margin-adjusted revenue. A 0.75x magic number roughly translates to a 16-month CAC payback at 75% gross margin - but the exact relationship depends on your margin profile and cost allocation.
If expansion ARR is 40%+ of your new ARR, your magic number depends on reaching the right buyers inside existing accounts fast. Prospeo's 30+ filters - including headcount growth, technographics, and buyer intent across 15,000 topics - surface upsell targets your CRM doesn't know about yet.
Turn your denominator into pipeline, not waste. Start free today.