Sales Pipeline Calculator: How Much Pipeline Do You Actually Need?
It's week 6 of the quarter. Your VP pulls up the forecast call and asks the question everyone dreads: "Do we have enough pipeline to hit the number?" You stare at a Salesforce dashboard that says $3.2M, but you don't actually know if that's enough - because you've never run the numbers through a proper pipeline calculator.
Looking for a pipe volume calculator for plumbing or engineering? Omnicalculator has you covered. This guide is about sales pipeline math - the formulas, benchmarks, and activity models that tell you whether your team will hit quota or miss it by a mile.
What You Need (Quick Version)
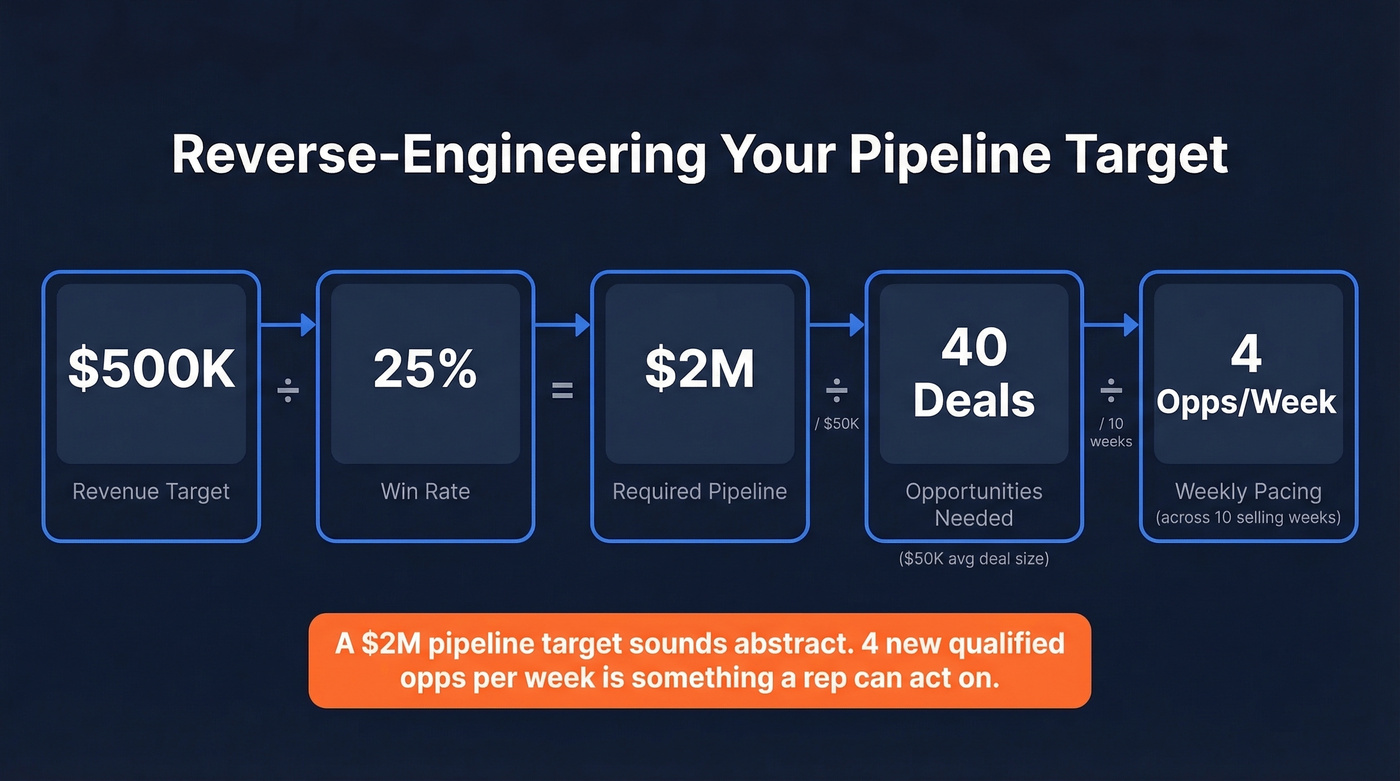
How much pipeline do you need? Revenue target / win rate = required pipeline. If your target is $500K and you close at 25%, you need $2M in pipeline. That's the baseline.
Is that enough? Check your coverage ratio against segment benchmarks:
- SMB: 2-3x quota
- Mid-market: 2.5-4x quota
- Enterprise: 3-5x quota
How fast is it moving? Pipeline velocity = (Qualified Opps x Avg Deal Size x Win Rate) / sales cycle length. This tells you how much revenue your pipeline generates per day. If that number's shrinking, you've got a problem regardless of total coverage.
The Full Pipeline Math
Start with four inputs: your revenue target, your historical win rate, your average deal size, and your sales cycle length.
| Input | Example Value |
|---|---|
| Revenue target | $500K |
| Win rate | 25% |
| Avg deal size | $50K |
| Sales cycle | 90 days |
$500K / 25% win rate = $2M required pipeline. That's the total value of opportunities you need in play to statistically hit your number.
Now break it down further. $500K target / $50K average deal = 10 deals you need to win. At a 25% win rate, you need 40 total deals in your pipeline to produce those 10 wins. With a 90-day sales cycle in a 90-day quarter, you can't wait until week 8 to start filling the funnel - you need roughly 40 concurrent opportunities across various stages at any given time, which means pipeline generation is a week-one priority, not something you scramble on mid-quarter.
The OnPipeline calculator takes this further by computing weekly pacing: how many new deals you need to open per week to maintain that pipeline level. That works out to roughly 4 new qualified opportunities per week (40 deals across ~10 selling weeks). A $2M pipeline target sounds abstract. "Open 4 new qualified opportunities per week" is something a rep can act on.
Coverage Ratio Explained
The "3x rule" is one of the most repeated - and most dangerous - rules of thumb in sales. Pipeline coverage ratio is simple: total pipeline divided by quota. $3M pipeline on a $1M quota = 3x coverage. Sounds healthy, right?
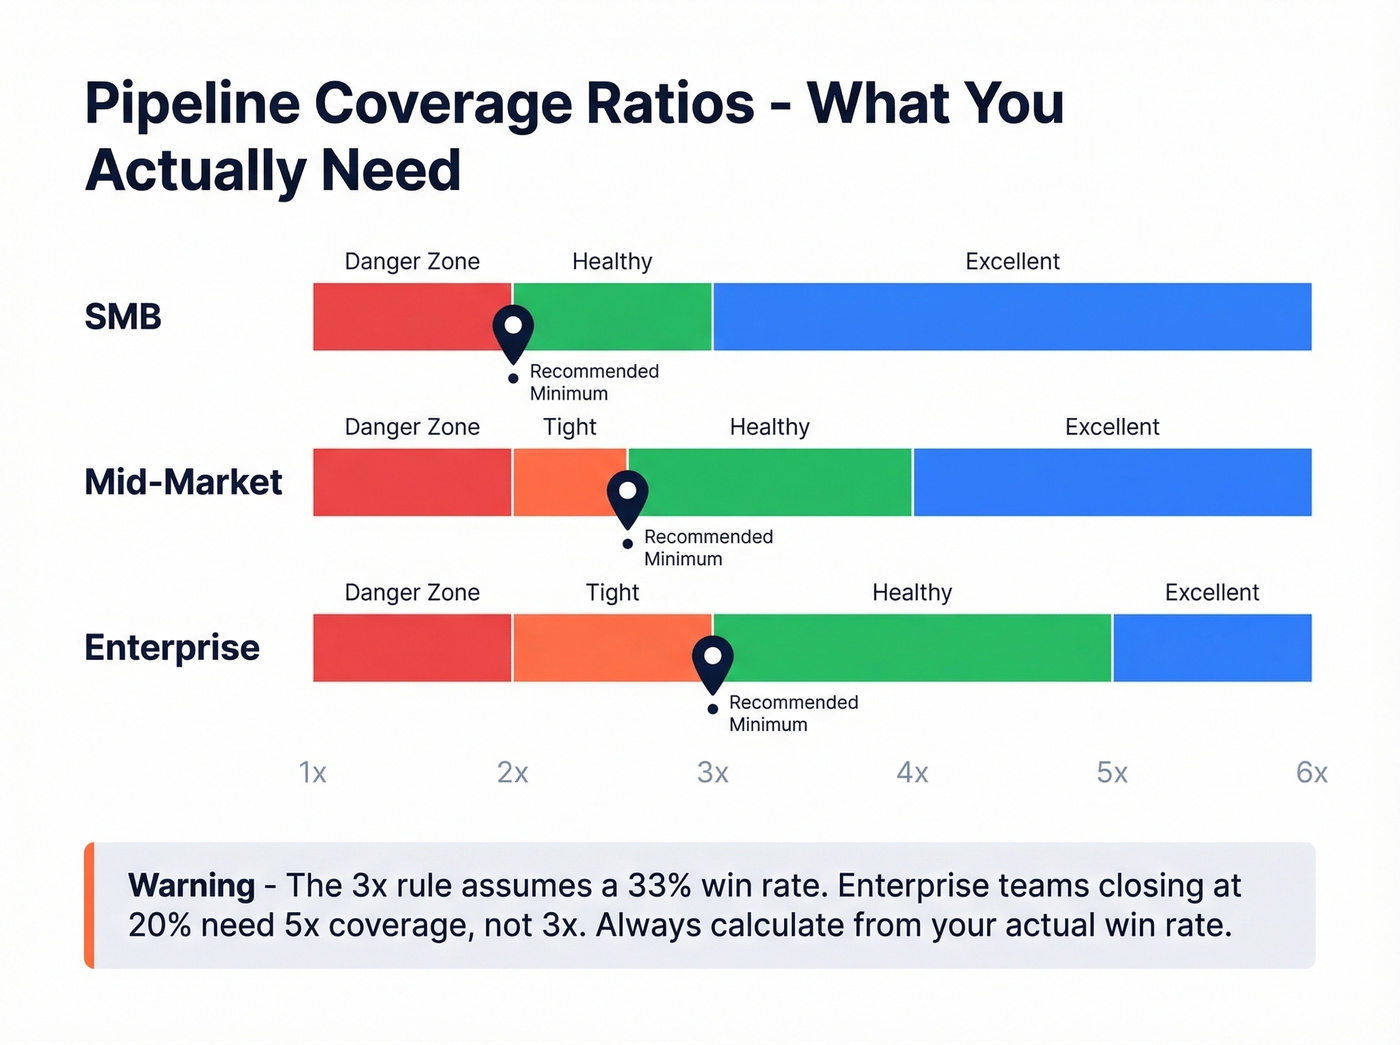
Here's the thing: a 3x ratio assumes you're closing roughly 33% of your pipeline. Enterprise teams close at 20-25%. If you're running 3x coverage with a 20% win rate, you're going to miss by 40%. The math doesn't lie.
That's why weighted pipeline matters more than raw coverage. Instead of treating every deal equally, multiply each deal's value by its stage conversion probability. A $100K deal in the proposal stage at 50% probability contributes $50K of weighted pipeline. Sum those up and you get a much more honest picture of where you stand.
The stat that should keep RevOps leaders up at night: high-ICP accounts represent only 23% of total pipeline for many organizations. The rest is filler that inflates your coverage ratio without actually converting. We've seen this pattern over and over - teams celebrate a fat pipeline number that's mostly low-fit deals destined for Closed Lost.
| Coverage Level | Ratio | What It Means |
|---|---|---|
| Excellent | 4x+ | Comfortable buffer |
| Healthy | 3-4x | On track if win rate holds |
| Moderate | 2-3x | Tight - needs monitoring |
| Low | <2x | Red flag |
Those numbers shift by segment:
| Segment | Healthy Coverage |
|---|---|
| SaaS | 3-4x |
| Enterprise | 4-5x |
| SMB | 2-3x |
If you're an enterprise team running at 3x and feeling good about it, recalculate with your actual win rate. You probably need 5x.
Velocity: The Metric That Matters Most
Coverage tells you if you have enough. Velocity tells you if it's moving fast enough:
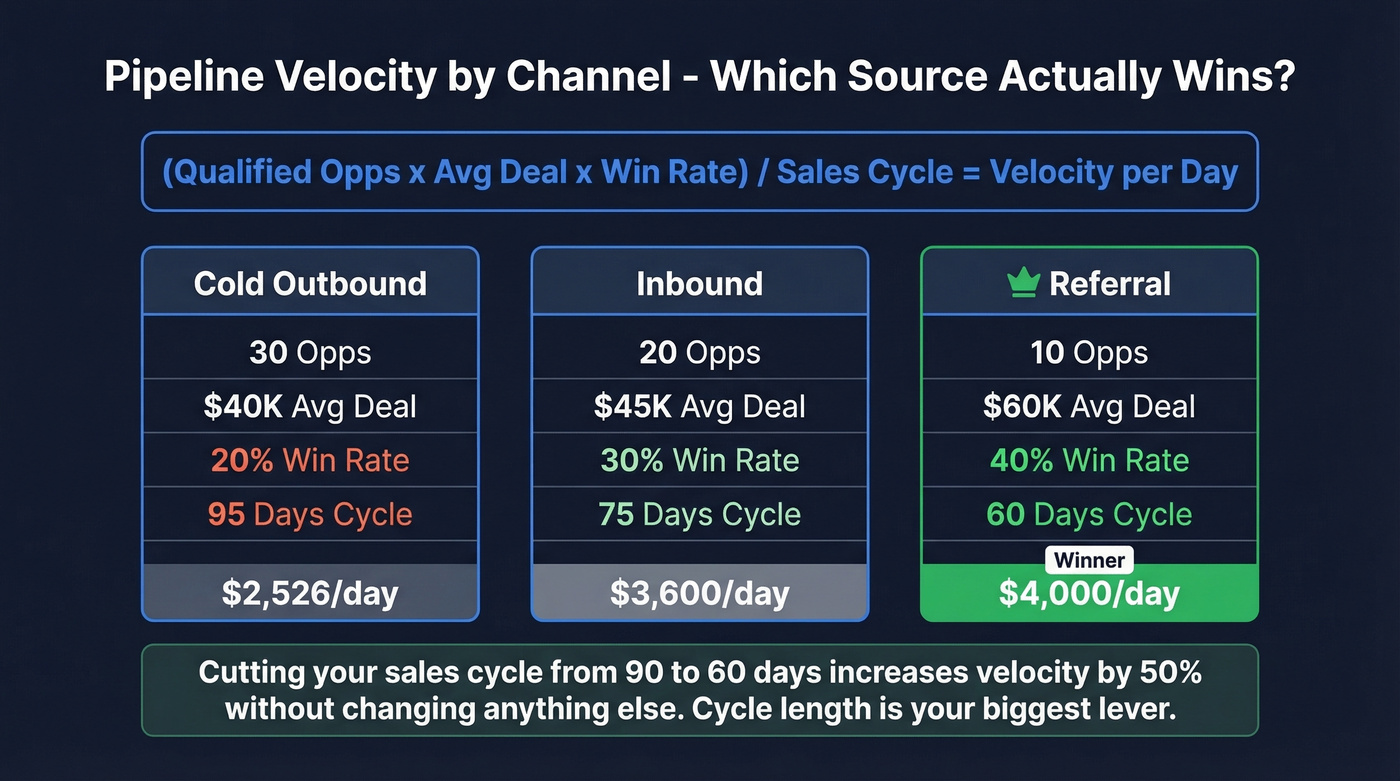
Pipeline Velocity = (Qualified Opps x Avg Deal Size x Win Rate) / Sales Cycle Length
A worked example from UserGems: 25 qualified opportunities x $30K average deal x 23% win rate / 90-day cycle = $1,923/day in pipeline-generated revenue. Scale that up - 50 opps, $50K deals, 25% win rate, same 90-day cycle - and you're at $6,944/day. The gap between those two numbers shows why velocity is the metric that separates scaling teams from stalling ones.
What makes velocity powerful is that you can compare it across channels:
| Channel | Opps | Avg Deal | Win Rate | Cycle | Velocity/Day |
|---|---|---|---|---|---|
| Cold outbound | 30 | $40K | 20% | 95 days | $2,526 |
| Referral | 10 | $60K | 40% | 60 days | $4,000 |
| Inbound | 20 | $45K | 30% | 75 days | $3,600 |
Referrals crush everything else - not because of volume, but because of win rate and shorter cycles. Sales cycle length is the single biggest lever in the velocity equation. Cutting your cycle from 90 to 60 days increases velocity by 50% without touching any other variable. If you're looking for one thing to optimize, start there.
Activity-to-Pipeline Math
Let's reverse-engineer the daily activity needed to hit a pipeline target. This is where most teams get uncomfortable, because the numbers are bigger than they expect.
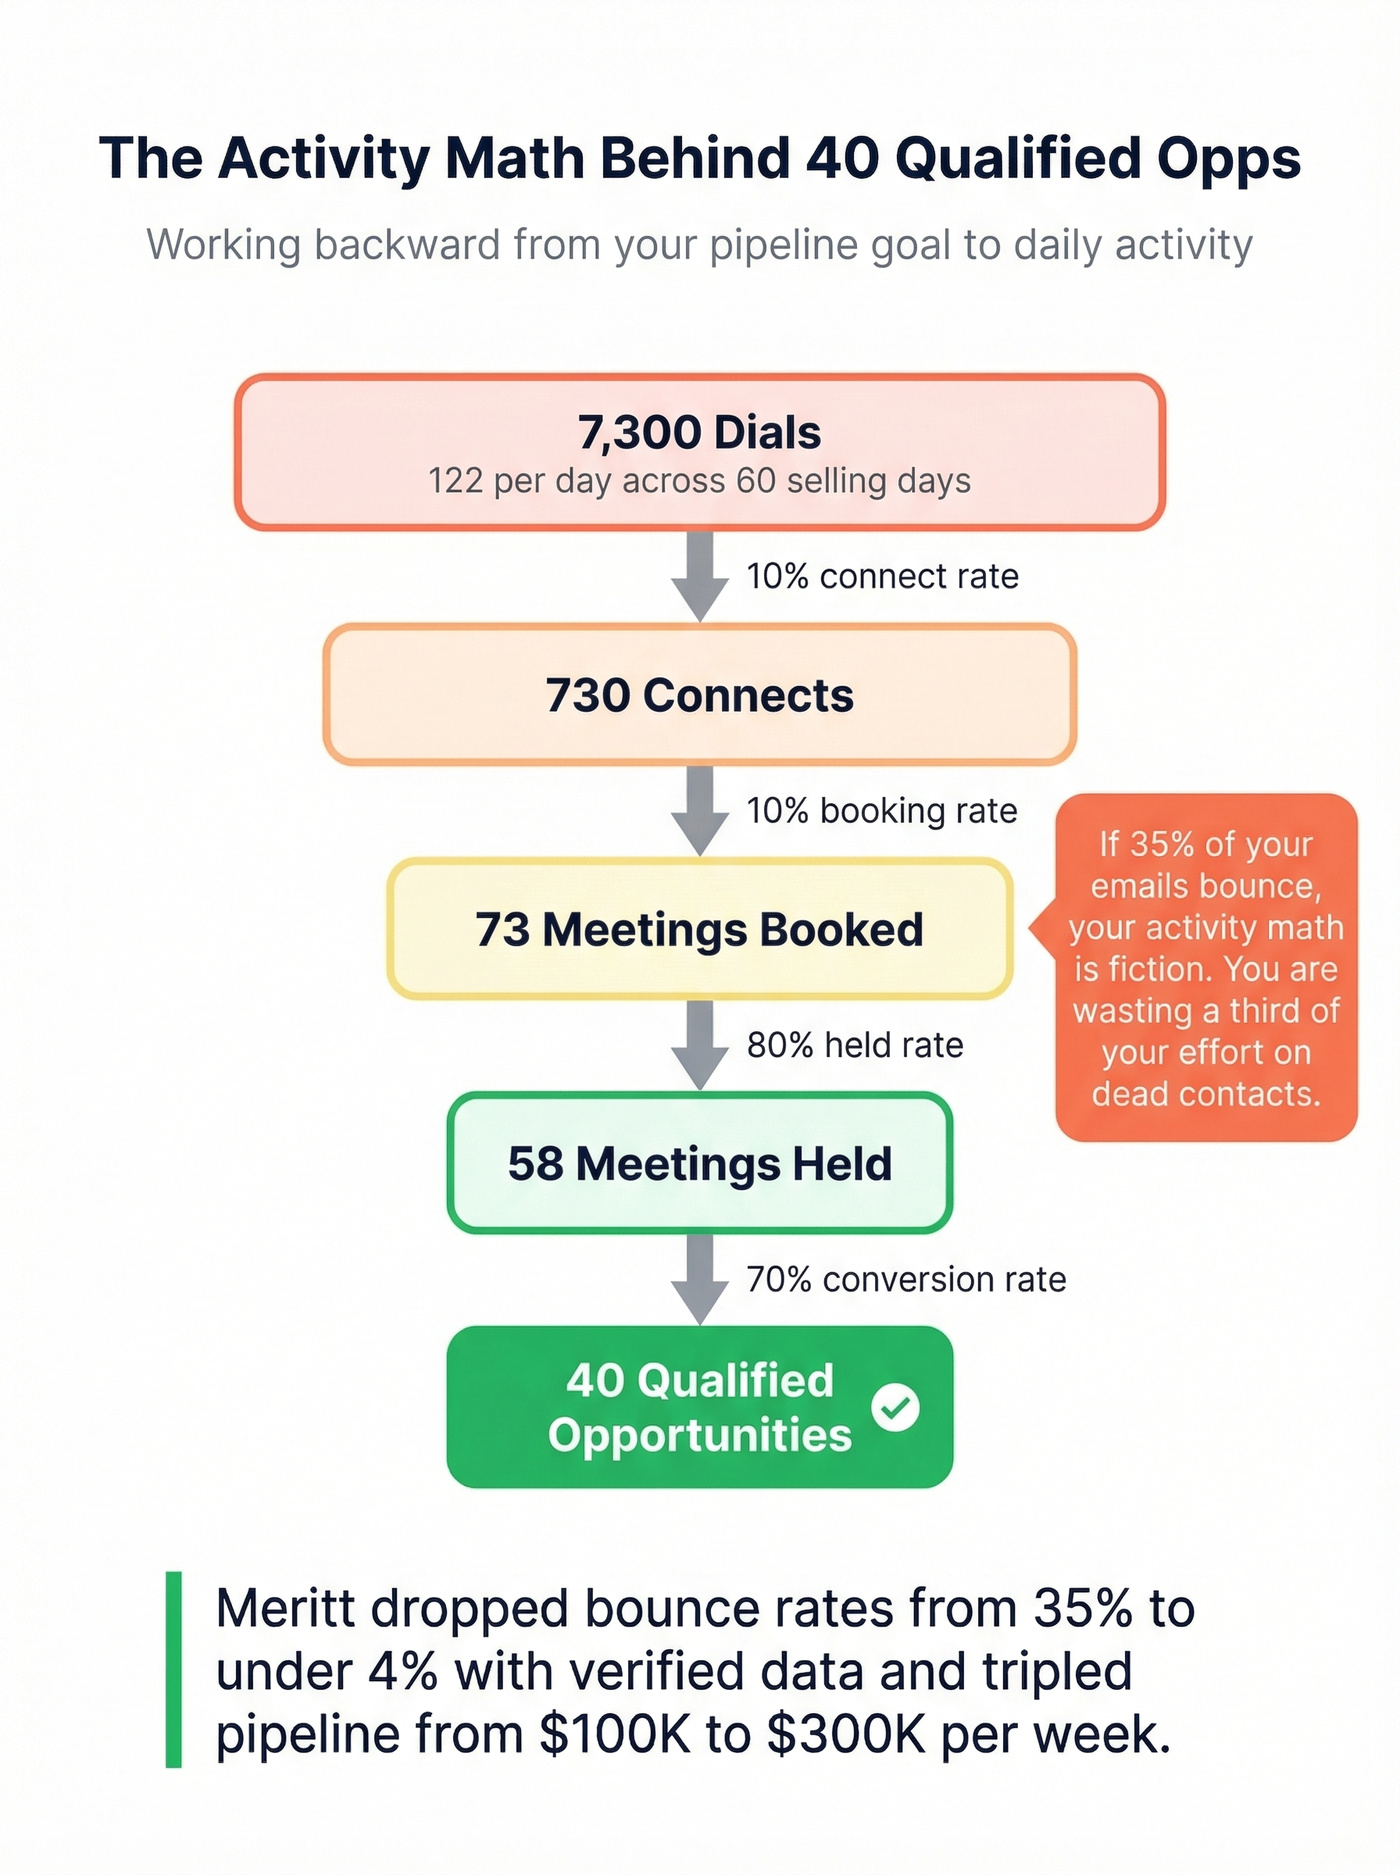
Using Outreach's benchmarks: 10% correct connect rate, 10% meeting booked rate, 80% meeting held rate, 70% of held meetings convert to qualified opportunities. With 60 selling days per quarter and roughly 7 call tasks per prospect, you can work backward from any pipeline goal.
Say you need 40 qualified opportunities this quarter. At a 70% meeting-to-opp conversion, you need 58 held meetings. At 80% held rate, that's 73 booked meetings. At 10% booking rate, that's 730 connects. At 10% connect rate, that's 7,300 dials - or about 122 dials per day across 60 selling days.
Those numbers assume every dial reaches a real person at a real company. They also assume your email sequences hit live inboxes. But if 35% of your emails bounce, your activity math is fiction. You're not making 122 meaningful dials a day - you're wasting a third of your effort on dead contacts. This is where data quality becomes a pipeline problem, not just a deliverability problem. Meritt saw this firsthand - after switching to Prospeo's verified contact data, their bounce rate dropped from 35% to under 4%, and pipeline tripled from $100K to $300K per week.

The macro trends make this worse. Sales cycles are 21% longer and win rates are 2% lower than in 2020. Every wasted touch on a bad email or disconnected number costs more than it did six years ago.
Your activity-to-pipeline math assumes every email lands. With 98% email accuracy and bounce rates under 4%, Prospeo turns your pipeline calculator from theory into revenue. Meritt tripled pipeline from $100K to $300K/week after switching.
Stop calculating pipeline on bad data. Start building it on verified contacts.
Tracking Pipeline Growth Rate
Pipeline growth rate measures whether your pipeline is expanding or contracting over time:
Pipeline Growth Rate = ((Current Pipeline - Previous Pipeline) / Previous Pipeline) x 100
If your pipeline was $2M last month and it's $2.3M this month, that's 15% growth. Healthy benchmarks: 10-20% monthly growth and 25-50% quarterly growth. Anything below 10% monthly for a growth-stage company means your top-of-funnel is stalling, and you'll feel it in revenue two quarters from now.
Track this monthly at minimum. A single bad month isn't a crisis, but two consecutive months of flat or negative growth is a leading indicator that your revenue target is in trouble.
Win Rate & Sales Cycle Benchmarks
Your win rate determines how much pipeline you need. A team closing at 40% needs half the pipeline of a team closing at 20%.
| Segment | Avg Win Rate | Top Performers |
|---|---|---|
| Enterprise (1000+) | 20-25% | 30%+ |
| Mid-market (100-999) | 25-35% | 40%+ |
| SMB (<100) | 30-40% | 45%+ |
Win rate formula: (Won Opportunities / Total Closed Opportunities) x 100. "Total closed" means won plus lost - open deals don't count.
| Segment | Typical Cycle |
|---|---|
| SaaS | 30-90 days |
| Enterprise | 90-180 days |
If your enterprise cycle is running 180 days and you're planning pipeline on a quarterly basis, you're already behind. Deals that enter the pipeline in January won't close until June or July. Plan accordingly.
Mistakes That Kill Your Forecast
Only 7% of organizations achieve 90%+ forecast accuracy, and fewer than 50% of sales leaders have high confidence in their own forecasts. We've watched teams miss by 30%+ because of these errors:
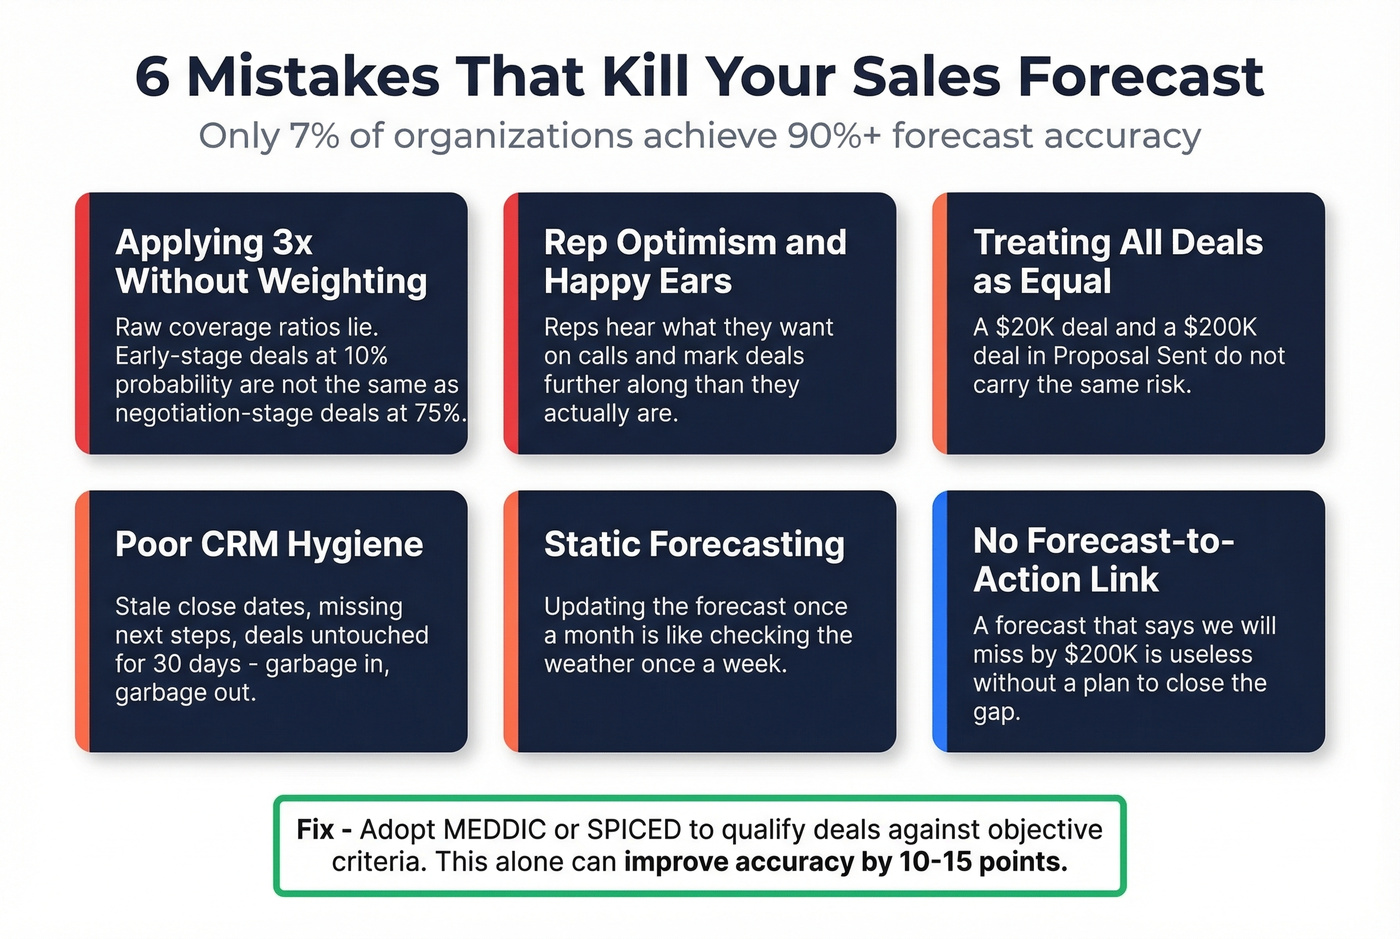
Applying the 3x rule without weighting. Raw coverage ratios lie. A pipeline full of early-stage deals at 10% probability isn't the same as one loaded with negotiation-stage deals at 75%.
Rep optimism. "Happy ears" is real. Reps hear what they want to hear on calls and mark deals as further along than they are. In our experience, the gap between rep-reported stage and actual buyer readiness is the single biggest source of forecast error.
Treating all deals in a stage as equal. A $20K deal and a $200K deal in "Proposal Sent" don't carry the same risk or probability.
Poor CRM hygiene. Stale close dates, missing next steps, deals untouched for 30 days - garbage in, garbage out. Skip the fancy sales forecasting tool if your CRM data is a mess. Fix the inputs first.
Static forecasting. Updating the forecast once a month is like checking the weather once a week. By the time you see the storm, it's already here.
Not connecting forecast to action. A forecast that says "we'll miss by $200K" is useless without a plan to close the gap.
Adopting a consistent methodology like MEDDIC or SPICED forces reps to qualify deals against objective criteria rather than gut feel. That alone can move forecast accuracy by 10-15 points.
Stage Probabilities & Templates
If you're building a pipeline calculator from scratch - even in a spreadsheet - start with these default stage probabilities:
| Stage | Probability |
|---|---|
| Prospecting | 10% |
| Qualified | 25% |
| Proposal Sent | 50% |
| Negotiation | 75% |
| Closed Won | 100% |
| Closed Lost | 0% |
Weighted value = deal value x probability. A $100K deal in the Qualified stage contributes $25K of weighted pipeline. This is the foundation of any honest forecast.
For your spreadsheet template, build four tabs: Dashboard, Deal Log, Monthly Summary, and Instructions. The Deal Log should capture stage, deal value, probability, weighted value, expected close date, days in stage, lead source, owner, and next action. The Dashboard auto-calculates total pipeline, weighted pipeline, revenue closed, active deal count, average deal size, and win rate.
Keep it to 6-8 stages maximum. More than that and reps stop updating because the distinctions feel arbitrary. Start with these defaults and adjust quarterly based on your actual conversion data.
Pipeline Review Cadence
Teams that track pipeline weekly achieve 87% forecast accuracy based on a First Page Sage study of 247 B2B organizations from January through April 2026. That's a massive gap over teams reviewing monthly or "when the VP asks."
The cadence that works: reps check their own pipeline daily, managers run pipeline reviews weekly, and executives review the forecast monthly. Keep pipeline reviews and forecast reviews separate - one is about deal health and progression, the other is about calling the number.
Real talk: most teams track too many pipeline metrics. Track three, not fifteen. Coverage ratio, velocity, and win rate tell you almost everything you need to know. If coverage is dropping, you have a top-of-funnel problem. If velocity is slowing, deals are stalling. If win rate is declining, you have a qualification or competitive problem. Everything else is noise until those three are healthy.
If you want a tighter operating system around those three, use a simple pipeline health scorecard and review it weekly.
Pipeline velocity depends on reaching real buyers fast. Prospeo's 300M+ profiles with 30+ filters - including buyer intent and job changes - let your reps hit 4+ qualified opps per week without wasting dials on dead numbers.
Every dial that connects is a velocity multiplier. Make every one count.
FAQ
What's a good pipeline coverage ratio?
SMB teams typically need 2-3x coverage, mid-market 2.5-4x, and enterprise 3-5x. The popular "3x rule" only works if your win rate is around 33%. If you close at 20%, you need 5x coverage to hit the same number.
How do you calculate pipeline velocity?
Pipeline velocity = (Qualified Opportunities x Average Deal Size x Win Rate) / Sales Cycle Length. The result is revenue generated per day - a team with 50 opps, $50K deals, 25% win rate, and a 90-day cycle generates about $6,944 daily.
How many deals should be in my pipeline?
Divide your revenue target by (average deal size x win rate). A $500K target at $50K average deal size and 25% win rate means you need 40 total deals to produce 10 wins. Use weekly pacing - roughly 4 new qualified opportunities per week - to keep that number steady.
What's the difference between a sales funnel and a sales pipeline?
A funnel measures conversion rates between stages - it's an analytical model showing where leads drop off. A pipeline tracks specific deals through stages for revenue forecasting. You need both: the funnel to diagnose leaks, the pipeline to call the number.
How do I improve pipeline accuracy with better data?
Use weighted pipeline instead of raw totals - multiply each deal's value by its stage probability. Verify contact data before outreach so activity metrics reflect reality rather than bounced emails and disconnected numbers. Teams like Snyk saw AE-sourced pipeline jump 180% after cleaning up their contact data, going from 35-40% bounce rates to under 5%.