QBR Reporting: KPIs, Templates, and the Automation Playbook
It's Sunday night. QBR week starts tomorrow. You've got a Salesforce export that's three tabs deep, a half-built deck from last quarter you swore you'd templatize, and a Slack message from your VP asking for "the latest numbers." So you do what everyone does: screenshot a dashboard, paste it into Excel, rebuild the chart so it doesn't look like garbage, then paste that into PowerPoint. Repeat fourteen times. The manual QBR prep workflow is the biggest time suck in customer success and RevOps - and it's 2026. There's a better way to handle QBR reporting.
Most guides stay conceptual. They'll tell you a QBR is "a strategic meeting held quarterly." Thanks. This one gives you the actual KPIs by department, a slide-by-slide template adapted by company stage, minute-by-minute agenda timings, and the automation stack to stop rebuilding decks from scratch every 90 days.
What You Need (Quick Version)
If QBR week is already breathing down your neck, here's the shortcut. Jump to the KPI tables in Section 4 and pick 3-5 metrics that match your department. Grab the template outline in Section 5 for your report structure. Then check the tools in Section 7 to automate the screenshot-to-slides workflow. One more thing: if your CRM data is stale - wrong emails, outdated titles, phantom contacts - clean it first so the numbers in your quarterly review actually hold up. Garbage in, garbage QBR.
What Is QBR Reporting?
A quarterly business review is a structured meeting where a team evaluates the last 90 days of performance and commits to priorities for the next 90. The report is the artifact - the deck, the dashboard, the PDF - that anchors that conversation. Simple enough in theory. Execution is where things fall apart.
Not every business needs QBRs. B2C companies rarely run customer-facing reviews per account - the math doesn't work when you have thousands of customers. B2B companies with fewer, higher-value accounts are where QBRs earn their keep. If your average deal size justifies 30-60 minutes of dedicated review time per account per quarter, structured quarterly reviews make sense. Below that threshold, you're better off with a self-serve dashboard or a quarterly email digest.
QBR reports serve three distinct audiences, and mixing them up is a common mistake. Internal QBRs are for your own team - sales, CS, marketing, finance reviewing performance together. Customer-facing QBRs are for your clients - showing value delivered and aligning on what's next. Board-level QBRs are for investors and executives - high-altitude metrics with strategic narrative. The KPIs, the format, and the level of detail change dramatically depending on which audience you're building for.
Internal vs. Customer-Facing QBRs
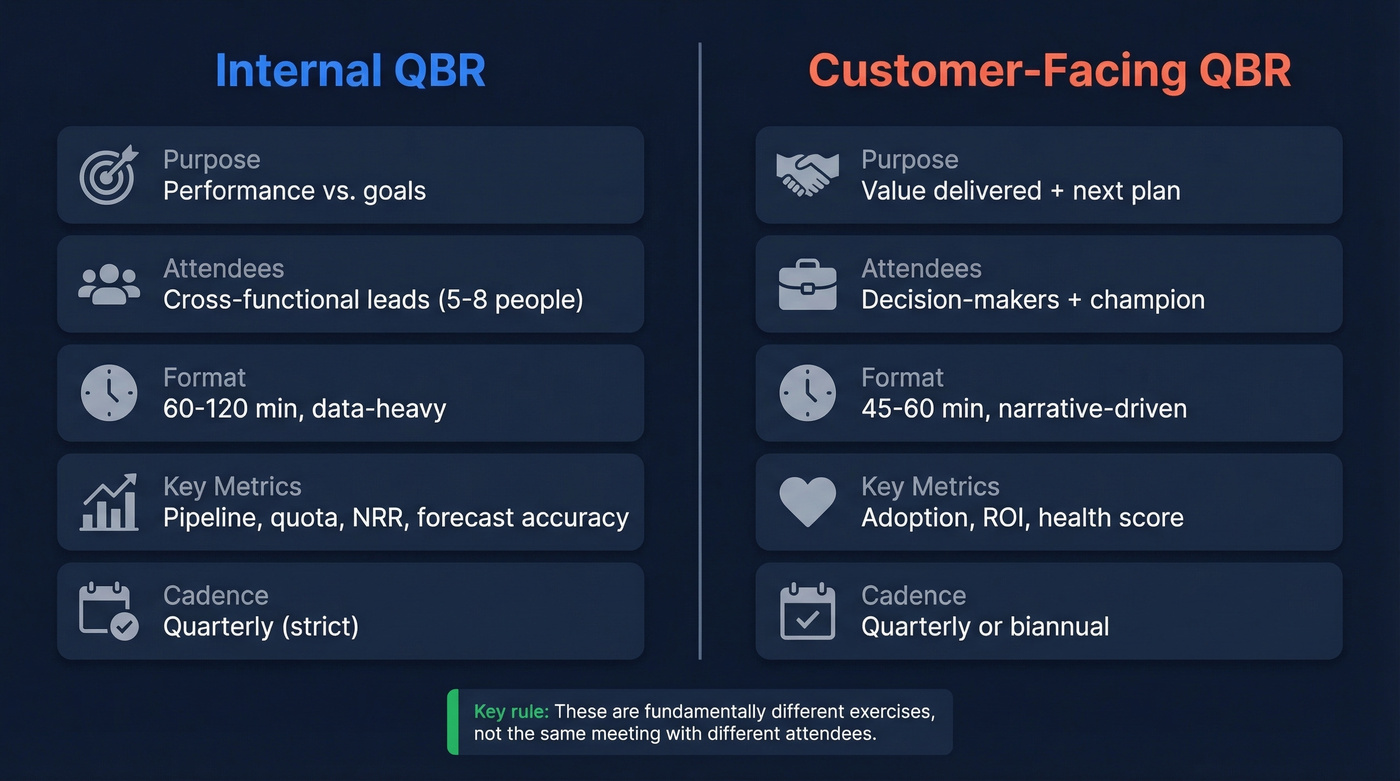
The biggest structural mistake teams make is treating internal and customer-facing QBRs as the same meeting with different attendees. They're fundamentally different exercises.
| Dimension | Internal QBR | Customer-Facing QBR |
|---|---|---|
| Purpose | Performance vs. goals | Value delivered + next plan |
| Attendees | Cross-functional leads | Decision-makers + champion |
| Format | 60-120 min, data-heavy | 45-60 min, narrative-driven |
| Key metrics | Pipeline, quota, NRR | Adoption, ROI, health score |
| Cadence | Quarterly (strict) | Quarterly or biannual |
Internal QBRs become less useful as they get larger. Teams on r/sales describe all-day marathons - 12 presentations, 9 AM to 6 PM, minimal breaks. That's not a business review; it's an endurance test. Keep the core group small enough for honest discussion. Five to eight people is a common sweet spot.
For customer-facing QBRs, the attendee list matters more than the slide count. If only your champion shows up, the meeting stays tactical. You need the economic buyer or a decision-maker in the room for the review to drive real outcomes. A customer QBR isn't a renewal pitch. It's a value review. The moment it feels like a sales call, you've lost the room.
One structural problem worth calling out: when CS reports into Sales leadership, QBRs almost inevitably drift toward quota-driven upsell conversations. The reporting line creates a perverse incentive - the person running the review is measured on expansion revenue, not customer outcomes. If your QBRs keep turning into sales pitches, look at the org chart before you blame the deck.
Delivery format matters too. In-person QBRs are typically reserved for strategic enterprise accounts and can run 2-4 hours. Virtual sessions are the default for mid-market and often run closer to an hour. For lower-ACV accounts, fully digital self-serve portals - where the customer can pull their own dashboard on demand - replace the live meeting entirely.
QBR KPIs by Department
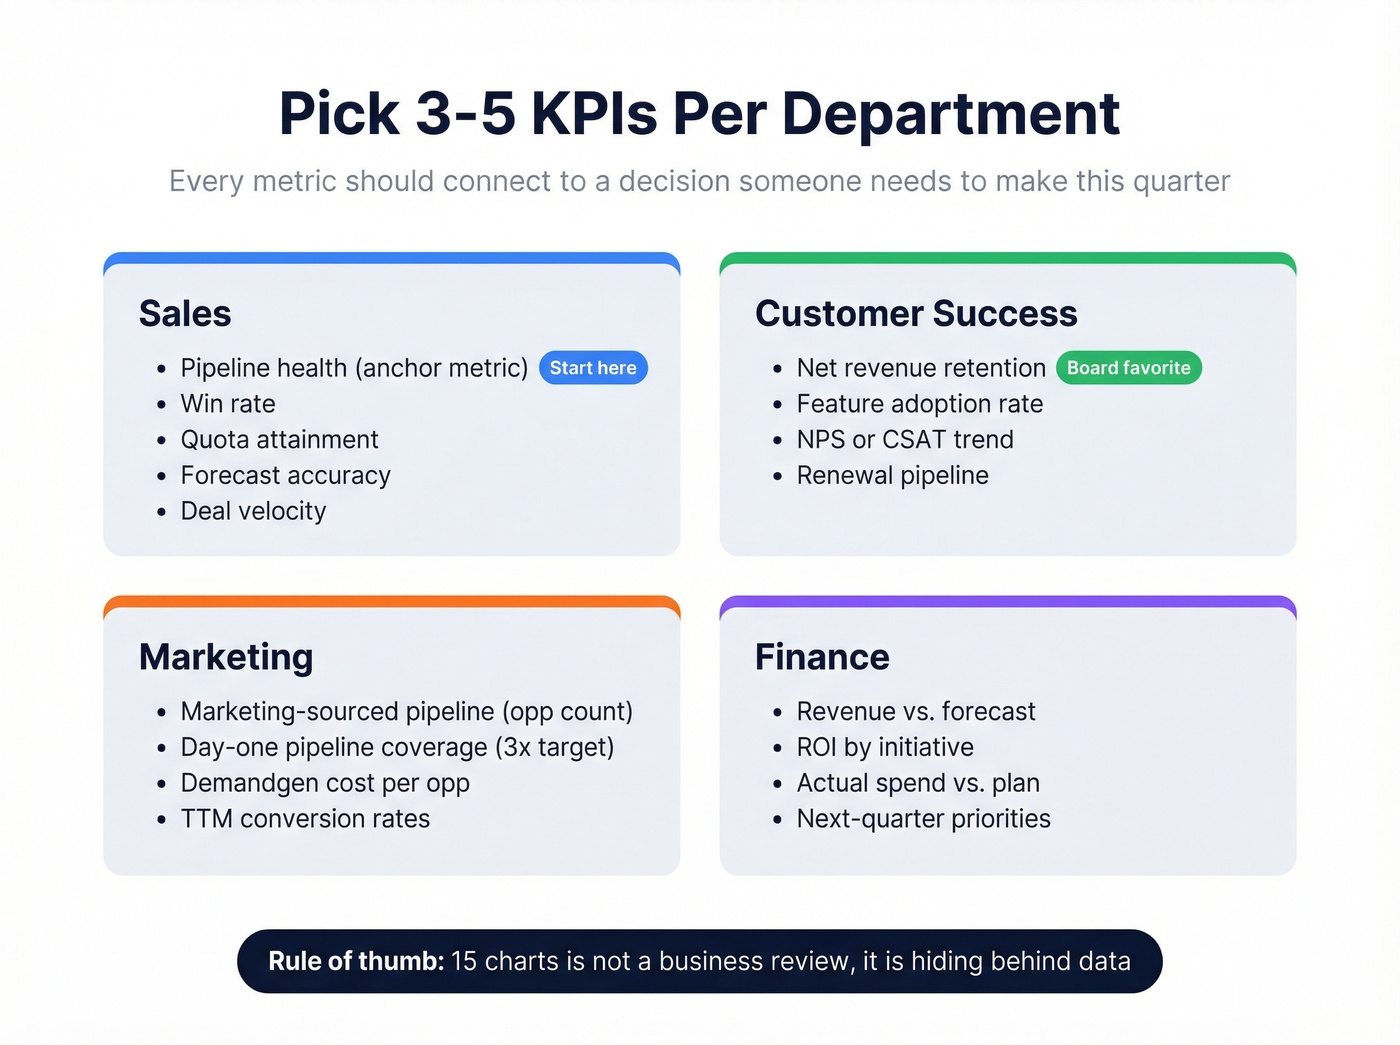
Here's the single most useful rule of thumb: pick 3-5 key metrics. That's it. Fifteen charts isn't a business review - it's hiding behind data. Every metric in your deck should connect to a decision someone needs to make this quarter.
Sales Metrics
| Metric | What It Tells You |
|---|---|
| Pipeline health | Volume + stage distribution |
| Win rate | Conversion efficiency |
| Quota attainment | Rep + team performance |
| Forecast accuracy | Planning reliability |
| Deal velocity | Days from opp to close |
Pipeline health is the anchor metric. Without it, everything else is a lagging indicator. Pair it with forecast accuracy to show whether the team is getting better at predicting outcomes - not just closing deals.
Customer Success Metrics
| Metric | What It Tells You |
|---|---|
| Net revenue retention | Expansion vs. churn balance |
| Feature adoption rate | Product stickiness |
| NPS / CSAT trend | Sentiment trajectory |
| Support ticket volume | Friction signals |
| Renewal pipeline | Revenue at risk |
| Upsell opportunities | Growth potential |
Net revenue retention is the metric your board cares about most. Some teams build a Customer Health Index - a weighted composite score on a 1-100 scale - to give executives a single number that summarizes account health. Worth the effort if you manage more than 50 accounts.
Marketing Metrics
| Metric | What It Tells You |
|---|---|
| Marketing-sourced pipeline | Opp count, not dollars |
| Day-one pipeline coverage | Target: 3.0x at quarter start |
| Demandgen cost per opp | Variable costs only |
| TTM conversion rates | Smooths campaign-to-close lag |
The most practical marketing QBR framework we've found focuses on opportunity count rather than dollar amounts for pipeline - dollar values fluctuate too wildly by deal size. Use trailing twelve-month conversion rates to smooth out the lag between campaign spend and closed revenue. Kellblog's breakdown is still the best reference for this approach.
Finance Metrics
| Metric | What It Tells You |
|---|---|
| Revenue vs. forecast | Execution accuracy |
| ROI by initiative | Investment efficiency |
| Actual spend vs. plan | Budget discipline |
| Next-quarter priorities | Capital allocation |
The key with finance QBRs is connecting financial outcomes to the operational metrics other departments are reporting. If sales says pipeline is healthy but finance shows revenue trailing forecast, someone's numbers are wrong. That disconnect should be the first slide, not a footnote.
Building Your QBR Report: Templates
Slide-Based Template (10-15 Slides)
A typical QBR presentation runs 10-30 slides. Written reports with appendices can reach 15-50+ pages. For most customer-facing meetings, aim for the lean end: 10-15 slides presented in 30-45 minutes.
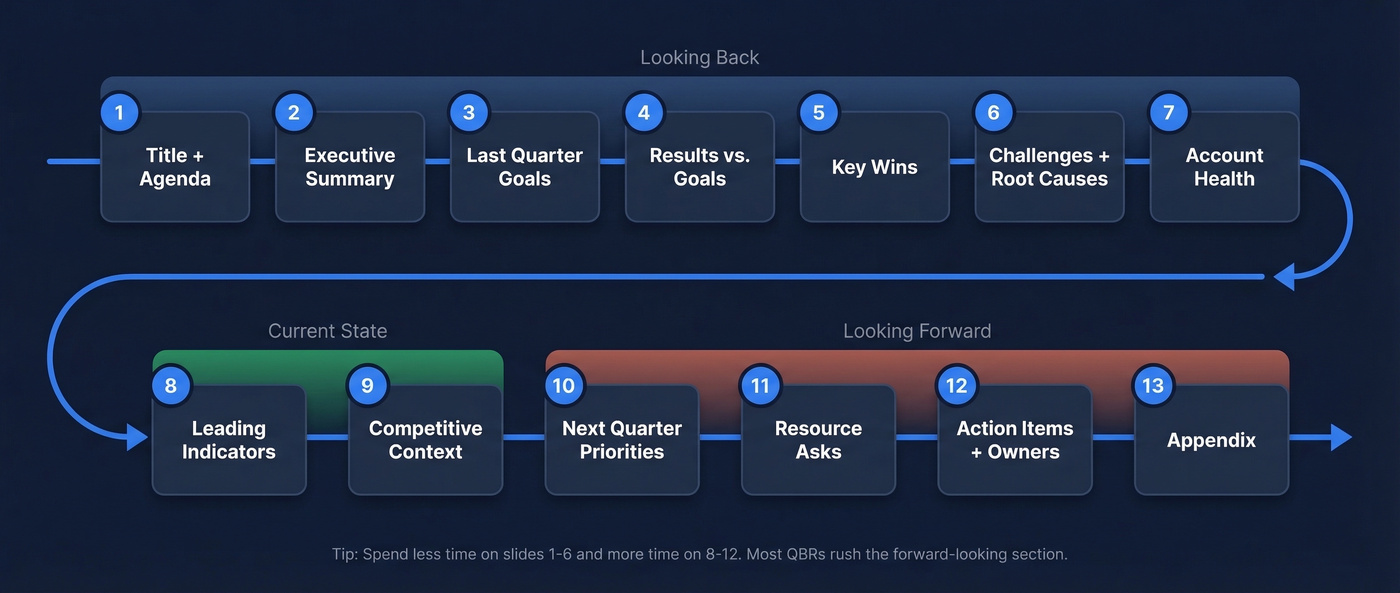
This slide-by-slide structure works across company stages, with adjustments noted below:
- Title + agenda - one slide, 30 seconds
- Executive summary - 3 key takeaways, no more
- Last quarter's goals - what you committed to
- Results vs. goals - the scoreboard
- Key wins - 2-3 specific outcomes with numbers
- Challenges + root causes - don't hide the misses
- Customer/account health - health score, adoption, NPS
- Leading indicators - signals for next quarter
- Competitive/market context - if relevant
- Next quarter priorities - 3-5 commitments
- Resource/budget asks - what you need
- Action items + owners - who does what by when
- Appendix - detailed data for the curious
Adapting by Company Stage
Post-Series B startups should weight slides 8-10 heavily. Investors and leadership care about trajectory, not history. Lead with leading indicators, burn rate context, and the path to the next milestone. Cut the appendix - nobody's reading it at this stage.
Mid-market and growth-stage companies follow the standard template closely. This is where the full 13-slide structure earns its keep. Add a competitive context slide if you're in a crowded market.
Public companies and enterprise orgs need slides 4 and 6 to be airtight. Auditable numbers, clear variance explanations, and regulatory context where relevant. The executive summary slide carries more weight here - assume half the room only reads that one.
60-Minute Agenda Breakdown
Customer-facing reviews should usually cap around an hour, though lean teams can do 30-45 minutes. Internal reviews can stretch to 90-120 minutes per team, but that's the ceiling.
| Block | Time | Content |
|---|---|---|
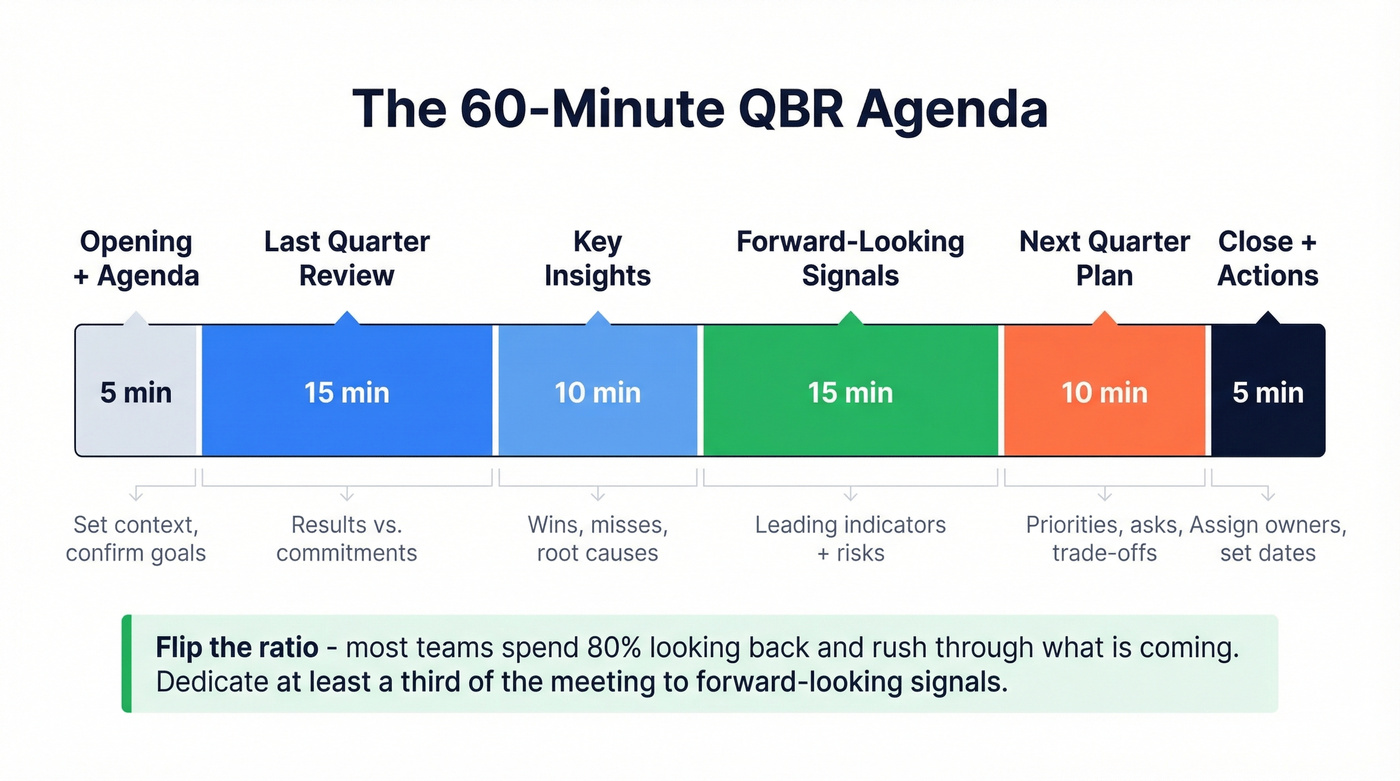
| Opening + agenda | 0-5 min | Set context, confirm goals |
| Last quarter review | 5-20 min | Results vs. commitments |
| Key insights | 20-30 min | Wins, misses, root causes |
| Forward-looking signals | 30-45 min | Leading indicators + risks |
| Next quarter plan | 45-55 min | Priorities, asks, trade-offs |
| Action items + close | 55-60 min | Assign owners, set dates |
The forward-looking block is where most QBRs fall short. Teams spend 80% of the time on what already happened and rush through what's coming. Flip that ratio.
You said it yourself: garbage in, garbage QBR. If your pipeline metrics are built on stale contacts and bounced emails, your quarterly review is a fiction. Prospeo enriches your CRM with 50+ data points per contact at a 92% match rate - so the numbers in your next QBR actually reflect reality.
Fix your CRM data before you build another deck.
Signal-Driven Quarterly Reviews
Here's the opinion that'll get pushback: QBRs that only look backward are obituaries. They tell you what died and when. They don't prevent the next death.
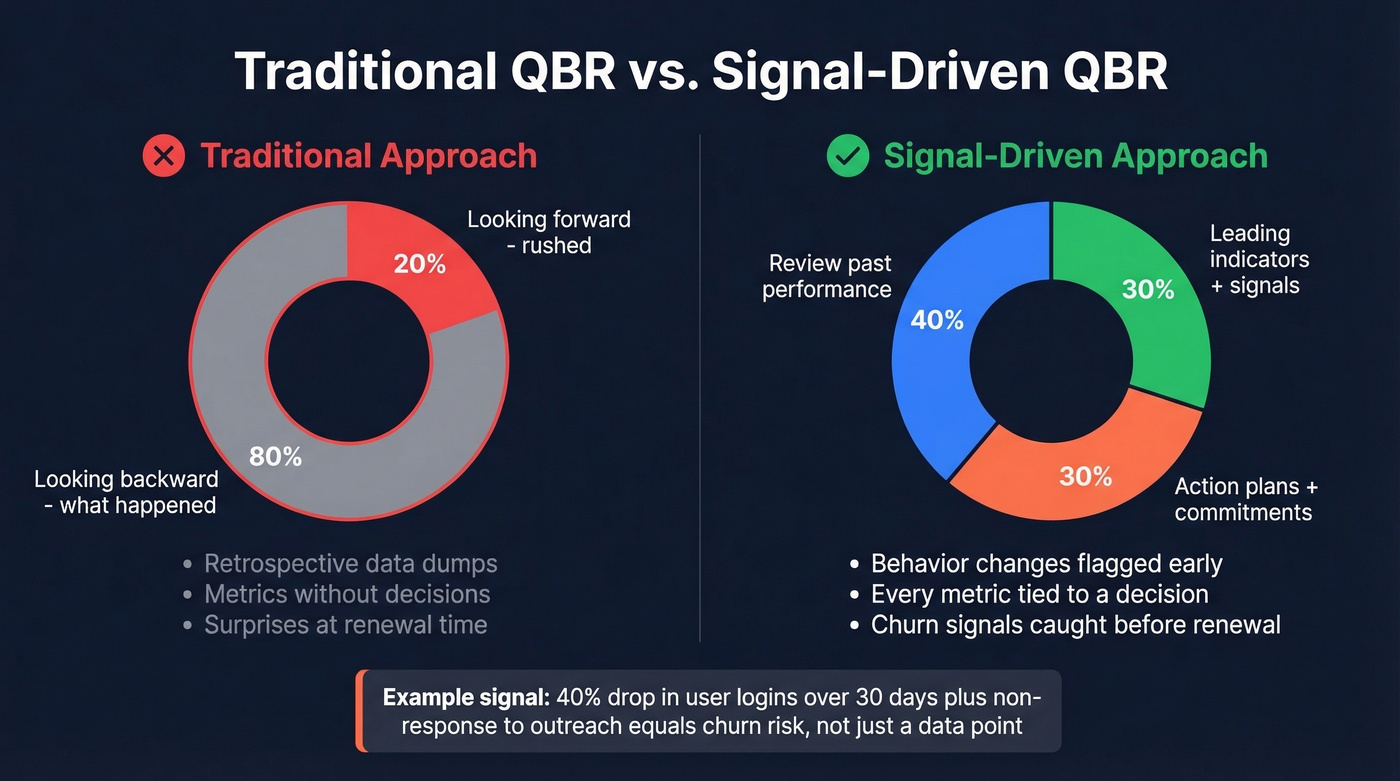
A signal-driven approach dedicates at least a third of the meeting to leading indicators - changes in customer behavior, engagement patterns, and usage trends that predict what's coming. A 40% drop in user logins over 30 days combined with non-response to outreach attempts isn't a data point. It's a churn signal that needs to be in your review with a mitigation plan attached.
The shift is from "here's what happened" to "here's what's happening right now and what we're doing about it." Product usage declining? That's a slide. Champion changed jobs? That's a slide. Competitor showed up in the account's tech stack? That's a slide. These signals turn a quarterly review from a reporting exercise into a decision-making session.
Most CS teams don't have the tooling to surface these signals automatically yet. But even a manual check of login trends, support ticket spikes, and stakeholder changes before each QBR beats showing up with nothing but last quarter's revenue chart.
How to Automate QBR Reports
The Manual Workflow (And Why It Breaks)
The workflow that r/CustomerSuccess loves to hate: export data from Salesforce, take screenshots of dashboards, open Excel, rebuild charts so they're presentation-ready, copy-paste into PowerPoint, realize the formatting broke, fix it, repeat for the next account. That's typically 4-8 hours per account per quarter based on practitioner reports. For a CSM managing 30 accounts, that's a full week of deck-building every quarter - time that should go toward actually preparing for the conversation.
The Salesforce export workflow is especially painful because Salesforce reports rarely export cleanly into presentation formats. You end up rebuilding everything from scratch, which introduces errors and eats hours.
Automation Approaches
There are a few distinct approaches to automating QBR prep:
BI-to-deck tools like Rollstack connect your dashboards (Looker, Tableau, Power BI) directly to slide templates and auto-update them on a schedule. This is the highest-leverage automation if your data already lives in a BI tool.
Dashboard-first platforms like Databox let you build QBR-ready dashboards that can be shared directly - skipping the deck entirely for internal reviews.
OKR-driven tools like Mooncamp tie quarterly review reporting to objectives and key results, which works well for teams already running on an OKR framework.
For Salesforce-heavy orgs, CRM-native apps like ClosePlan handle account planning and QBR prep without leaving the platform. One tool to approach with caution: CloudRadial. MSP practitioners on Reddit describe its planner function as "clunky and not super easy to use or navigate." It works, but expect a learning curve.
Tools and Pricing
| Tool | Use Case | Pricing |
|---|---|---|
| Prospeo | CRM data enrichment | Free tier; ~$0.01/email |
| Rollstack | BI-to-deck automation | Free account; team plans are custom |
| Databox | Dashboard-first QBRs | Free; paid from ~$50/mo |
| Mooncamp | OKR-driven QBR planning | ~$6-9/user/mo |
| ScalePad | MSP quarterly reviews | $149/mo |
| People.ai | Revenue intelligence | ~$50/user/mo |
| ClosePlan | Salesforce account planning | ~$10/user/mo |
| Gainsight | Enterprise CS platform | ~$30K-100K+/yr |
Let's be honest: most teams overspend on QBR tooling and underspend on data quality. A $100K Gainsight deployment still produces misleading reports if the underlying CRM records have stale emails, outdated titles, and phantom contacts. Fix the foundation first.
When designing QBR dashboards, a few principles from Bold BI's framework hold up well. Show quarterly comparisons with Q1 through Q4 on the same view. Include benchmarks and targets alongside actuals. Use color coding to flag off-track metrics. And tailor the dashboard view to the audience - your VP of Sales doesn't need the same dashboard as your CS team.
The Data Quality Problem Most Guides Skip
Here's a scenario that plays out constantly. The QBR deck shows 95% email deliverability. Sales says half their outbound is bouncing. The VP asks which number is real. Nobody knows, because the CRM data hasn't been cleaned in months.
Every metric in your quarterly report is downstream of your CRM data. Pipeline numbers are wrong if contacts are duplicated. Win rates are skewed if closed-lost deals have outdated stakeholder info. Customer health scores are meaningless if the usage data is tied to contacts who left the company two quarters ago.
We've seen teams waste entire QBR meetings arguing about whose numbers are right - and the root cause is almost always dirty CRM records. Prospeo handles this at the source, enriching and verifying CRM records on a 7-day refresh cycle compared to the 6-week industry average. That means the contact data feeding your QBR dashboards stays current without manual cleanup: 98% email accuracy, 92% API match rate, and 50+ data points per enrichment across Salesforce and HubSpot integrations. Before you build the deck, clean the data. It takes minutes, and it's the difference between a review that drives decisions and one that drives arguments.
If you're evaluating vendors, start with a shortlist of data enrichment services and compare match rates and refresh cycles.
Pipeline health is your anchor QBR metric, but it's meaningless when 35% of your contacts bounce. Prospeo's 7-day data refresh and 98% email accuracy keep your pipeline clean quarter over quarter - no more Sunday-night scrambles to explain why the numbers don't add up.
Start every QBR with pipeline data you can actually trust.
Common Mistakes to Avoid
No Standardized Template
Every QBR built from scratch is a QBR that takes three times longer than it should. Not using templates is one of the most common mistakes practitioners call out. Pick a structure, templatize it, and iterate quarterly - don't reinvent the wheel every 90 days.
Death by PowerPoint
Most QBRs are way too long. If you're past slide 20 and the room is checking phones, you've lost. Cut ruthlessly. Every slide should earn its spot by connecting to a decision or action item. Skip this section if your decks are already under 15 slides - you're ahead of most teams.
No Goals Tied to Metrics
Showing numbers without context is a data dump, not a review. Every metric needs a target, a benchmark, or a commitment it's measured against. "Win rate was 22%" means nothing. "Win rate was 22% against a 28% target - here's why and here's the fix" means everything.
Treating the QBR as a Sales Pitch
Customer-facing QBRs that feel like renewal conversations destroy trust. The meeting is about value delivered and alignment on what's next. Save the upsell conversation for a separate call.
No Follow-Up
A QBR without assigned action items and deadlines is just a presentation. End every review with a clear list: who's doing what, by when, and how you'll track it. In our experience, the teams that send a written summary within 24 hours of the meeting see dramatically better follow-through than those who let action items live only in the slide deck.
QBR Reporting FAQ
How long should a QBR report be?
Aim for 10-15 slides covering a 30-45 minute customer meeting. Written reports with appendices can reach 50+ pages, but those are reference documents - not what you present live. Shorter decks force sharper thinking.
How often should you run QBRs?
Enterprise accounts above $50K ACV warrant full quarterly reviews. Mid-market accounts benefit from biannual reviews, and SMB accounts are better served by self-serve dashboards. Applying the same cadence across 200 accounts equals burnout with no strategic payoff.
What's the difference between a QBR and an EBR?
A QBR happens every quarter and covers operational metrics and tactical adjustments. An EBR (Executive Business Review) is less frequent, more strategic, and targets C-level stakeholders with ROI narratives and long-term roadmaps. Most mid-market accounts need QBRs; enterprise accounts need both.
How do you keep QBR data accurate?
Enrich and verify CRM records the week before pulling reports. Run deduplication, flag stale contacts, and use a tool with a fast refresh cycle. A 7-day refresh and 98% email accuracy prevent the "whose numbers are right" debate that derails too many quarterly reviews.