Revenue Forecasting: What Actually Works (And What Doesn't)
IREN reported $184.7M in Q2 FY2025 revenue against a $229.65M forecast - a 19.57% miss that sent the stock down 11.45% after hours. One quarter. One bad number. The market repriced the entire business overnight. If your revenue forecasting process still feels like educated guessing, the stakes are higher than most teams want to admit.
What Is a Revenue Forecast?
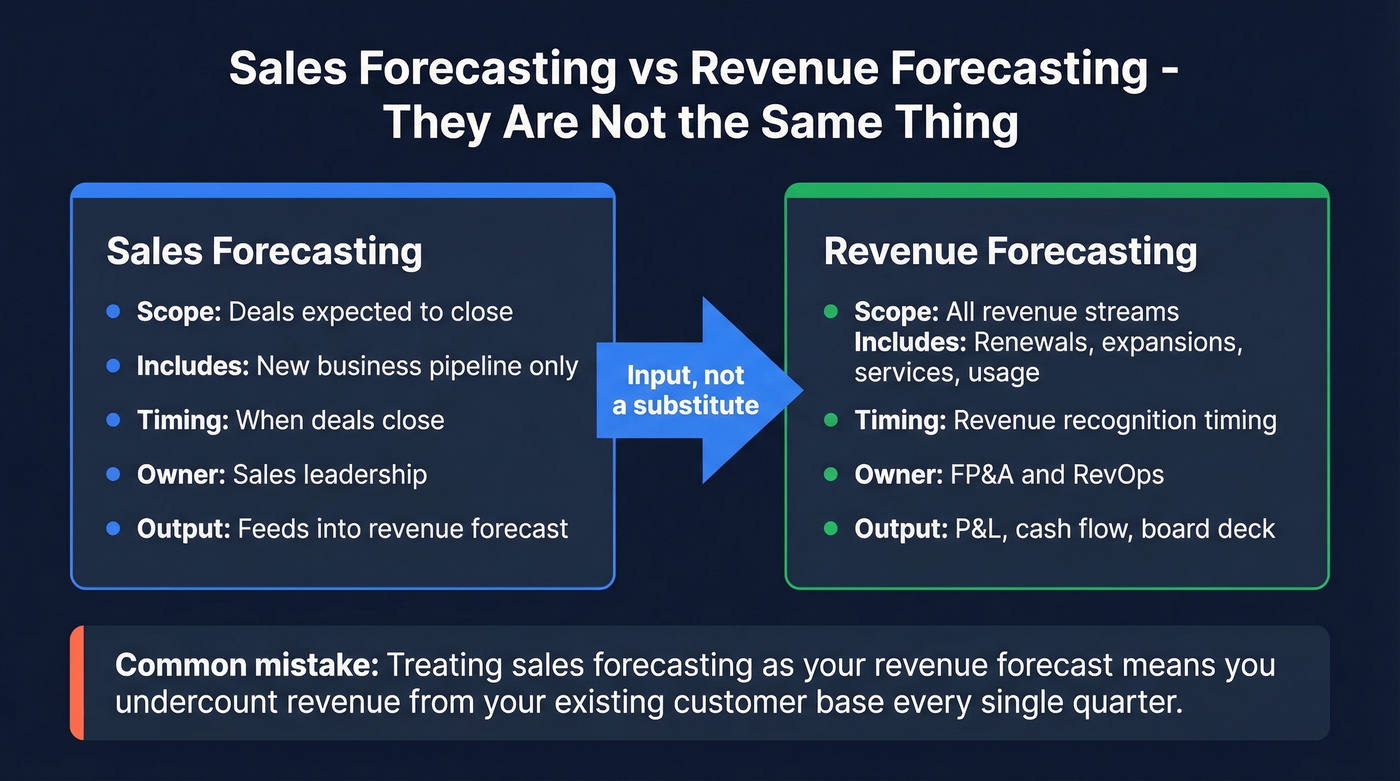
A revenue forecast projects future income across all streams - new business, renewals, expansions, services, and usage - over a defined time horizon. It's the financial backbone that drives budgeting, headcount planning, and board reporting. People confuse it with sales forecasting constantly, but they aren't the same thing.
| Sales Forecasting | Revenue Forecasting | |
|---|---|---|
| Scope | Deals expected to close | All revenue streams |
| Includes | New business pipeline | Renewals, expansions, services |
| Timing | When deals close | Revenue recognition timing |
| Owner | Sales leadership | FP&A / RevOps |
| Feeds into | Revenue forecast | P&L, cash flow, board deck |
A sales revenue forecast is an input to your broader projection, not a substitute for it. Miss that distinction and you'll undercount revenue from your existing customer base every single quarter.
Quick reference: Pick a method that matches your revenue model - recurring revenue uses MRR buildup, transactional businesses need moving averages or regression, and enterprise sales teams should use pipeline-weighted forecasting. Target ≤5% MAPE quarterly; if you're above 15%, fix your data before upgrading your model. Excel handles most teams under $50M. Enterprise tools often start around $25K-$50K/year.
Why Accurate Forecasts Matter
Revenue forecasting isn't a finance exercise - it's an operating system for the business. Here's what breaks when it's wrong:
- Budgeting and resource allocation. Every department's headcount plan depends on accurate revenue projections. Miss by 15% and you're either overstaffed or scrambling to hire.
- Cash flow management. Especially for businesses without backlog, cash flow timing is everything. A forecast miss means a liquidity surprise.
- Investor and board reporting. Public companies that miss forecasts often see 5-15%+ stock drops depending on the magnitude and guidance - IREN's 11.45% plunge is a concrete example. Private companies lose board trust, which is harder to rebuild.
- Headcount planning. Hire ahead of revenue that doesn't materialize and you're doing layoffs in six months.
- Pricing strategy simulation. You can't model the impact of a price change without a baseline forecast to compare against.
Here's one angle most articles skip: a forecast is meaningless if it exceeds what your team can actually close. If your model says $5M next quarter but your reps can only produce $3.5M at current productivity, you don't have a forecast. You have a wish. Always reconcile against capacity.
How to Forecast Revenue: Methods That Work
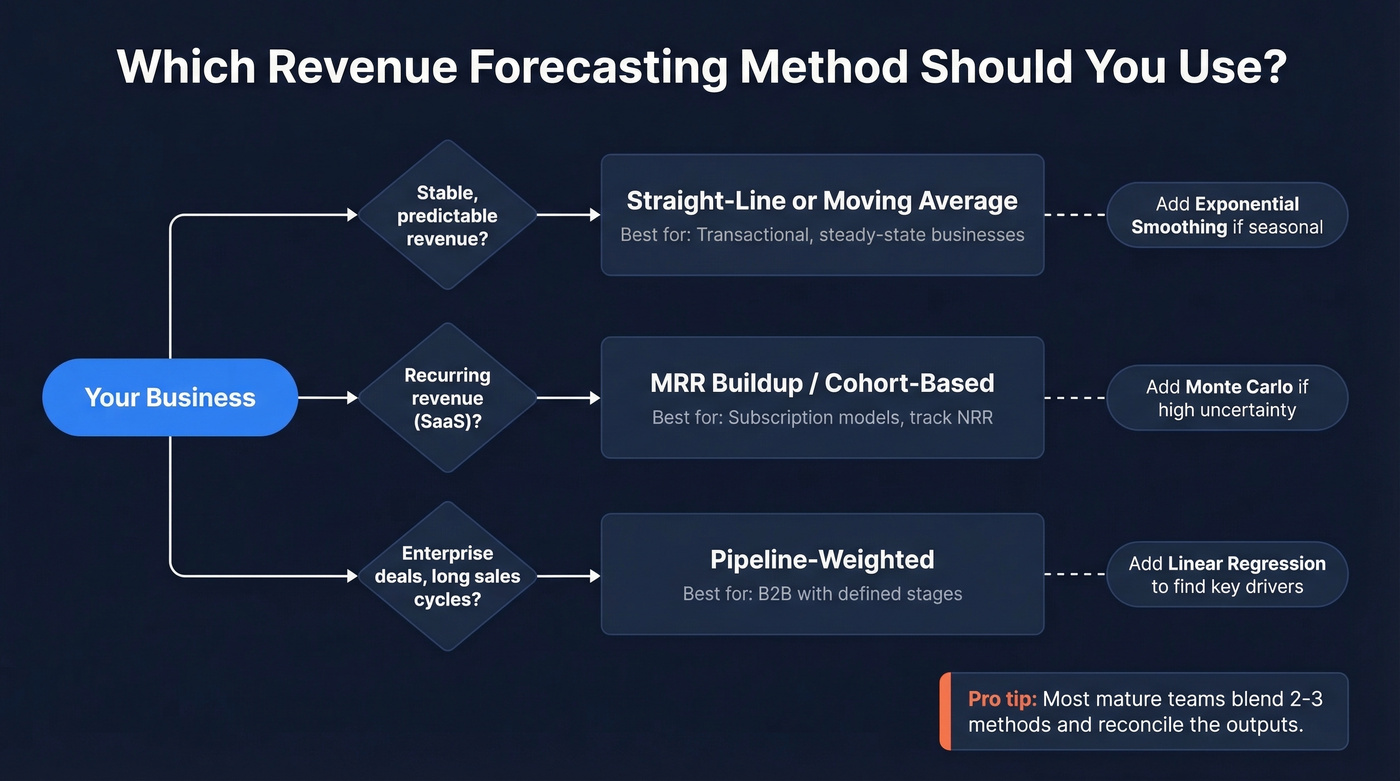
No single "best" method exists. The right one depends on your revenue model, data maturity, and forecast horizon. Most mature teams blend two or three approaches and reconcile the outputs.
Straight-Line
The simplest method: take last period's revenue, assume the same growth rate continues. Works for stable, predictable businesses with minimal seasonality. Use it as a sanity check, not a primary model - it's blind to market shifts and competitive dynamics.
Moving Average
Smooth out short-term noise by averaging the last N periods. In Excel, a 3-month moving average is just =AVERAGE(G2:I2). Best for transactional businesses with steady trends, but it lags behind real changes and misses seasonality entirely.
Exponential Smoothing
Excel's FORECAST.ETS function handles this natively, weighting recent data more heavily and detecting seasonality automatically. If your business doesn't have clear seasonal patterns, a moving average often gives you most of the value with less complexity. Retail, e-commerce, and usage-based SaaS - that's where ETS earns its keep.
Linear Regression
Let's be honest: this is the most underused method in mid-market companies. Model revenue as a function of identifiable drivers like headcount, ad spend, or leads generated. The output tells you which drivers actually correlate with revenue - and which ones you've been tracking for no reason. It can break down during market disruptions or when the relationship between drivers and revenue shifts, so don't treat the coefficients as permanent truth.
Bottom-Up vs. Top-Down
Run both and reconcile. Bottom-up sums individual deals, reps, or product lines. Top-down starts with market size and works down to your expected share. If bottom-up says $4M and top-down says $6M, you've got a gap worth investigating - either your reps are sandbagging or your market assumptions are wrong.
Pipeline-Weighted
Assign a probability to every deal based on its stage, then sum the weighted values. This is the default for B2B companies with defined sales cycles. One FP&A practitioner on Reddit called the process "absolutely exhausting" - reps resist assigning probabilities and prefer gut feel. Force the discipline anyway. It's the only approach that somewhat works in fast-moving pipelines.
Cohort-Based / MRR Buildup
The SaaS standard: New MRR - Churned MRR + Expansion MRR - Contraction MRR = Net New MRR. If your net revenue retention is above 100%, your existing customers are growing your revenue even without new logos.
Monte Carlo Simulation
Skip this unless you're in a high-uncertainty environment with variable deal sizes and limited historical data. Run thousands of scenarios with randomized variable ranges to produce a probability distribution. If a moving average works, don't reach for this - you'll spend more time explaining the model than using it.
SaaS Revenue Forecasting
SaaS forecasting deserves its own section because the mechanics are fundamentally different. Your revenue is a function of cohort behavior, not individual transactions.
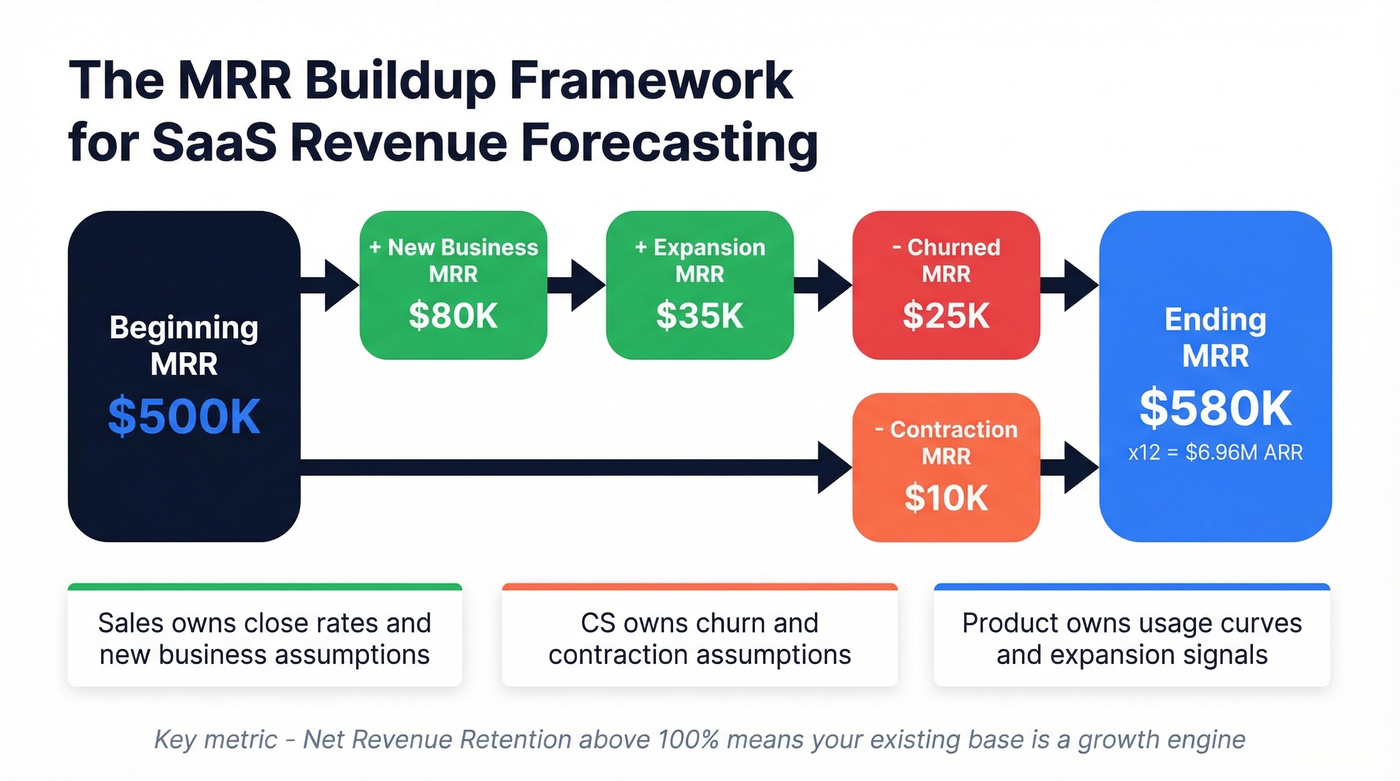
The MRR buildup framework is the foundation: start with beginning MRR, add new business, subtract churn, add expansion, subtract contraction. That gives you ending MRR, which you annualize for ARR. The critical metric is NRR - above 100% means your existing base is a growth engine; below 100% means you're on a treadmill.
We've seen SaaS companies mix renewals, expansions, and new business into a single pipeline over and over again, and it kills forecast accuracy every time. Each stream has completely different dynamics. Renewals are high-probability, low-variance. New business is low-probability, high-variance. Build at least three separate pipelines and forecast each independently.
For usage-based models, the approach shifts to driver-based forecasting at the client level. A practitioner on r/FPandA described this well: forecast each client's GMV, apply the take rate, and let ML learn patterns from similar clients. Tools like Pigment, Adaptive, Mosaic, and Causal are commonly used for this kind of granular modeling.
Ownership matters too. Sales owns close rates. CS owns churn assumptions. Product owns usage curves. When nobody owns the assumptions, nobody's accountable when they're wrong.
Your pipeline-weighted forecast is only accurate if the contacts behind those deals are real. Prospeo delivers 98% verified emails and 125M+ direct dials so every opportunity in your pipeline connects to an actual buyer - not a dead end that inflates your numbers.
Stop forecasting revenue you can't close because the contacts don't exist.
Accuracy Benchmarks
Here's the thing most teams get wrong: they obsess over methodology when their real problem is accuracy measurement. You can't improve what you don't track.
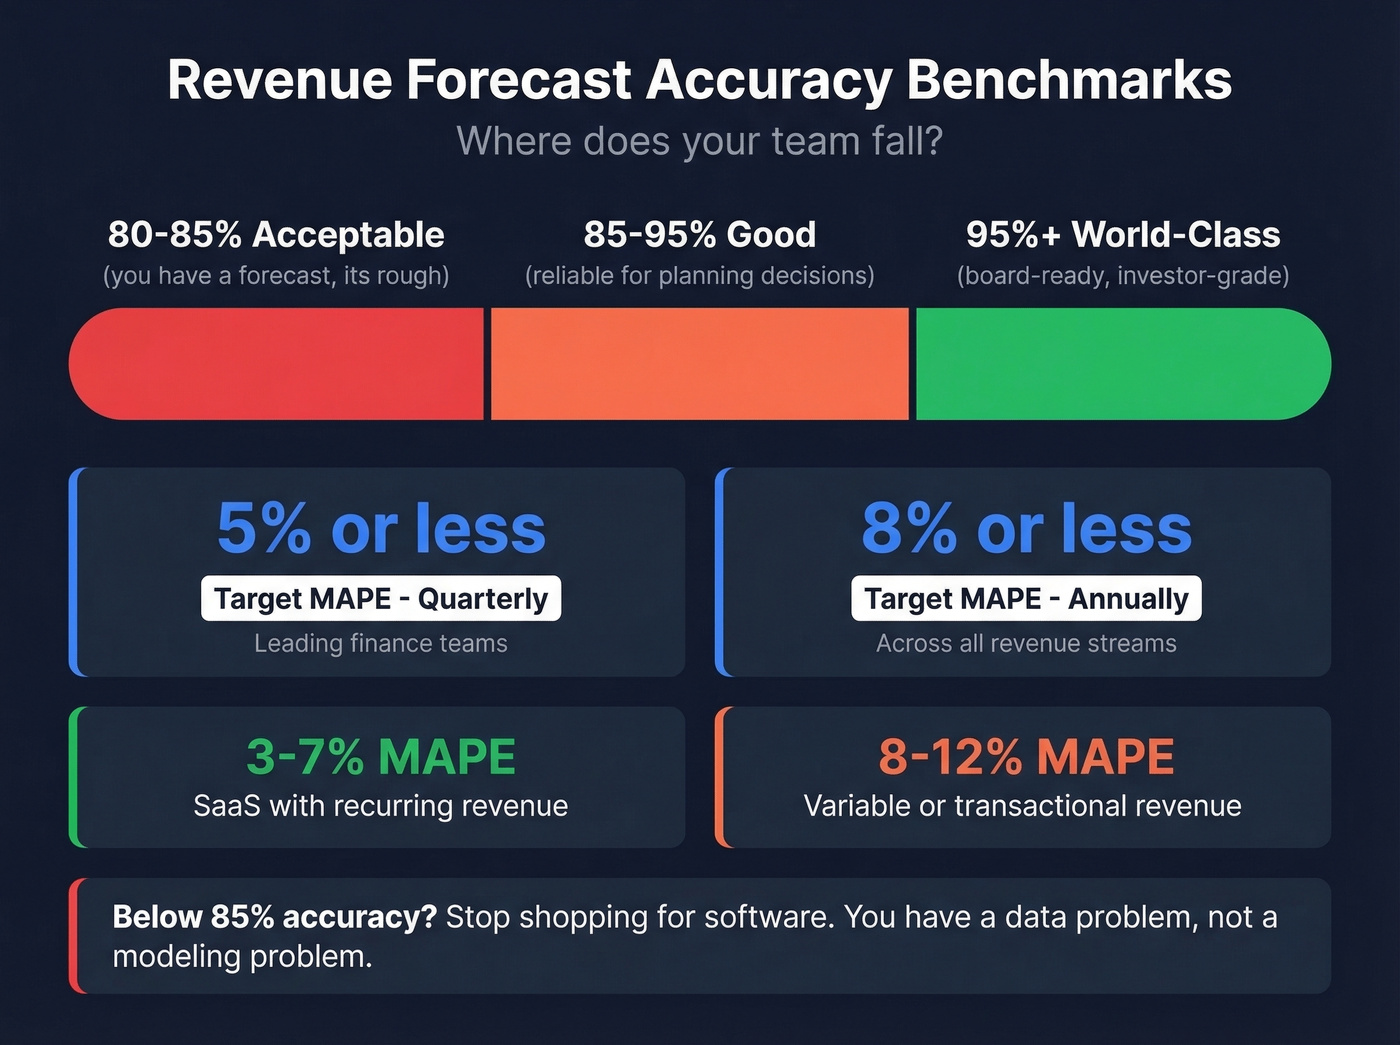
Leading finance teams target ≤5% MAPE quarterly and ≤8% annually. Those targets vary by business type - SaaS with recurring revenue should hit 3-7% MAPE, while variable or transactional revenue streams run 8-12%.
| Accuracy Tier | Range | What It Means |
|---|---|---|
| Acceptable | 80-85% | You have a forecast. It's rough. |
| Good | 85-95% | Reliable for planning decisions |
| World-class | 95%+ | Board-ready, investor-grade |
Monthly forecast cycles should take 5-7 business days. Quarterly cycles run 10-12. If your team spends three weeks building a quarterly forecast, you've got a process problem, not a modeling problem.
If your accuracy is below 85%, stop shopping for forecasting software. You have a data problem. No model, no matter how sophisticated, compensates for stale CRM records, missing pipeline stages, or reps who haven't updated their deals in three weeks.
AI and Machine Learning in Forecasting
Traditional forecasting methods typically produce 15-40% MAPE. Advanced ML systems bring that down to 5-15% - a 20-50% error reduction. That's meaningful, especially at scale.
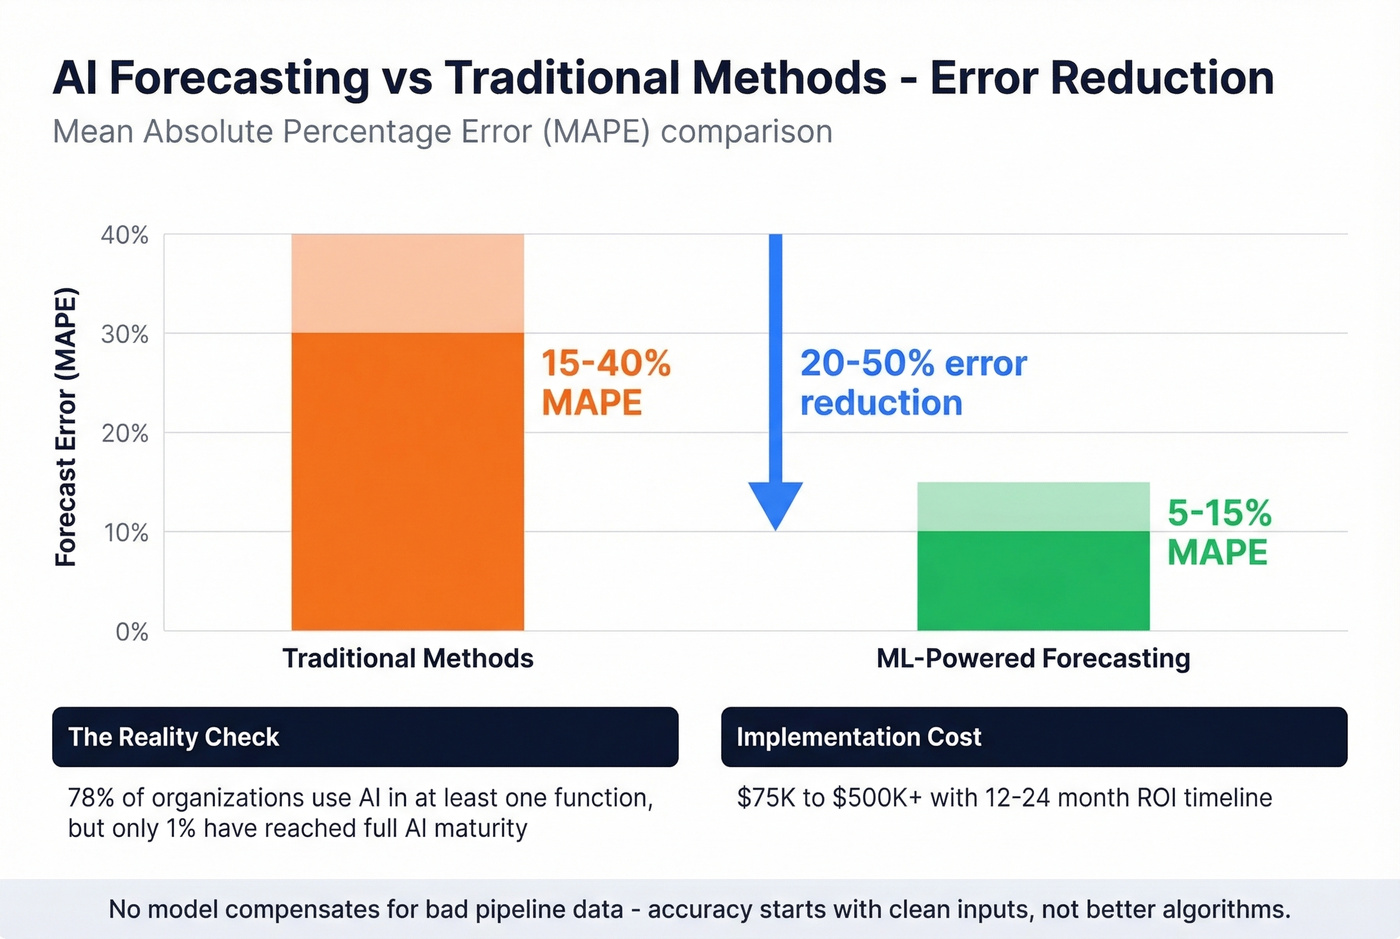
But AI won't save a broken process. McKinsey found that 78% of organizations use AI in at least one function, but only 1% have reached full AI maturity. Most companies are experimenting, not operationalizing. Implementation costs run $75K-$500K+ with ROI timelines of 12-24 months.
Every forecasting model - traditional or ML - is only as good as the pipeline data feeding it. If a meaningful share of your contact emails bounce, those "open opportunities" are phantom pipeline inflating your forecast. Tools like Prospeo, with 98% email accuracy and a 7-day data refresh cycle, keep your pipeline grounded in reality rather than a snapshot from six weeks ago.
Building a Forecast in Excel
Excel is still the right starting point for most teams under $50M. Don't let anyone tell you otherwise.
Moving average. Create a column for your 3-month rolling average using =AVERAGE(G2:I2). Drag it across your time series. This smooths noise and gives you a baseline trend - solid for transactional businesses.
Exponential smoothing. Use FORECAST.ETS, which automatically detects seasonality and weights recent data more heavily. Add FORECAST.ETS.CONFINT for confidence intervals and FORECAST.ETS.STATS to inspect smoothing coefficients.
Linear regression. Set up independent variables like leads, ad spend, and headcount in columns alongside revenue. Use the Data Analysis ToolPak or LINEST to run the regression. The output tells you which drivers actually matter - and which ones are noise you've been tracking out of habit.
For SaaS templates, your columns should include MRR, churn rate, CAC, LTV, tier breakdowns, and NRR. The template structures from K38 Consulting are a good starting reference.
You'll outgrow Excel when you have multiple product lines, usage-based pricing, or need real-time scenario modeling across departments. Until then, a well-maintained spreadsheet beats a $50K platform that nobody trusts.
Common Mistakes to Avoid
Every forecasting failure we've seen traces back to one of these patterns.
- Relying on rep gut feel. "Happy ears" inflates pipeline. Fix it with structured qualification frameworks and leading indicators like email engagement, multi-threading, and scheduled next steps.
- Stale CRM data. Pipeline changes so fast that a monthly snapshot is outdated within days. Weekly pipeline updates, minimum. Non-negotiable.
- Ignoring seasonality. Build a seasonality index from at least 1-2 years of data. Skipping this is the #1 reason transactional businesses feel like they're guessing.
- Mixing pipeline types. Renewals, expansions, and new business have completely different conversion dynamics. Forecast them separately.
- Over-reliance on historical data. History tells you what happened, not what's happening. Incorporate forward-looking signals like competitive moves to predict future revenue more reliably.
- Not reconciling with capacity. If your forecast implies each rep closes 40% more than their historical average, you don't have a forecast. You have a fantasy.
- Overcomplicating models. A Monte Carlo simulation isn't better than a moving average if your data can't support it. Start simple.
- Bad contact data inflating pipeline. Leads with bounced emails and disconnected phone numbers sit in your CRM as "open opportunities." They aren't opportunities - they're noise dragging your forecast upward.
Revenue Forecasting Tools
Look, the tool you need depends entirely on your company's size and complexity. If you have to "request a demo" to learn the cost, budget $30K+ and a 3-6 month implementation.
| Tool | Best For | Typical Starting Price | Our Pick? |
|---|---|---|---|
| Excel / Sheets | Teams under $50M | Free | Best start |
| Jirav | SMB FP&A | ~$50/mo | |
| Causal | Analysts / small teams | Free; ~$50/mo paid | |
| Mosaic | Mid-market ($10-50M) | ~$1,000-3,000/mo | Best mid-market |
| Pigment | Mid-market to enterprise | ~$2,000-5,000+/mo | |
| Cube | Mid-market FP&A | ~$1,500-4,000/mo | |
| Planful | Enterprise ($50M+) | ~$25K-75K+/yr | |
| Anaplan | Enterprise ($50M+) | ~$30K-100K+/yr | Best enterprise |
| Workday Adaptive | Enterprise ($50M+) | ~$30K-100K+/yr | |
| Metronome | SaaS usage-based | ~$2,000-5,000+/mo |
Under $10M revenue: Excel with a clean CRM is genuinely sufficient - don't let vendors convince you otherwise. $10-50M: Mosaic or Causal for driver-based modeling without enterprise overhead. We've tested both; Mosaic scales better past $20M ARR. Above $50M with multiple business units: Anaplan or Workday Adaptive Planning earn their price through scenario modeling and cross-departmental planning. Usage-based SaaS: Metronome or Orb provide billing-grade data that generic FP&A tools can't match.
Bottom-up forecasting breaks when reps can't fill their pipeline with qualified prospects. Prospeo's 300M+ profiles, 30+ filters, and intent data across 15,000 topics give your team the capacity to actually hit the number your model predicts - at $0.01 per lead.
Reconcile your forecast against reality - give reps data that converts.
FAQ
What's the Difference Between Revenue and Sales Forecasting?
Sales forecasting predicts deals expected to close within a given period. Revenue forecasting is broader - it includes renewals, expansions, services, and revenue recognition timing across all streams. A sales forecast feeds into the revenue forecast as one input, but treating them as interchangeable will undercount existing-customer revenue every quarter.
What MAPE Should I Target?
Leading teams target ≤5% MAPE quarterly and ≤8% annually. SaaS companies with recurring revenue should hit 3-7%, while transactional or variable businesses typically run 8-12%. Consistently above 15%? Focus on CRM data quality and pipeline hygiene before investing in better models.
Do I Need Dedicated Forecasting Software?
For most teams under $50M, Excel with a clean CRM is sufficient. Invest in dedicated tools when you have multiple product lines, usage-based pricing, or need real-time scenario modeling across departments. The tool matters far less than the data feeding it.
How Often Should I Update My Forecast?
Most mature teams refresh monthly and run a full reforecast each quarter. Monthly cycles should take 5-7 business days; quarterly cycles run 10-12. If your business has high deal-flow variability, weekly pipeline reviews feeding into a rolling forecast keep projections grounded in current reality rather than stale assumptions.