Revenue Team KPIs: The Only Metrics That Matter in 2026
It's Monday morning. Your CRO pulls up the dashboard and sees pipeline coverage sitting at 2.8x. Marketing says MQLs are up 40%. Sales says pipeline is healthy. CS says NPS hit an all-time high. And yet - revenue is flat for the second straight quarter. Nobody can explain why, because everyone's tracking their own metrics in their own silo. You don't have a data problem. You have a revenue team KPIs problem.
Gartner projects that by 2026, 75% of the highest-growth companies will have adopted a RevOps model, up from less than 30% a few years ago. The companies making that shift aren't just reorganizing org charts - they're killing departmental KPI sprawl and replacing it with a unified set of metrics that actually predict revenue.
The Five KPIs That Actually Matter
If you track nothing else, track these five:
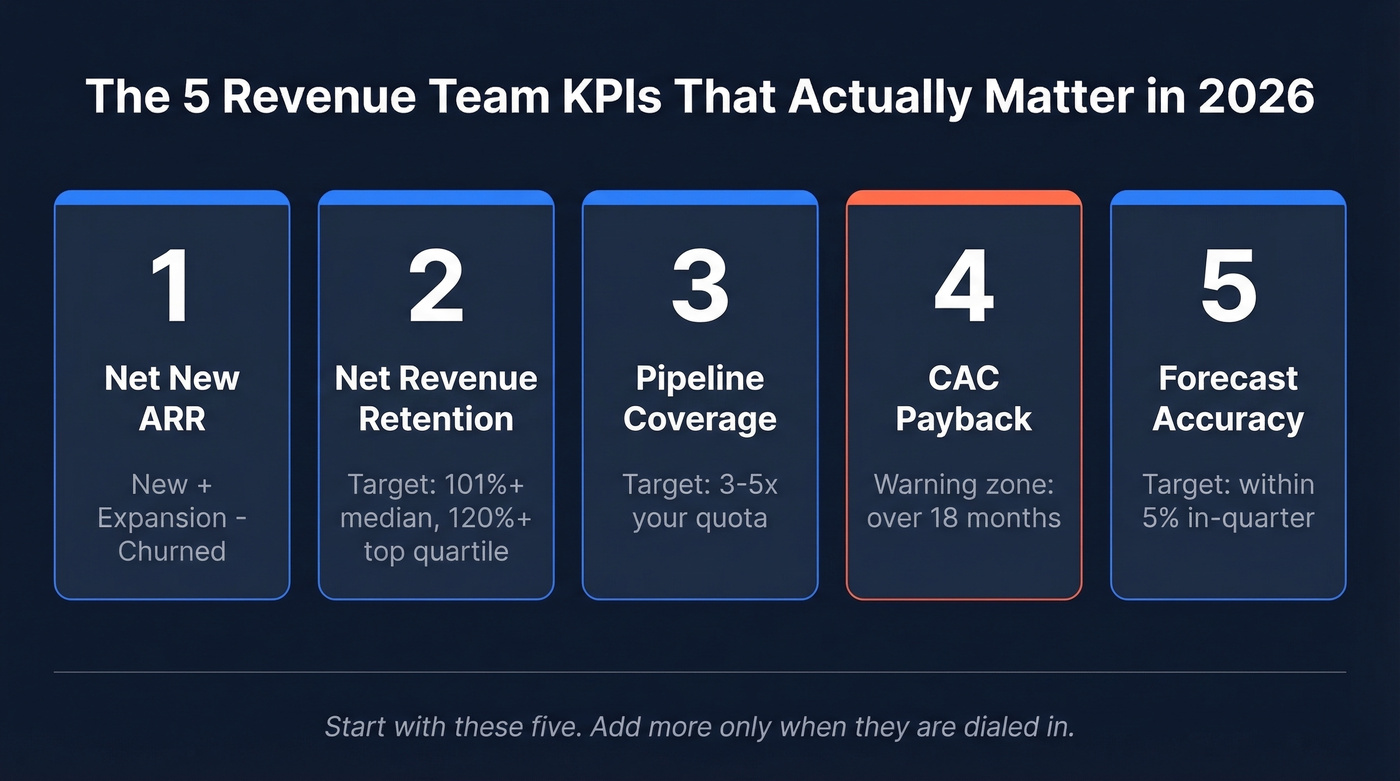
- Net New ARR - the single number that tells you whether you're growing. New ARR + Expansion ARR - Churned ARR. Everything else is a supporting act.
- Net Revenue Retention (NRR) - are your existing customers growing or shrinking? Below 100% means you're on a treadmill.
- Pipeline Coverage - do you have enough qualified pipeline to hit the number? 3-4x is typical, and up to 5x if your win rates are inconsistent.
- CAC Payback - how long until a new customer pays for themselves? Anything over 18 months is a warning sign.
- Forecast Accuracy - can you actually predict what's going to close? If you're off by more than 5% in-quarter, your operating plan is fiction.
Most KPI guides hand you 20+ metrics and zero benchmarks. You end up tracking everything and acting on nothing. Start with these five. Add more only when they're dialed in and consistently reviewed.
Why These Differ from Sales KPIs
Sales KPIs measure the sales team. Revenue team KPIs measure the entire customer lifecycle - from the first marketing touch through expansion and renewal. That distinction isn't semantic. It's the difference between optimizing a department and optimizing a business.
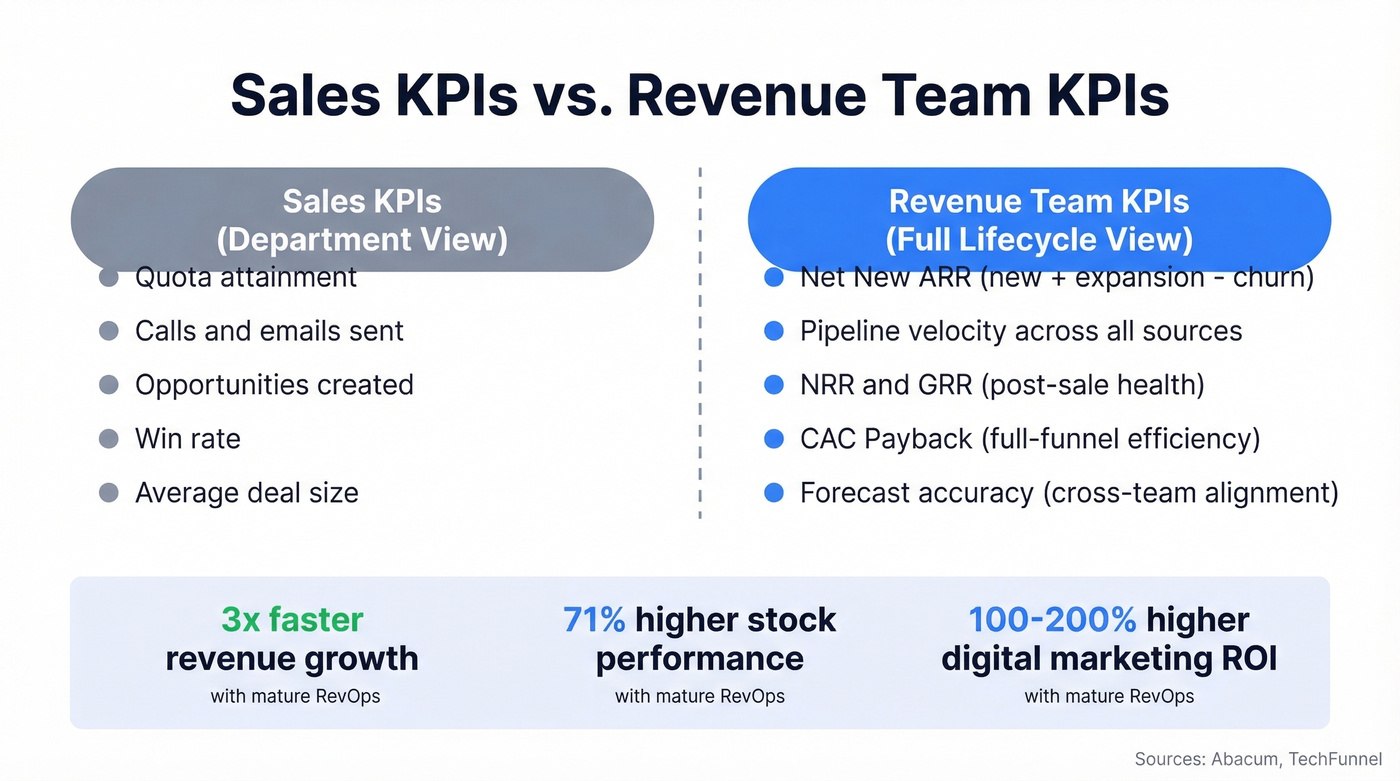
Companies with mature RevOps functions grow revenue 3x faster than those without. Aligned GTM teams see 100-200% higher ROI on digital marketing initiatives, and public companies running RevOps saw 71% higher stock performance compared to those that didn't.
The cost of misalignment is just as stark. Companies with siloed operations see 27% longer sales cycles, 18% higher CAC, and 23% lower revenue per employee. Tool sprawl alone can increase TCO by $127,000 annually - and most of that spend goes to platforms that don't talk to each other.
Here's the thing: when marketing tracks MQLs, sales tracks pipeline, and CS tracks NPS - and none of those metrics connect - you get a QBR where everyone looks good and revenue looks flat. Shared accountability across the funnel fixes that.
The KPI Framework: Strategy, Plan, Execution
Most teams dump every metric into one dashboard and call it "data-driven." That's not a system - it's a spreadsheet with a logo. The framework that actually works organizes KPIs into three tiers, each serving a different audience and cadence. Sapphire Ventures laid this out well - strategy for the board, plan for operators, execution for weekly ops.
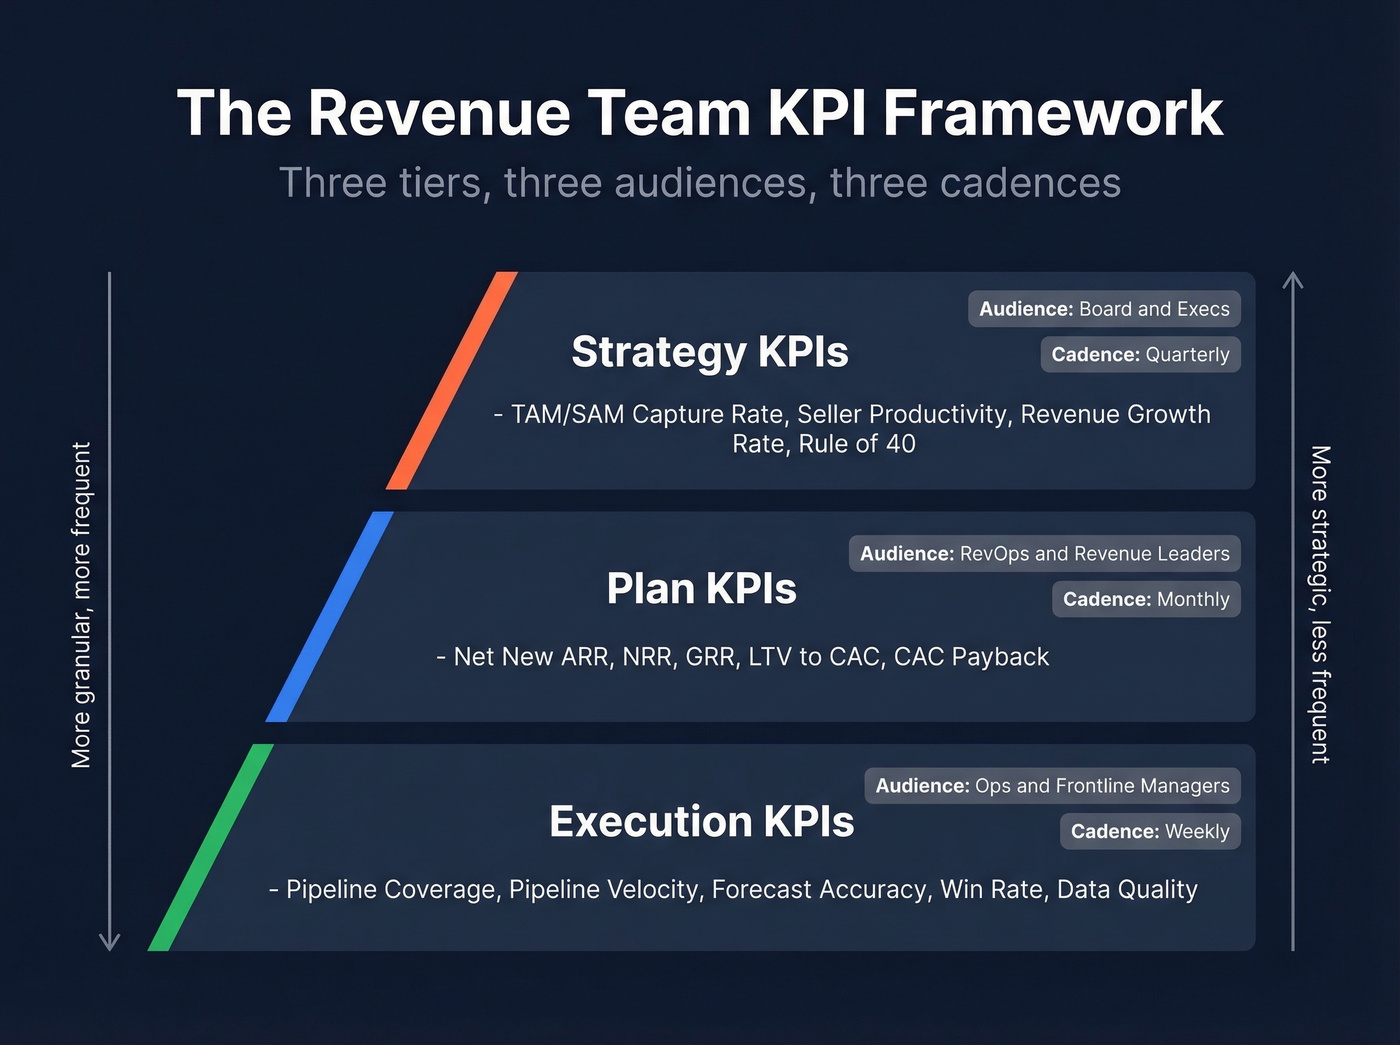
Strategy KPIs (Board-Level)
These are the metrics your board and executive team review quarterly. They don't change week to week, and they shouldn't.
TAM/SAM Capture Rate. What percentage of your addressable market have you actually penetrated? Populate your CRM with SAM by region and segment, then track penetration by dollar and logo count. This tells you whether growth is slowing because of execution or because you're running out of market.
Seller Productivity. Total bookings per productive sales rep. Not per headcount - per productive rep. The distinction matters when half your team is still ramping.
Revenue Growth Rate by Stage. Expectations vary wildly by company size. Sub-$1M ARR? Target ~100% growth. $1M-$10M? 60-80%. Over $50M? 20-30% is strong. If your board is benchmarking a $5M company against a $100M company's growth rate, push back.
Rule of 40. Growth rate + profit margin. Companies scoring above 60% command 2-3x higher valuations. It's the single best proxy for balancing growth and efficiency.
Plan KPIs (Operator-Level)
This is where RevOps and revenue leaders live. These metrics get reviewed monthly and drive resource allocation, territory planning, and capacity models.
Net New ARR is the North Star. Formula: New ARR + Expansion ARR - Churned ARR. Not TCV, not bookings, not pipeline. ARR. A two-year deal worth $200K isn't $200K of ARR - it's $100K. Don't let TCV inflate your story.
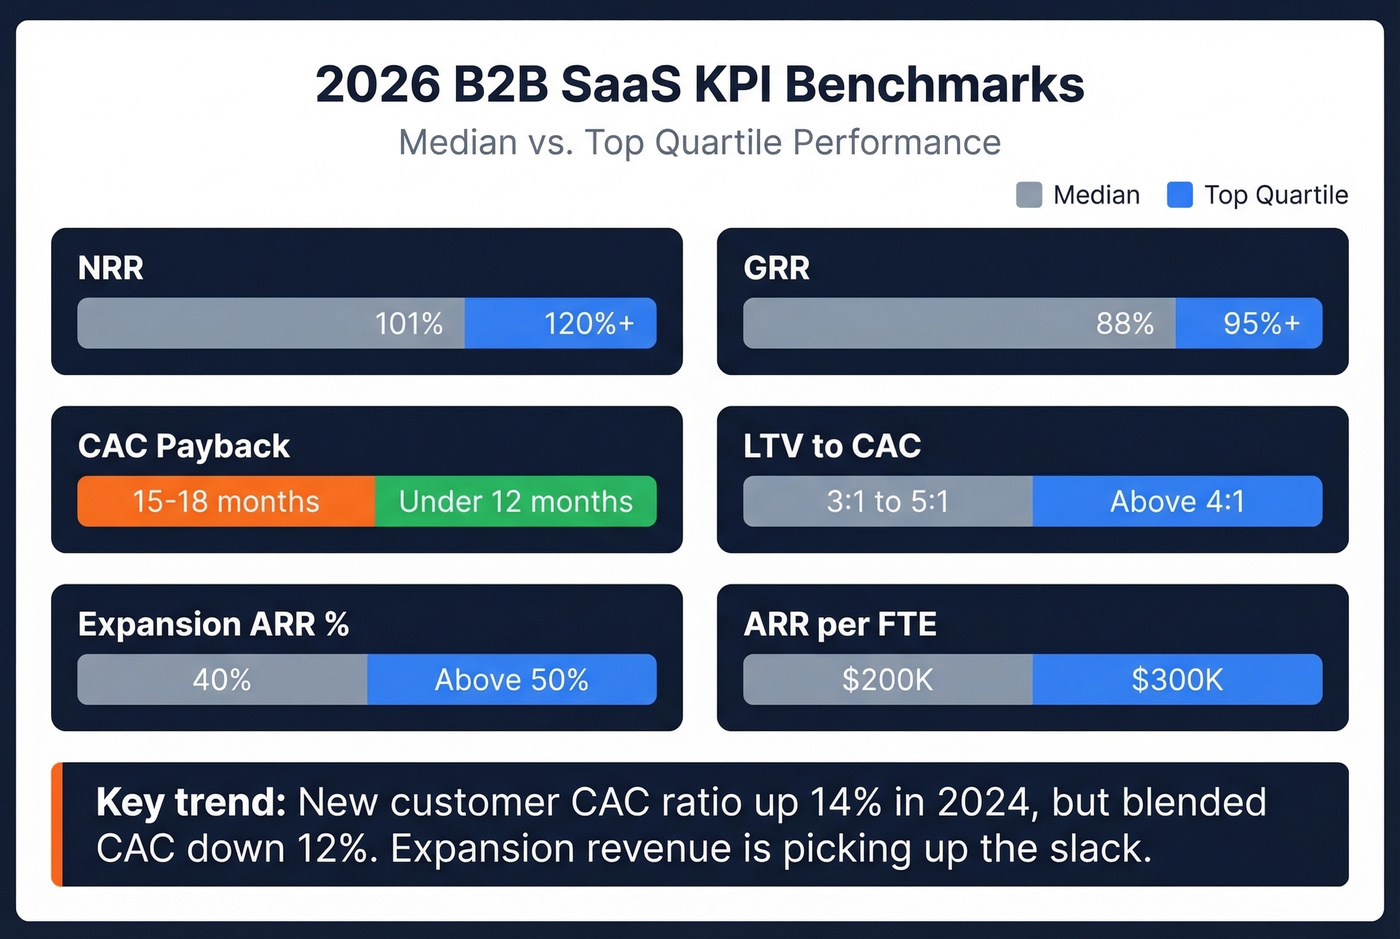
Net Revenue Retention - the 2026 median across B2B SaaS is ~101%. Top performers hit 120%+. Below 100% means your existing base is shrinking, and no amount of new logos will outrun that. NRR is also one of the clearest indicators of customer success team performance, since it reflects whether post-sale teams are driving expansion and preventing churn.
Gross Revenue Retention - median sits at 88%, down from 90% three years ago. If yours is below 85%, you don't have a sales problem. You have a product problem. GRR strips out expansion and tells you how sticky your product actually is.
LTV:CAC - healthy range is 3:1 to 5:1. Top companies run above 4:1. Below 3:1 and you're spending too much to acquire customers who don't stick around long enough.
CAC Payback - median is 15-18 months. Elite teams get under 12. Above 24 months? Your unit economics don't work at scale.
| KPI | Median | Top Quartile |
|---|---|---|
| NRR | 101% | 120%+ |
| GRR | 88% | 95%+ |
| New CAC Ratio | $2.00 per $1 ARR | <$1.50 |
| CAC Payback | 15-18 months | <12 months |
| LTV:CAC | 3:1-5:1 | >4:1 |
| Seller Attainment | 60% at/above plan | 70%+ |
Execution KPIs (Weekly Ops)
These are the metrics your ops team and frontline managers review weekly. They're the early warning system.
Pipeline Coverage - 3-5x your target. Below 3x and you're hoping, not planning. Above 5x and you probably have a qualification problem - lots of pipeline, not enough of it real.
Pipeline Velocity - (Number of Opportunities x Average Deal Value x Win Rate) / Sales Cycle Length. This single formula captures the health of your entire funnel in one number. When velocity drops, dig into which variable moved.
Forecast Accuracy - target +/-3% for the current quarter, +/-5% for Q+1. In our experience, teams that can't forecast within 10% end up with hiring plans, marketing budgets, and board expectations that are all wrong.
Conversion/Win Rate - track stage-to-stage, not just overall. A 25% overall win rate can mask a 60% drop-off between demo and proposal that nobody's investigating.
Data Quality - this is the KPI underneath every other KPI, and most teams ignore it entirely. Your pipeline coverage, conversion rates, and CAC are only as reliable as the data feeding them.
Let's walk through a scenario we've seen play out dozens of times. Your SDR team generates 400 leads. But if your contact database refresh cadence is the 6-week industry average, decay hits fast. 38% of those emails bounce. You're left with roughly 250 usable contacts, and your cost-per-lead just doubled. Every downstream metric - conversion rate, pipeline coverage, CAC - is now built on inflated numbers.

Prospeo addresses this with a 7-day data refresh cycle, 98% email accuracy, and CRM enrichment that returns 50+ data points per contact at a 92% API match rate. Snyk's team of 50 AEs saw their bounce rate drop from 35-40% to under 5%, and AE-sourced pipeline jumped 180% after switching. When your data is clean, your KPIs tell the truth.
You just read that siloed operations cause 27% longer sales cycles and 18% higher CAC. The fix starts with shared, accurate data. Prospeo gives your entire revenue team - sales, marketing, CS - one source of truth: 300M+ profiles, 98% verified emails, and 30+ filters including buyer intent and technographics. All refreshed every 7 days.
Stop letting bad data inflate your CAC payback by months.
Leading Indicators That Predict Revenue
Lagging indicators tell you what happened. Leading indicators tell you what's about to happen - and give you 60-90 days to intervene before the revenue impact hits. That's the window you actually have to fix things.
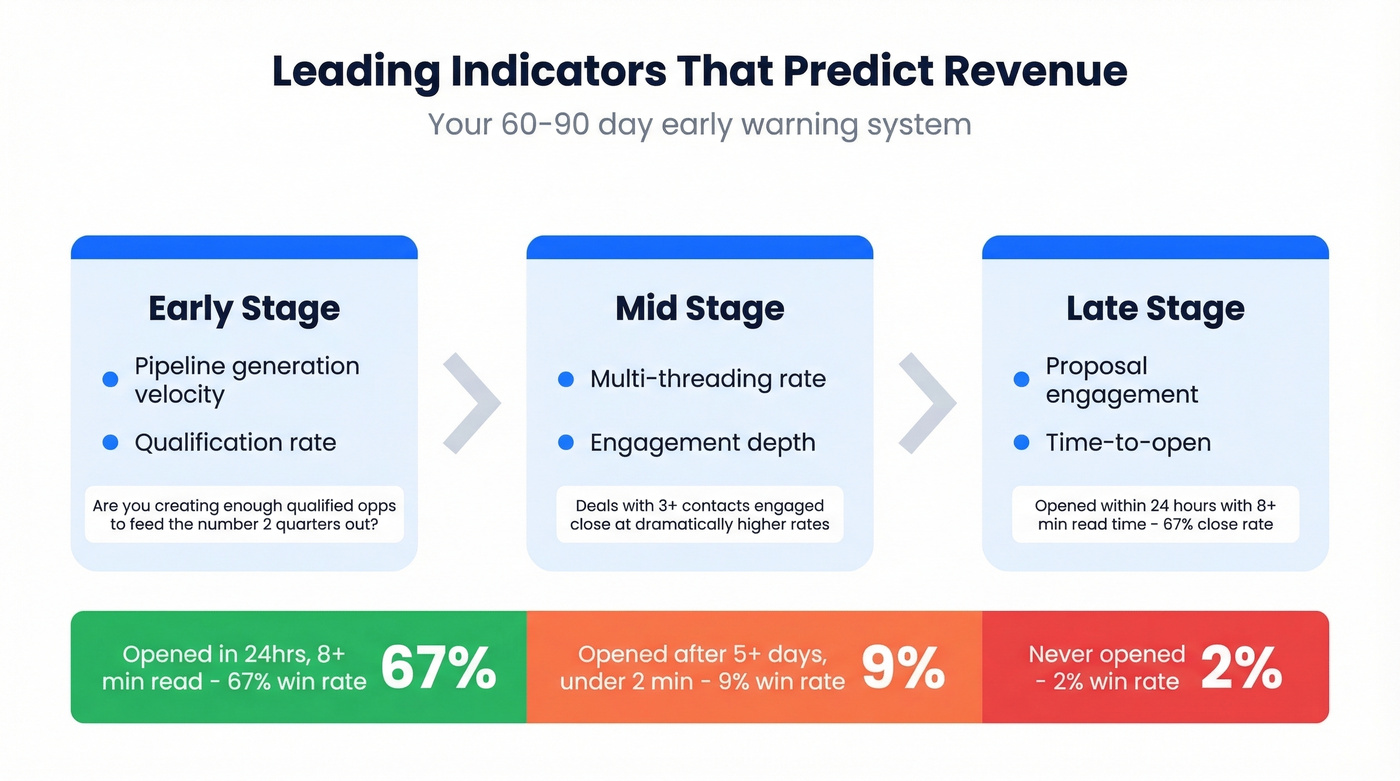
The distinction matters at every stage of the funnel. Early-stage leading indicators include pipeline generation velocity and qualification rate - are you creating enough qualified opportunities to feed the number two quarters out? Mid-stage, track multi-threading rate and engagement depth. Deals with a single champion close at dramatically lower rates than deals with three or more contacts engaged. Late-stage, proposal engagement is remarkably predictive: proposals opened within 24 hours with 8+ minutes of read time close at a 67% rate. Opened after 5+ days with less than 2 minutes? 9%. Never opened? 2%.
Activity metrics still matter, but they're the least interesting leading indicators. Yes, it takes an average of 8 touches to create a meaningful connection with a prospect. But tracking "calls made" without tracking "conversations that advanced a deal" is measuring motion, not progress. The best revenue teams track activity volume as a floor, then focus their energy on engagement quality and pipeline generation velocity.
2026 Benchmarks by Stage
Most KPI guides define CAC but don't tell you whether $2.00 per $1.00 of new ARR is good or terrible. That tells you everything about the state of B2B content.
| KPI | Median | Top Quartile | Stage Notes |
|---|---|---|---|
| Expansion ARR % | 40% | >50% | >50% typical at $50M+ |
| ARR per FTE | $200K | $300K | $200K at $50M-$100M |
| Growth Rate | 26% | 50% | Top quartile down from 60% |
Growth expectations shift dramatically by stage. A sub-$1M company growing at 26% is underperforming. A $50M+ company growing at 26% is right at median. Stage-appropriate benchmarks prevent the board from comparing apples to aircraft carriers.
One trend worth flagging: the median new customer CAC ratio increased 14% in 2024, while blended CAC actually decreased 12%. Acquiring new logos is getting more expensive, but expansion revenue is picking up the slack. If your expansion ARR contribution isn't approaching 40%, you're fighting an increasingly expensive acquisition-only battle.
Look - if your average deal size is under $10K, you probably don't need a 30-metric dashboard or a six-figure RevOps platform. You need five clean KPIs, a single source of truth for your data, and a weekly review cadence. Complexity is a luxury that scales with deal size, not the other way around.
KPI Mistakes That Kill Revenue
Tracking too many metrics. When everything's a KPI, nothing is. We've seen dashboards with 30+ metrics where the ops team spends more time maintaining the dashboard than acting on it. Five to seven KPIs. That's the sweet spot.
Building reporting dashboards instead of decision-making systems. There's a real difference between a dashboard that shows you what happened and a system that tells you what to do about it. Reporting-focused analytics delay decision-making by 8.5 days and can consume 30% of ops capacity. If your dashboard doesn't trigger an action, it's a screensaver.
Ignoring lead quality. Only 56% of companies track lead quality at all. The rest track volume and wonder why conversion rates are declining. MQL count without a quality signal is a vanity metric.
Inheriting metrics instead of designing them. You've sat through a QBR where marketing showed MQL growth, sales showed pipeline, and CS showed NPS - and nobody could explain why revenue was flat. That happens when each team picks the metrics their tools surface by default, rather than intentionally designing shared metrics that connect across the funnel. Skip this trap by starting with the outcome you want to predict and working backward to the inputs that drive it.
Building Your Dashboard
A good dashboard has five properties: it's metric-backwards (starts with the outcome, works back to drivers), time-anchored (trailing 12 months, current quarter, today), role-based (the CRO sees different things than the SDR manager), drill-friendly (click into any number to see what's behind it), and alert-ready (thresholds that trigger notifications, not just color changes).
For PLG companies, orient the dashboard around activation funnel and cohort expansion. For board reporting, build a CFO one-pager: burn/runway + MRR bridge + forecast vs budget. The layout should match the audience - a CS war-room dashboard tracking health scores and renewal dates looks nothing like an executive summary, and it shouldn't.
Review cadence matters as much as the metrics themselves. Activity metrics daily. Pipeline and forecast weekly. Unit economics monthly. Strategy KPIs quarterly. A monthly review of pipeline coverage is too slow to course-correct. A daily review of NRR is noise.
AI-powered forecasting tools like Clari and Gong can automate forecast accuracy tracking and flag deal risk earlier than manual reviews. They're worth evaluating if your team is north of 20 reps and your forecast accuracy consistently misses the +/-5% target.
For visualization, you don't need to spend a fortune:
| Tool | Price | Best For |
|---|---|---|
| Power BI | $10/user/mo | Best value under 50 users |
| Geckoboard | $39/mo | Simple, clean dashboards |
| Databox | $49/mo | Multi-source rollups |
| Tableau | $75/user/mo | Worth it only with a dedicated analyst |
Before you build dashboards, verify your data. Prospeo integrates natively with Salesforce and HubSpot to enrich and verify contacts automatically - no manual CSV exports, no stale records polluting your metrics.
Data quality is the KPI underneath every other KPI - and the article just told you most teams ignore it. Prospeo's 5-step verification, catch-all handling, and 7-day refresh cycle keep your pipeline metrics honest. Teams using Prospeo see bounce rates drop from 35% to under 4% and pipeline increase by 140%.
Every revenue KPI you track is wrong if the contact data is stale.
FAQ
What's the difference between revenue team KPIs and sales KPIs?
Revenue team KPIs span marketing, sales, customer success, and RevOps - measuring the full customer lifecycle from first touch through renewal. Sales KPIs focus narrowly on pipeline and closed-won. Revenue teams track NRR, expansion ARR, and CAC payback alongside acquisition metrics, creating shared accountability across every GTM function.
How many KPIs should a revenue team track?
Five to seven is the sweet spot. More creates dashboard fatigue where metrics get reviewed but never acted on. Start with Net New ARR, NRR, pipeline coverage, CAC payback, and forecast accuracy. Add function-specific metrics only after these five consistently drive real decisions every week.
What's a good net revenue retention rate?
The 2026 B2B SaaS median is approximately 101%, while top performers hit 120%+. Below 100% means your existing customers are shrinking - and no amount of new business will outrun that. GRR below 85% alongside low NRR signals a product problem, not a sales problem.
How does data quality affect revenue KPIs?
Bad contact data inflates every metric downstream - pipeline coverage, conversion rates, CAC. If 38% of your emails bounce, your "400 leads" are really 250 usable contacts and your cost-per-lead just doubled. A 7-day data refresh cycle and 98% email verification keep your dashboard grounded in reality, versus the 6-week industry average that lets decay compound unchecked.