Sales ROI: The Practitioner's Guide to Calculating, Diagnosing, and Improving It
It's budget season. Your VP wants three more reps, and finance wants proof the last three were worth it. You open a spreadsheet, stare at the revenue number, and realize you don't actually know what those reps cost - not the real number, anyway. That gap between "revenue they generated" and "what we actually spent" is where sales ROI lives, and most teams get it wrong.
The phrase also means two different things depending on who's asking. Finance wants to measure the return on your sales investment. Your reps want to sell ROI to get a prospect's CFO to sign off. This guide covers the measurement side, because you can't sell ROI to buyers if you can't calculate your own.
The Short Version
If you're pressed for time:
- The formula: (Revenue - Total Cost) / Total Cost x 100. That's your percentage ROI.
- The benchmark: 3:1-5:1 is a good range for a salesperson. High-performing teams hit 5:1+.
- The #1 mistake: Undercounting costs. A rep's true cost isn't their salary - it's 1.4-1.6x their base once you add benefits, recruiting, tools, and management overhead.
- The fastest fix: Clean up your data before optimizing anything else. If a third of your outbound emails bounce, you're paying reps to talk to nobody.
Everything below unpacks these four points with real math.
How to Calculate Sales ROI
The Core Formula
The standard ROI formula works for sales the same way it works everywhere else:
ROI = (Revenue - Total Cost) / Total Cost x 100
If your sales team generated $500K in margin-adjusted revenue and cost $150K fully loaded, that's ($500K - $150K) / $150K x 100 = 233% ROI, or roughly a 3.3:1 ratio. Simple enough on paper. The hard part is getting honest numbers into both sides of the equation.
ROI vs. ROS vs. ROAS
These three get confused constantly.
| Metric | Formula | Measures | Use When... | |--------|---------|----------|-------------| | Sales ROI | (Revenue - Cost) / Cost x 100 | Return per dollar invested | Justifying spend | | ROS | Net Profit / Revenue x 100 | Profit efficiency | Measuring efficiency | | ROAS | Revenue / Ad Spend | Ad revenue return | Evaluating paid campaigns |
A worked ROS example: $100K in revenue, $70K in costs, $30K net profit - ROS = 30%. That's healthy. A ROS of 5-10% is generally considered solid in sales-driven industries, so 30% means your cost structure is tight. To calculate return on sales for your own team, just divide net profit by total revenue and multiply by 100.
Which Formula for Which Scenario
Use ROI when you're justifying an investment to finance - "should we hire three more reps?" Use ROS when you're evaluating operational efficiency - "are we spending too much to generate each dollar?" Use ROAS strictly for paid acquisition channels. Mixing them up is one of the fastest ways to present a number that looks great but answers the wrong question entirely, and we've watched it derail board meetings more than once.
The True Cost of a Sales Rep
Here's where most ROI calculations fall apart. Teams divide revenue by base salary and call it a day. That's not the real number.
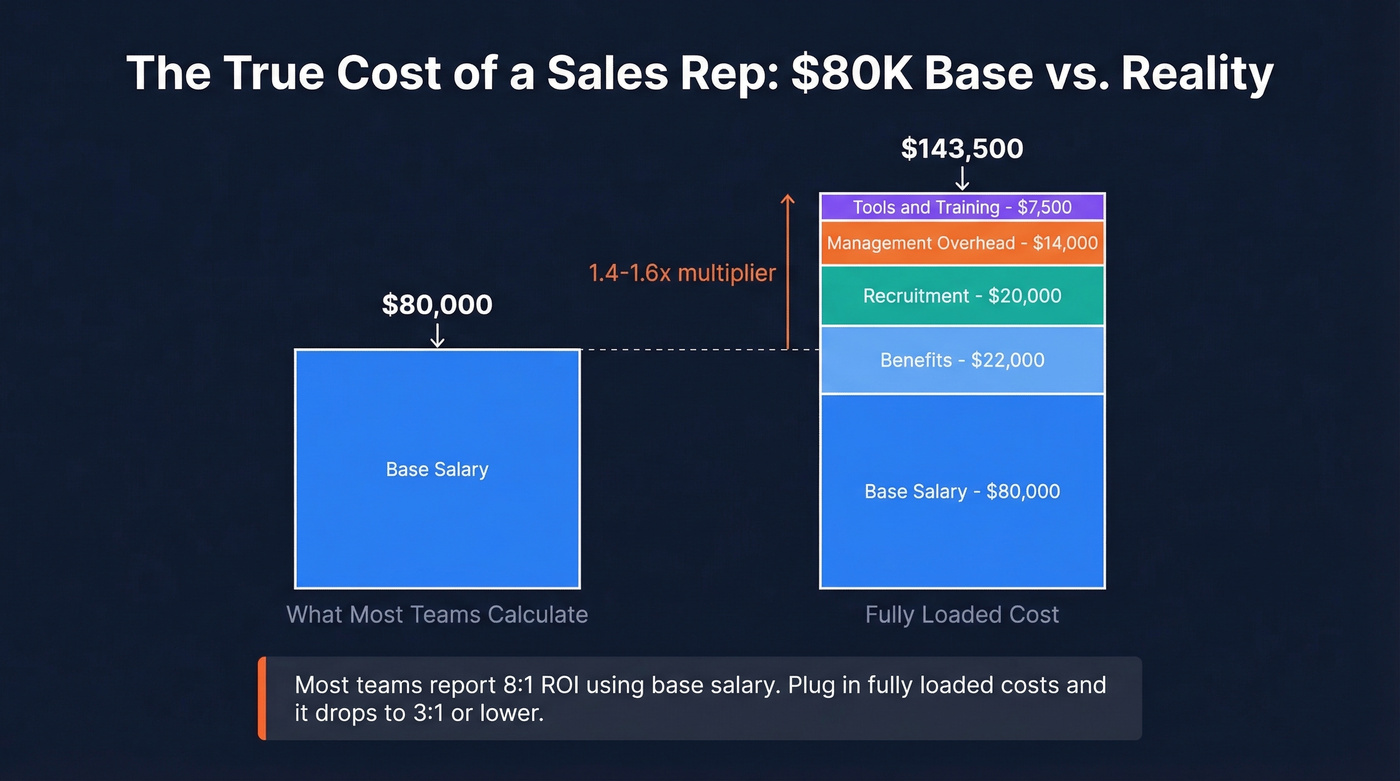
The true cost of employment for an in-house rep typically runs 1.4-1.6x their base salary. For an $80K base:
| Cost Category | Multiplier | Dollar Amount | |---------------|-----------|---------------| | Base salary | 1.0x | $80,000 | | Benefits | 25-30% | $20,000-$24,000 | | Recruitment | 20-30% of salary | $16,000-$24,000 | | Management overhead | 15-20% | $12,000-$16,000 | | Tools & training | Variable | $5,000-$10,000 | | Fully loaded total | 1.4-1.6x | $112,000-$128,000 |
Now factor in ramp time separately. Most SDRs take 6-12 months to reach full productivity, and average SDR tenure is 15-18 months. That means a significant chunk of their employment is spent ramping - producing below their potential while costing the same. If you're not accounting for ramp in your denominator, your ROI looks artificially high for new hires and artificially low for tenured reps.
This is a common frustration in practitioner communities. Sales leaders in newer markets often have zero baseline data, making return-on-investment calculations feel like guesswork. The fix is the same regardless: start with fully loaded costs and work backward from margin-adjusted revenue.
We've seen teams calculate rep ROI using base salary alone and report 8:1 ratios. Plug in fully loaded costs and a ramp adjustment, and that number drops to 3:1 or lower. Still positive, but a very different story for the board.
Three Worked Examples
Campaign ROI
Say you're running a B2B search campaign. Using industry benchmarks from WordStream: average CPC is $5.26, average click-to-lead conversion rate is 7.52%, and average CPL is $70.11. You spend $10,000.
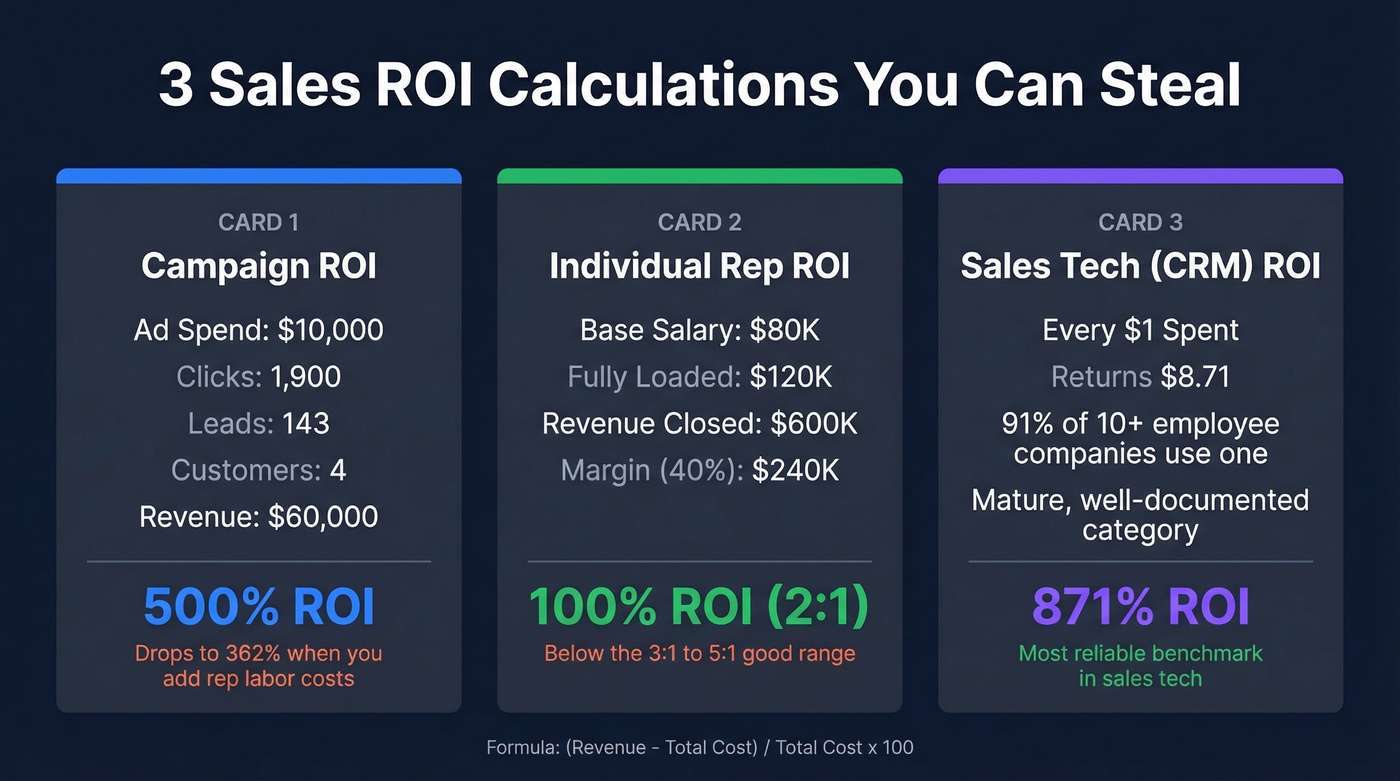
That gets you roughly 1,900 clicks and about 143 leads at a 7.52% click-to-lead rate. Apply the median B2B lead-to-customer rate of 2.9%: 143 leads x 2.9% = roughly 4 customers. If average deal value is $15,000, you've generated $60,000 from $10,000 in ad spend. ROI = ($60K - $10K) / $10K x 100 = 500%.
But that $10K doesn't include the SDR time to work those 143 leads. Add $3K in rep time and your real ROI drops to about 362%. Still excellent - but notice how the number shifts the moment you account for labor.
Individual Rep ROI
Take a mid-market AE with an $80K base. Fully loaded cost: $120K. They closed $600K in revenue last year, but your gross margin is 40%, so margin-adjusted revenue is $240K.
ROI = ($240K - $120K) / $120K x 100 = 100%, or a 2:1 ratio. That's below the 3:1-5:1 "good" range. This rep isn't underwater, but they're not justifying their seat either. Most managers would look at the $600K topline and feel great. The margin-adjusted math tells a different story.
Here's the thing: if your average deal size is under five figures, obsessing over individual rep ROI is a waste of time. The variance between reps matters less than the system feeding them leads. Fix the system first - better data, tighter ICP targeting, faster lead routing - and individual numbers follow.
Sales Tech ROI
CRM is the easiest sales tech ROI to benchmark. Businesses using CRMs see $8.71 in return for every $1 spent, and 91% of companies with 10+ employees already use one. That's a mature, well-documented return.
For newer tools, the math gets murkier. One major sales engagement platform's ROI calculator - built on data from 5,000+ customers - reports +44% meetings booked, +20% opportunities created, and +10% win rate improvement. Those numbers are measured at the 25th percentile with 70% adoption over 13-15 months, which makes them more conservative than most vendor claims. Your results will depend entirely on how well your team actually adopts the tool.
You just read that bad data makes reps talk to nobody. Prospeo's 98% email accuracy and 7-day data refresh mean your team spends time selling, not bouncing. At $0.01 per email, the ROI math is obvious.
Stop paying reps to chase dead leads. Start with clean data.
Where Your Sales ROI Leaks
Let's walk the funnel. Based on an analysis of 100M+ data points from Implisit, here's where B2B deals die - and the numbers are worse than most teams assume.
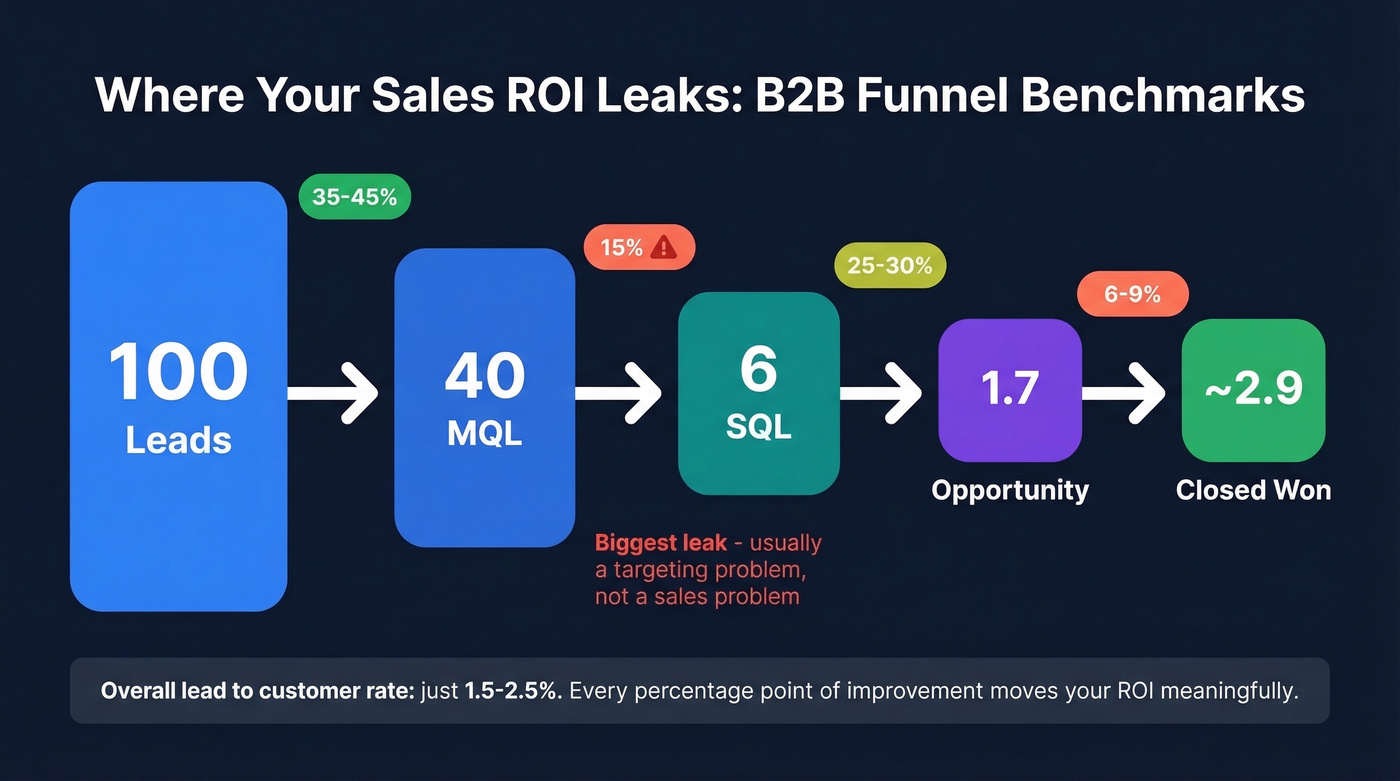
The first stage, lead to MQL, converts at 35-45%. Not terrible. But the MQL-to-SQL handoff is where the real damage happens: only about 15% make it through. This is the biggest leak in most funnels, and it's usually a targeting problem, not a sales problem. You're generating leads that were never going to buy.
From SQL to opportunity, 25-30% convert. Opportunity to closed-won sits at 6-9%. The overall lead-to-customer rate? Just 1.5-2.5%, with the median B2B conversion at 2.9%. For every 100 leads, you're closing fewer than 3. Every percentage point of improvement here moves your ROI meaningfully.
But the leak often starts before the funnel, with bad data. If 35% of your outbound emails bounce, a third of your reps' prospecting hours produce zero pipeline. That's wasted salary inflating the cost side of your ROI equation while contributing nothing to revenue.
Snyk saw this firsthand. Their 50 AEs were spending 4-6 hours per week prospecting, but bounce rates ran 35-40%. After switching to verified data with 98% email accuracy and a 7-day refresh cycle, bounce rates dropped below 5%. AE-sourced pipeline jumped 180%, and the team generated 200+ new opportunities per month. Same reps, same effort, dramatically different ROI because the data feeding the funnel was actually clean.
In our experience, the single fastest ROI improvement comes from fixing data quality - not hiring more reps.
Five Mistakes That Ruin Your Numbers
1. Confusing cash flow with booked revenue. A $50K deal closed in Q4 doesn't mean $50K hit the bank in Q4. If payment terms are net-60 or the deal is structured as annual payments, your cash-based ROI looks very different from your bookings-based ROI. Finance cares about cash. Sales reports bookings. The mismatch creates arguments every quarter.
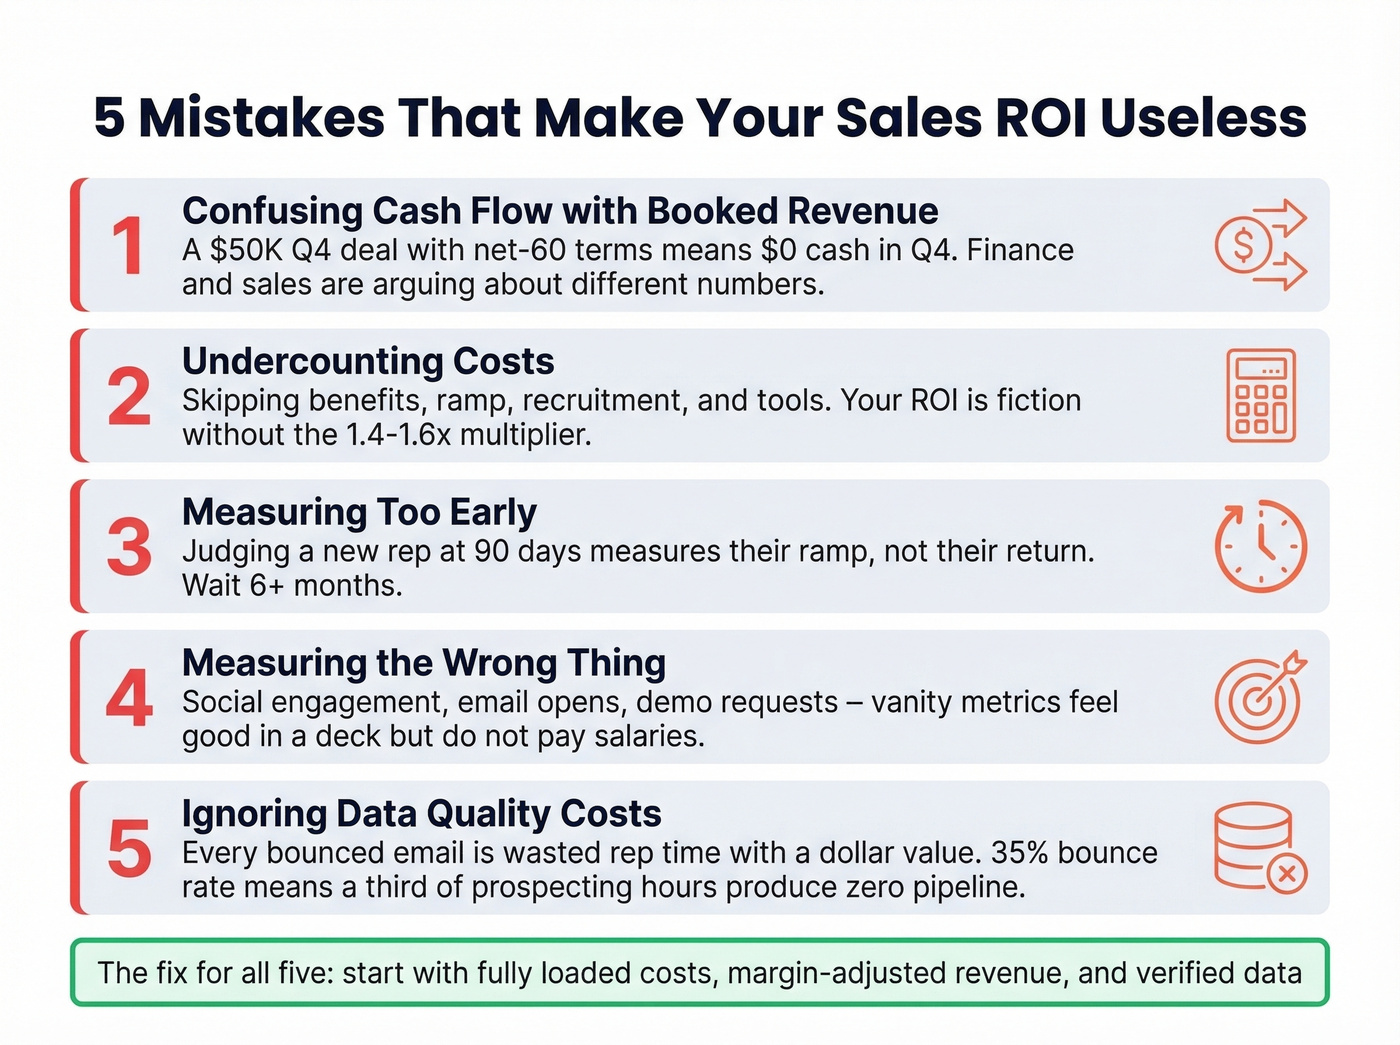
2. Undercounting costs. Benefits, ramp, recruitment, tools, management overhead - skip any of these and your ROI is fiction. The 1.4-1.6x multiplier isn't optional.
3. Measuring too early. B2B sales cycles run months, sometimes quarters. Measuring a new rep's ROI at 90 days is measuring their ramp, not their return. Give it 6+ months before drawing conclusions. (If you need a ramp framework, use a 30-60-90 day plan to standardize expectations.)
4. Measuring the wrong thing. The classic cautionary tale: Pepsi's Refresh campaign generated massive social engagement - and zero incremental sales. Vanity metrics feel good in a deck. They don't pay salaries.
5. Ignoring data quality costs. Every bounced email, every wrong number, every outdated contact is wasted rep time - and that time has a dollar value. Prospeo's free tier gives you 75 verified emails per month plus 100 Chrome extension credits at 98% accuracy, so you can measure the impact of clean data on your pipeline before committing budget. If your bounce rate drops from 30% to under 5%, you've just reclaimed a third of your reps' prospecting capacity without spending a dime on new headcount. (To benchmark and fix bounces, track your email bounce rate alongside pipeline.)
Sales Tech ROI Benchmarks
Let's be honest about vendor ROI calculators: they're marketing tools. Every one of them is designed to make the purchase look like a no-brainer. That doesn't mean the underlying data is useless - it means you should understand the methodology before citing the numbers in a board deck.
The most transparent calculator we've found is built on 5,000+ customer benchmarks, uses 25th-percentile improvement rates (meaning 75% of customers saw better results), and assumes only 70% adoption. Those are conservative assumptions, which makes the outputs more credible than most.
| Tool Category | Benchmark ROI | Caveat |
|---|---|---|
| CRM | $8.71 per $1 spent | Mature category, well-documented |
| Sales engagement | +44% meetings, +10% win rate | 25th percentile, 70% adoption |
| Data/enrichment | 2-5x pipeline lift with verified data | Depends entirely on accuracy |
The CRM number is the most defensible. The engagement platform numbers are directional. Data tool ROI is almost entirely dependent on accuracy - a tool that saves reps 5 hours a week but feeds them 30% bad emails isn't saving anything. Verified data with a short refresh cycle is the floor, not the ceiling. If you're comparing vendors, start with a shortlist of data enrichment services and validate accuracy before you model ROI.
Fully loaded rep costs hit $120K+. Every bounced email and wrong number erodes that investment. Prospeo gives you 143M+ verified emails and 125M+ verified mobiles - teams using it book 26% more meetings than ZoomInfo users.
Cut the waste in your denominator. Get data that actually connects.
ROI Calculators Worth Using
Skip this section if you're comfortable building your own spreadsheet model. For everyone else, three tools stand out:
Outreach ROI Calculator is the most detailed free option. It pulls from 5,000-customer benchmarks and lets you input your team size, deal metrics, and current conversion rates. The output is a dollar estimate of incremental revenue you can plug into your own ROI formula.
UpliftGTM SDR ROI Calculator is best for SDR-specific cost modeling. It forces you to input benefits, recruitment costs, management overhead, and ramp time - all the hidden costs most teams skip. Free, no signup required. (If you're building the SDR stack too, compare SDR tools before you lock in costs.)
ROI Selling / ValueNavigator serves a different purpose entirely. This one helps you build buyer-facing business cases, not internal ROI reports. For teams that need to present ROI to prospects as part of the sales process, it's the right tool. 30-day free trial.
Sales ROI FAQ
What's a good ROI for a sales team?
A 3:1-5:1 ratio is the standard benchmark for a healthy sales organization. High-performing teams consistently hit 5:1 or higher. Below 3:1, you're effectively subsidizing sales with investor capital or margin from other business units. Always measure against fully loaded costs - not base salary alone.
How do you calculate return on sales?
Return on sales (ROS) is different from sales ROI. Divide net profit by total revenue and multiply by 100 - for example, $30K profit on $100K revenue = 30% ROS. A healthy ROS in most sales-driven industries falls between 5-10%, though high-margin software companies can exceed 20%.
How do you calculate ROI for a single rep?
Use fully loaded cost (1.4-1.6x base salary including benefits, tools, and management overhead) as your denominator and margin-adjusted revenue as your numerator. Formula: (Margin Revenue - Fully-Loaded Cost) / Fully-Loaded Cost x 100. A mid-market AE closing $600K at 40% margin against $120K fully loaded cost delivers 100% ROI - a 2:1 ratio.
How does data quality affect sales ROI?
Directly and significantly. If 35% of outbound emails bounce, a third of rep time produces zero pipeline - inflating costs while adding nothing to revenue. Teams that cut bounce rates from 35-40% to under 5% with verified data have seen AE-sourced pipeline jump 180%, proving that clean contact data is the highest-leverage fix most teams overlook.
How often should you measure sales ROI?
Quarterly, not annually. Annual averages mask seasonal variation, rep ramp curves, and market shifts. A rep who looks like 5:1 annually might be 1:1 in Q1 and 10:1 in Q4. Quarterly cadence gives you data you can actually act on - annual measurement gives you a number for a board slide.