SaaS Sales Forecasting: Benchmarks, Methods, and Math for 2026
Only 7% of sales organizations hit 90%+ forecast accuracy. The median sits at 70-79%. And yet every board deck treats the forecast number like gospel.
Let's be honest: most "forecasts" are a rep roll-up with nicer formatting. It looks precise, it feels accountable, and it still misses because the inputs are messy.
Weighted pipeline forecasting with calibrated stage probabilities is the right default for most SaaS teams. If you're hitting 80%+ accuracy on a 30-day forecast, you're ahead of the market.
What SaaS forecasting really requires
Predicting future revenue in SaaS means modeling a business where customers churn, expand, downgrade, and sometimes pause. That subscription dynamic changes the job: you're not just predicting new logos, you're predicting what happens to a living revenue base while your pipeline is moving underneath it.
SaaS startups on Carta raised $28.2B in the first three quarters of 2025, up 25% year over year. Seed median valuations hit $19.8M; Series A hit $60M. At those valuations, forecasting rigor isn't optional, and investors can tell in about five minutes whether you're running a real model or just hoping the quarter works out.
Accuracy benchmarks by method
Most teams overestimate their forecasting ability. Forrester found that 79% of sales orgs miss by more than 10%. Here's how accuracy tends to break down by method, based on a benchmark study of 939 companies:
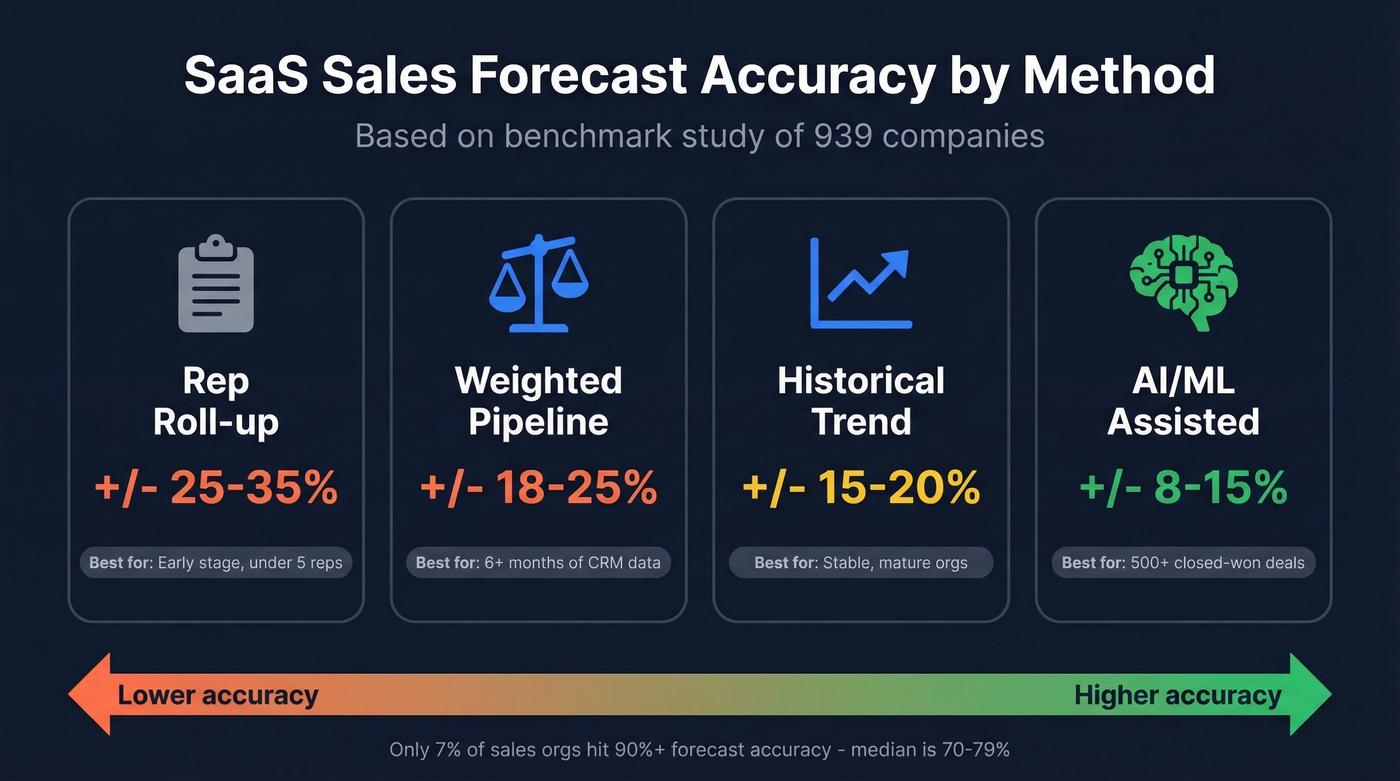
| Method | Typical variance | Best for |
|---|---|---|
| Rep roll-up | +/-25-35% | Early-stage, under 5 reps |
| Weighted pipeline | +/-18-25% | 6+ months of CRM data |
| Historical trend | +/-15-20% | Stable, mature orgs |
| AI/ML-assisted | +/-8-15% | 500+ closed-won deals |
Accuracy decays fast with time horizon. A 30-day forecast can land at 85-90% accuracy. At 60 days you're often at 75-80%. At 90 days, 65-75% is common, which is basically "directionally useful" but not something you should bet hiring plans on without a buffer.
We've watched teams panic over 75% accuracy when that's actually above median. If your 30-day forecast is consistently 80%+, you're doing better than most.
Metrics that drive your forecast
The benchmarks shift dramatically by deal size, which is why a single "industry average" is mostly noise.
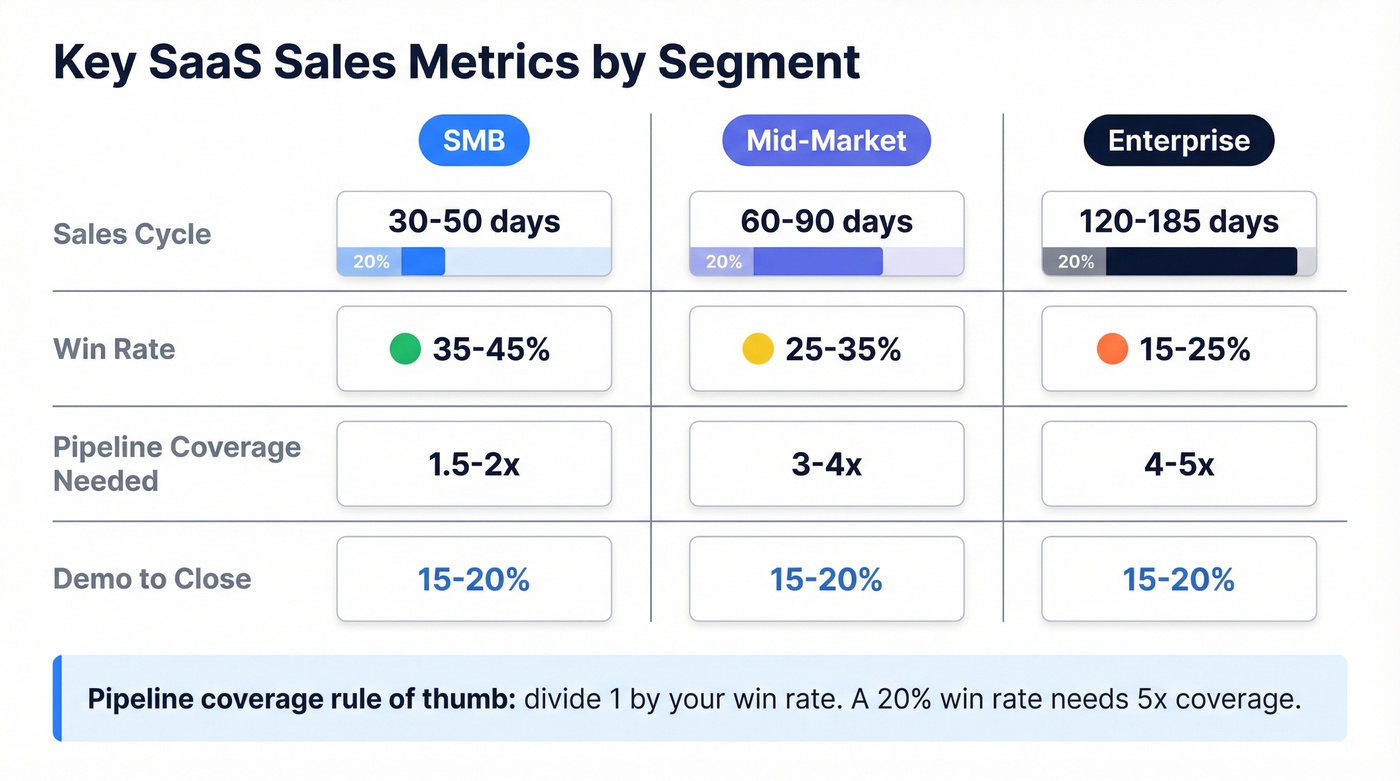
| Metric | SMB | Mid-market | Enterprise |
|---|---|---|---|
| Sales cycle | 30-50 days | 60-90 days | 120-185 days |
| Win rate | 35-45% | 25-35% | 15-25% |
| Pipeline coverage | 1.5-2x | 3-4x | 4-5x |
| Demo-to-close | 15-20% | 15-20% | 15-20% |
NRR benchmarks from Benchmarkit show a median of 101% and a 75th percentile of 110%. If your forecast assumes flat retention, you're not being "conservative" - you're hiding a churn problem until it shows up as a surprise miss.
Pipeline coverage is where we see the most confusion. A 20% win rate needs roughly 5x coverage; a 40% win rate needs about 2.5x. The right multiple depends on your win rate, not a universal "3x rule" someone heard once and never questioned.
One more thing: your forecast needs inputs from marketing (pipeline generation changes), finance (recognized revenue timing), and HR (confirmed headcount budget). Siloed forecasts drift, then everyone argues about whose spreadsheet is "right."
Forecasting methods by data maturity
Fewer than 50% of sales leaders have high confidence in their own forecasts. The right method depends on how much history you have and how clean your CRM is.
Historical trending (limited deal history)
This works well pre-Series A or any time your pipeline is too thin to weight stages reliably.
Use monthly MRR waterfall math:
Starting MRR + new bookings + expansion - churn = ending MRR
Five inputs drive the model: current MRR, new customers per month, ARPU, net churn rate, and your MRR goal. Keep it simple, then tighten assumptions monthly as reality comes in. Forecasting isn't a one-time spreadsheet; it's a habit.
Weighted pipeline (the default for most SaaS teams)
If you've got 6+ months of CRM data, this is usually the best balance of effort and accuracy.
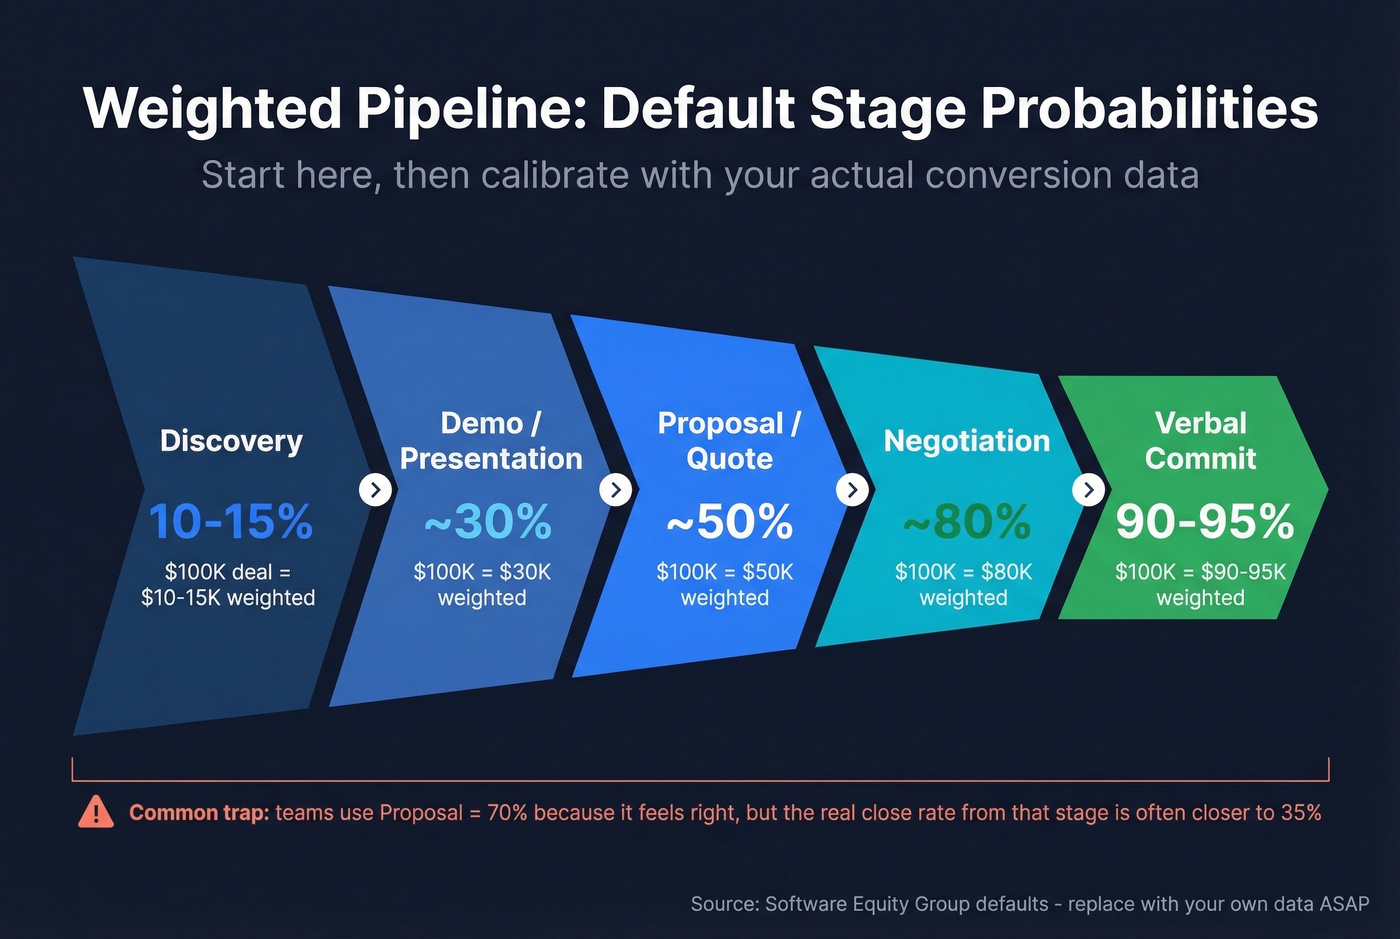
Assign probabilities to each stage based on your actual conversion rates. If you don't have enough history yet, start with sane defaults and replace them as soon as you have enough closed deals per stage to trust the math.
| Stage | Default probability |
|---|---|
| Discovery | 10-15% |
| Demo/presentation | ~30% |
| Proposal/quote | ~50% |
| Negotiation | ~80% |
| Verbal commit | 90-95% |
These are starting weights from Software Equity Group. They're fine as training wheels. They aren't fine as a permanent system.
Here's a scenario we see all the time: a team uses "Proposal = 70%" because it feels right, then wonders why the quarter misses. When we audit it, "Proposal" includes everything from "sent a PDF" to "legal redlines are in," and the real close rate from that stage is closer to 35%. Fix the stage definition, recalibrate the probability, and the forecast stops swinging like a pendulum.
AI/ML-assisted (only after you have real volume)
Tools like Clari or Aviso can spot patterns humans miss: deal velocity changes, engagement signals, multi-threading, and risk flags that correlate with slippage. But without enough training data, AI forecasting is just expensive guessing with a slick UI.
Hot take: most SaaS teams under $5M ARR don't need AI forecasting. A well-maintained weighted pipeline in HubSpot or Salesforce beats a poorly fed ML model every time, and the gap isn't subtle.
Pipeline coverage ratios only work when the pipeline is real. Bad contact data inflates your pipeline with deals that never connect. Prospeo delivers 98% email accuracy and 30% mobile pickup rates, so every opportunity in your weighted forecast is built on a conversation that actually happened.
Stop forecasting on phantom pipeline. Start with verified contacts.
The churn math your forecast ignores
Most revenue projections obsess over new bookings and treat churn like a footnote. That's backwards. If you don't model retention with the same seriousness as pipeline, your forecast will overshoot, and you'll spend the quarter "explaining" instead of operating.
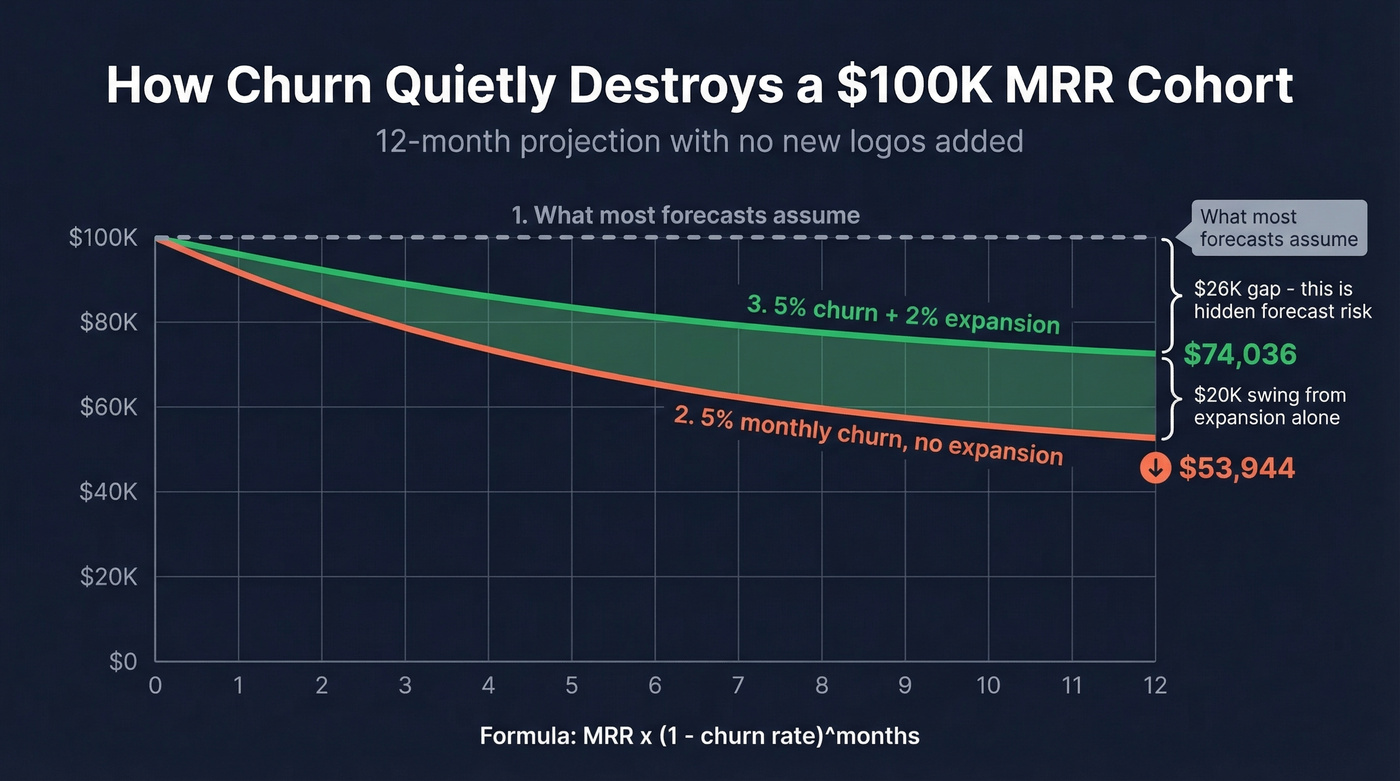
Take a $100K MRR cohort with 5% monthly gross churn and zero expansion. Using:
MRR x (1 - churn rate)^months
$100K x 0.95^12 = $53,944.
You've lost nearly half your revenue from customers you already won.
Now add 2% monthly expansion on top of that same churn dynamic. The cohort's 12-month value becomes $74,036. That's a roughly $20K swing driven entirely by expansion revenue, not a single new logo.
If your forecast assumes flat churn, it isn't a forecast. It's a wish.
Mature teams build a separate renewal forecast that tracks contract end dates, usage trends, and health scores, then feed those outputs into the top-line revenue forecast. That separation matters because renewals behave differently than new business, and mixing them usually hides risk until it's too late.
Five mistakes that blow up forecasts
- Modeling bookings instead of recognized revenue. A $120K annual contract signed in December doesn't mean $120K of December revenue.
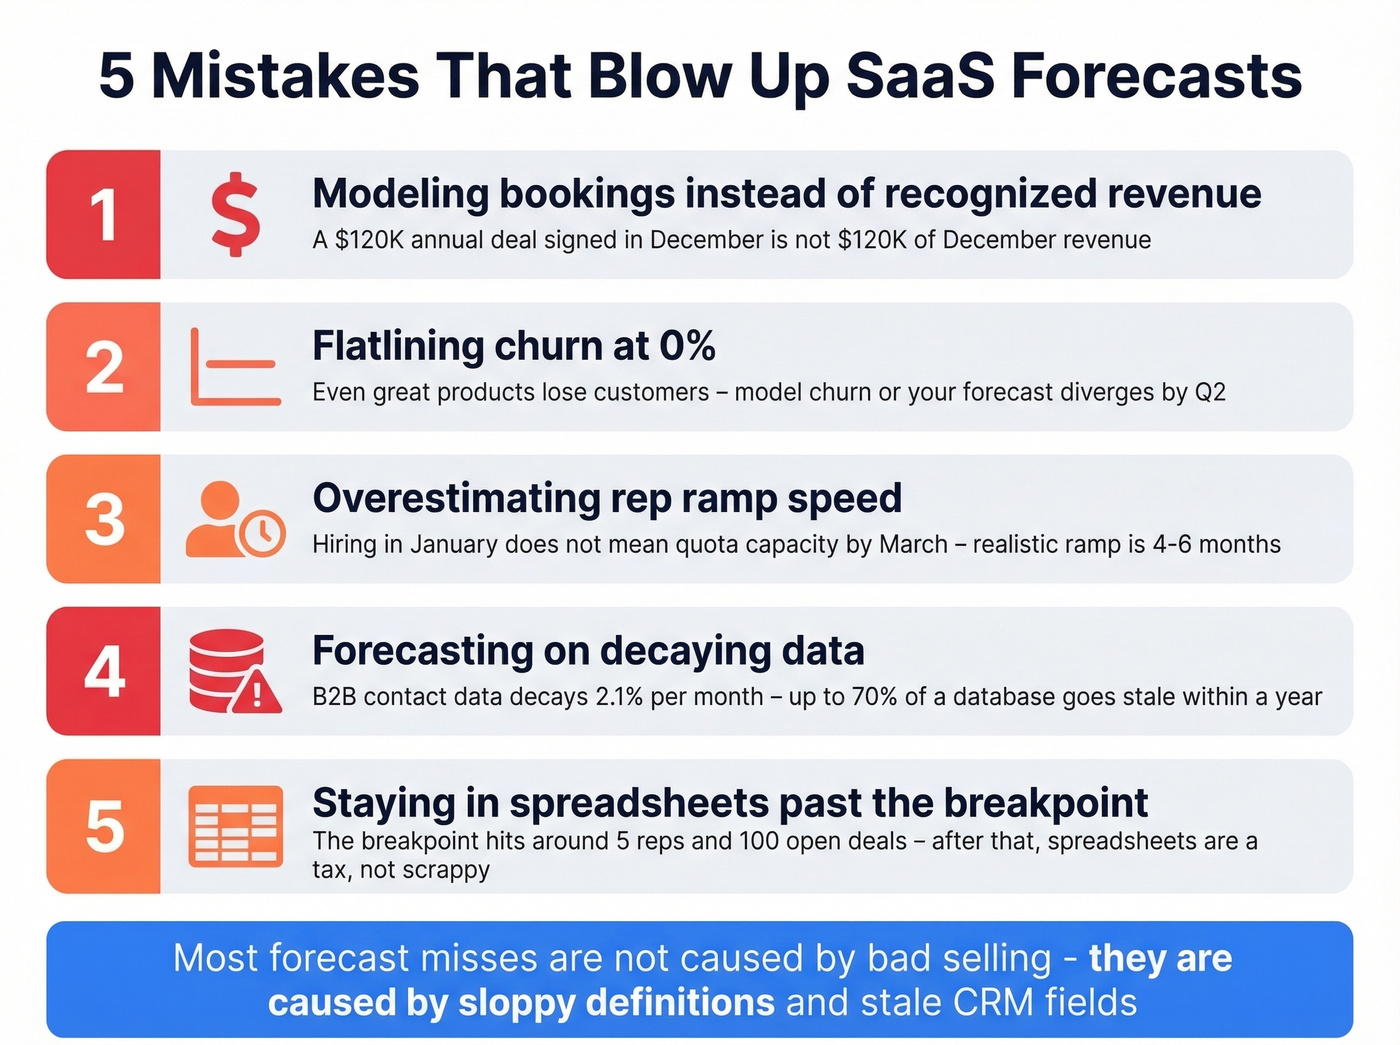
Flatlining churn at 0%. Even great enterprise products lose customers. Model churn, or your forecast diverges from reality by Q2.
Overestimating rep ramp speed. Hiring a rep in January doesn't mean quota capacity by March. Realistic ramp is often 4-6 months for B2B SaaS, and this is where founders get burned.
Forecasting on decaying data. B2B contact data decays 2.1% per month. Within a year, up to 70% of a database can go stale. Your weighted pipeline math doesn't matter if the champion changed jobs and nobody updated the record. This is one reason we use Prospeo in our own workflows: 98% email accuracy on a 7-day refresh cycle keeps pipeline data usable, which is the boring, unsexy part of forecasting that still decides whether your number is real.
Staying in spreadsheets past the breakpoint. In our experience, the breakpoint hits around 5 reps and 100 open deals, or when you're spending 3+ hours a week on manual updates. At that point, the spreadsheet isn't "scrappy" anymore. It's a tax.
Real talk: the most frustrating forecast misses aren't caused by "bad selling." They're caused by sloppy definitions and stale CRM fields that everyone swears they'll clean up "next week."
Forecasting tools by stage
Match the tool to your maturity. Overspending on an enterprise forecast platform with three reps is as wasteful as running a 50-person team on a shared spreadsheet.
| Stage | Tool | Pricing |
|---|---|---|
| Pre-revenue | Spreadsheets | Free |
| Early growth | Pipedrive Growth | ~$39/user/mo |
| Scaling | HubSpot Sales Hub Pro | ~$90/user/mo |
| Scaling | Forecastio | ~$199/mo |
| Mid-market+ | Salesforce Sales Cloud | $25-$300+/user/mo |
| Enterprise | Clari | ~$30K-$50K+/yr |
| Finance/FP&A | Anaplan / Workday | ~$50K-$150K+/yr |
Upgrade triggers: 5+ reps, 100+ deals, over 15% forecast variance, or 3+ hours per week on manual updates.
Skip this if you're still figuring out basic ICP and pricing. Until your pipeline has repeatable motion, fancy tooling mostly gives you prettier charts for the same uncertainty.
CTA
You just saw how a 5% churn swing changes everything. The same logic applies to pipeline inputs: bad data means missed dials, bounced emails, and inflated stage counts that wreck your forecast. Prospeo refreshes 300M+ profiles every 7 days - so your CRM reflects reality, not last quarter's org chart.
Accurate forecasts start with accurate data. Prospeo costs $0.01 per email.
FAQ
What forecast accuracy should a SaaS startup target?
Aim for 80%+ on 30-day forecasts. Median B2B accuracy is 70-79%, and only 7% of organizations consistently hit 90%+. Directional accuracy with tightening variance each quarter beats chasing perfection in month one.
How much pipeline coverage do I need?
Divide 1 by your win rate. A 20% win rate needs 5x coverage; a 40% win rate needs 2.5x. SMB teams often run 1.5-2x; enterprise teams need 4-5x to account for longer cycles and lower close rates.
How does CRM data quality affect forecast accuracy?
B2B contact data decays 2.1% per month, and within a year a big chunk of records go stale. Bad data quietly wrecks every forecasting method because your stage probabilities assume you can reach the buyer and move the deal. Prospeo refreshes records every 7 days at 98% email accuracy, which is one of the fastest ways to stop pipeline decay from turning into forecast variance.
When should I switch from spreadsheets to a forecasting tool?
Move off spreadsheets once you're past 5 reps and 100 open deals, or when manual forecast updates take 3+ hours weekly. At that point, a CRM-native forecasting layer like HubSpot or a dedicated tool like Forecastio usually pays for itself in time saved and fewer surprises.