SaaS Sales KPIs That Actually Matter in 2026
It's week six of the quarter. Your pipeline report says you're at 78% of target, but three "commit" deals just slipped, and marketing is celebrating MQLs your AEs haven't touched. 69% of B2B sales reps missed quota last year, and only 41% of software reps are hitting target per RepVue data. The problem isn't effort - most teams are tracking the wrong SaaS sales KPIs, or the right ones at the wrong cadence.
Five KPIs for Monday Morning
If you review nothing else each week, make it these:
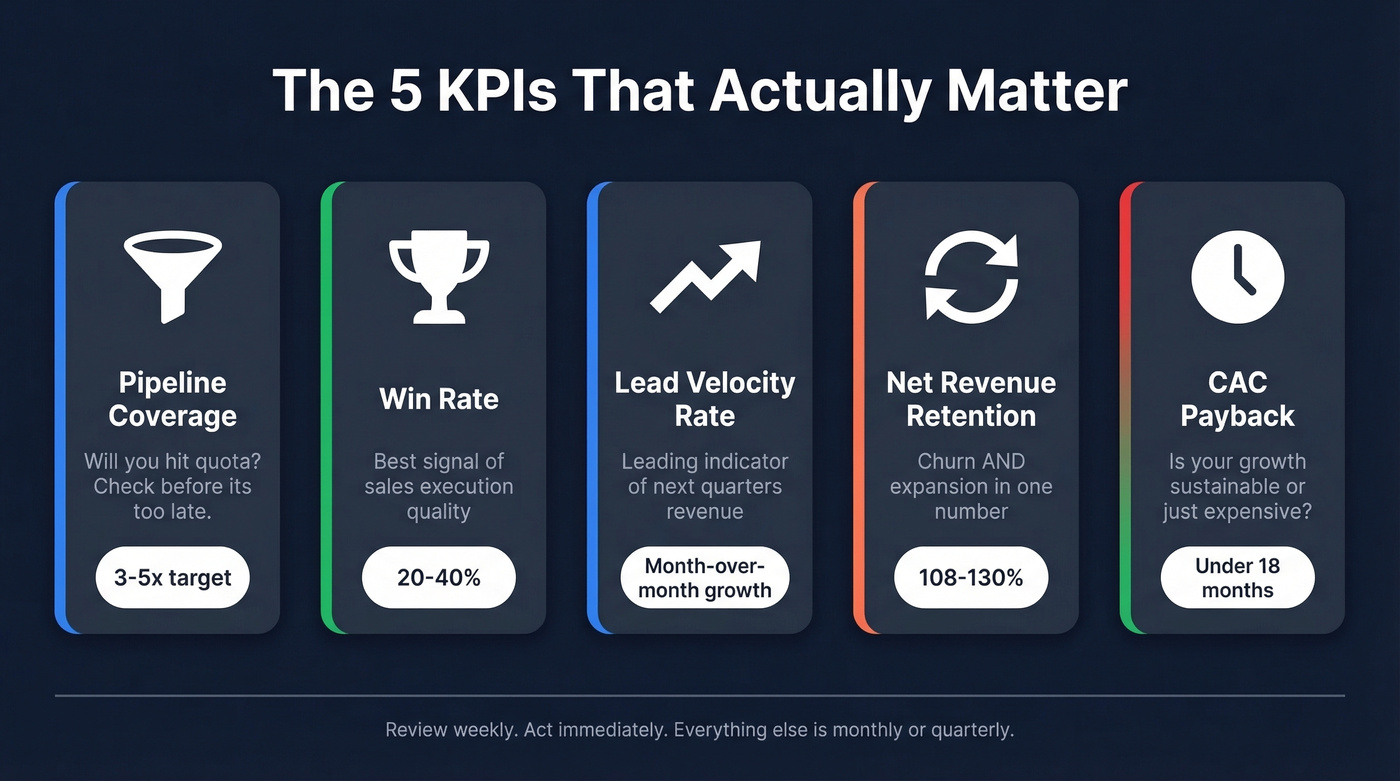
- Pipeline coverage - tells you if you'll hit quota before it's too late to fix
- Win rate - one of the best signals of sales execution quality
- Lead velocity rate (LVR) - a leading indicator of next quarter's revenue
- Net revenue retention (NRR) - captures churn AND expansion in one number
- CAC payback - tells you if your growth is sustainable or just expensive
Most other metrics belong in a monthly or quarterly review. Let's break each one down.
The KPI Operating System
Most sales dashboards are graveyards. Thirty metrics nobody opens, updated weekly by an ops person who could be doing something useful. We've audited dozens of these dashboards across our customer base, and the pattern is always the same: too many numbers, not enough action.
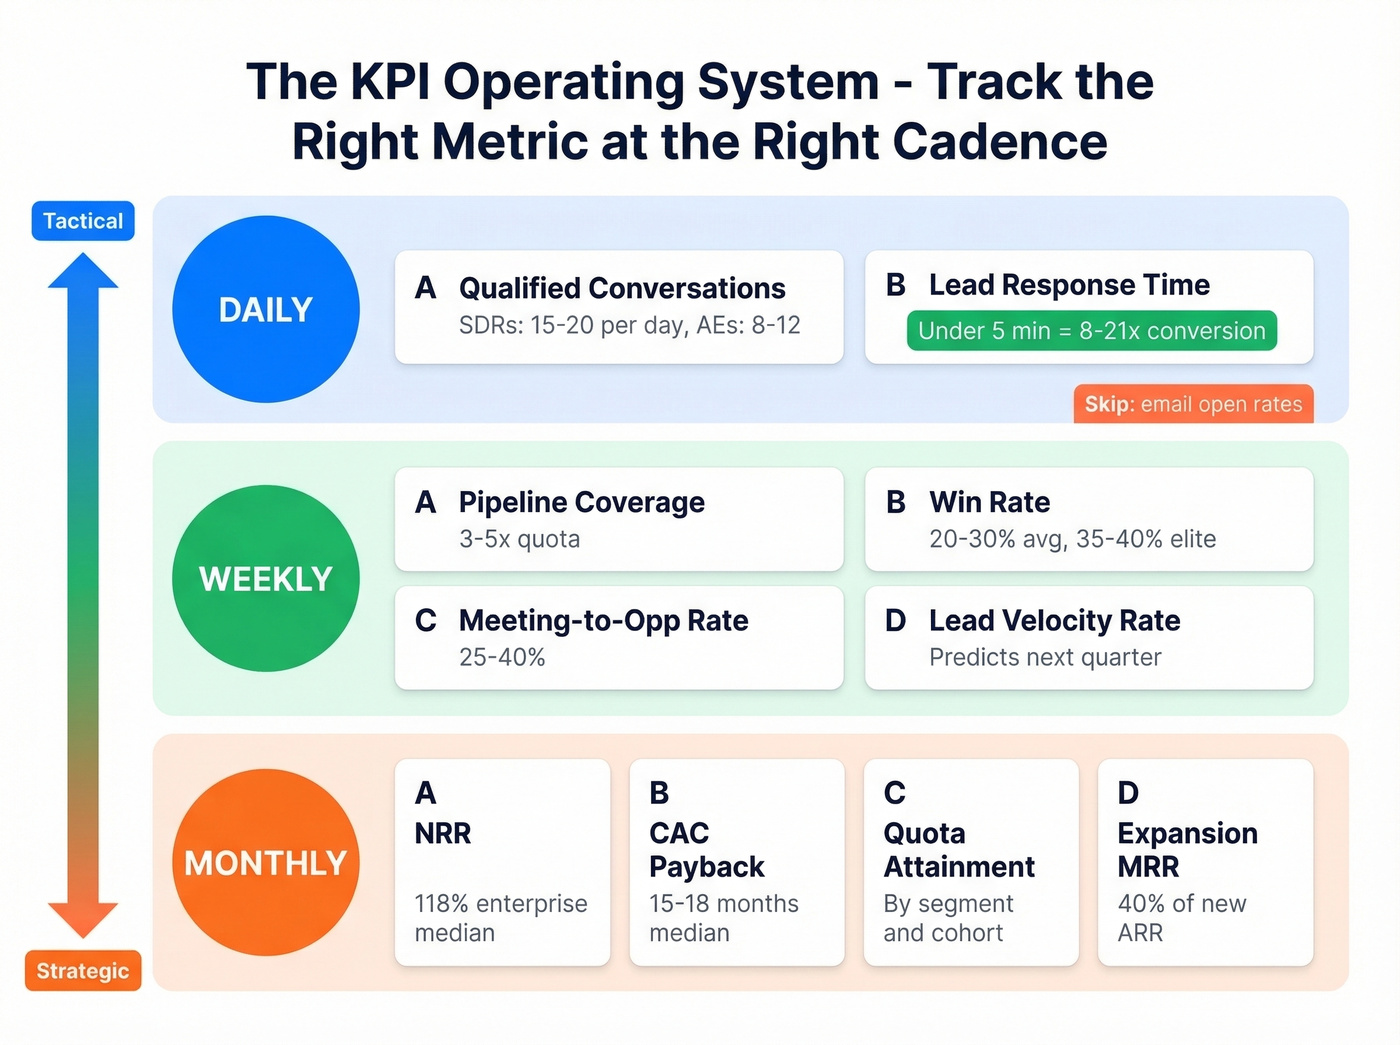
Stop tracking 15 things. Track five you act on at the right cadence.
Daily: Activity Metrics
Track qualified conversations, not raw dials. SDRs should hit 15-20 qualified conversations per day; AEs should target 8-12.
The daily metric that actually moves revenue is lead response time. Responding in under five minutes produces 8-21x higher conversion rates, and 35-50% of deals go to the first responder. If your team isn't measuring speed-to-lead, you're leaving pipeline on the table every single day.
Skip daily email open rate tracking. It's noisy, unreliable with privacy changes, and doesn't predict revenue.
Weekly: Performance Signals
Pipeline coverage is your early warning system. The minimum is 3x your quota target. If your win rate sits below 30%, you need 4-5x. We've seen teams celebrate "strong pipeline" at 2.5x and then miss by 30% - it happens more often than anyone wants to admit.
Win rate benchmarks: 20-30% is average, 35-40% is best-in-class. Above 40%? You're either exceptional or your pipeline is too conservative. Check whether reps are sandbagging to inflate the number.
Meeting-to-opportunity conversion should land between 25-40%. Sales cycle length is trending longer across the board - the median B2B SaaS cycle is now 84 days, up 22% since 2022, with 6.8 stakeholders involved per deal. Two tactical stats worth pinning to your team Slack: multi-threading across 3+ contacts closes deals 2.4x faster, and proposals sent within 24 hours close 35% faster. Those aren't marginal gains. They're structural advantages.
LVR deserves special attention. It measures the growth rate of qualified leads month over month. ARR tells you where you've been. LVR tells you where you're going. Among all the SaaS sales metrics you could track weekly, LVR is the one most likely to predict whether next quarter's number is in reach.
Monthly/Quarterly: Strategic Metrics
MRR and ARR are table stakes. The metric that deserves the most attention during monthly reviews is NRR, because it captures both retention and expansion in a single number. A company with $100K MRR that loses $5K to churn but gains $15K in expansion has 110% NRR - that's healthy growth even with customer losses. A company with 2% logo churn but 95% NRR is slowly dying. Companies with NRR above 120% see 2.3x higher valuations, which is why investors weight this metric so heavily.
CAC payback sits at a median of 15-18 months across B2B SaaS, with average CAC around $1,200 ranging from roughly $100 for self-serve to $5,000+ for enterprise. Elite companies get below 12 months. If yours is above 24, your unit economics don't work at scale. LTV:CAC should be 3:1 minimum, with top performers exceeding 4:1.
Quota attainment rounds out the quarterly view. With only 41% of software reps hitting target, tracking attainment by segment and cohort reveals whether the problem is pipeline, enablement, or territory design.
Expansion MRR is one of the metrics boards care about most right now. The median SaaS company generates about 40% of new ARR from expansion. Below 30% is a warning sign that your product isn't growing inside accounts - and that tends to show up later as a retention problem.
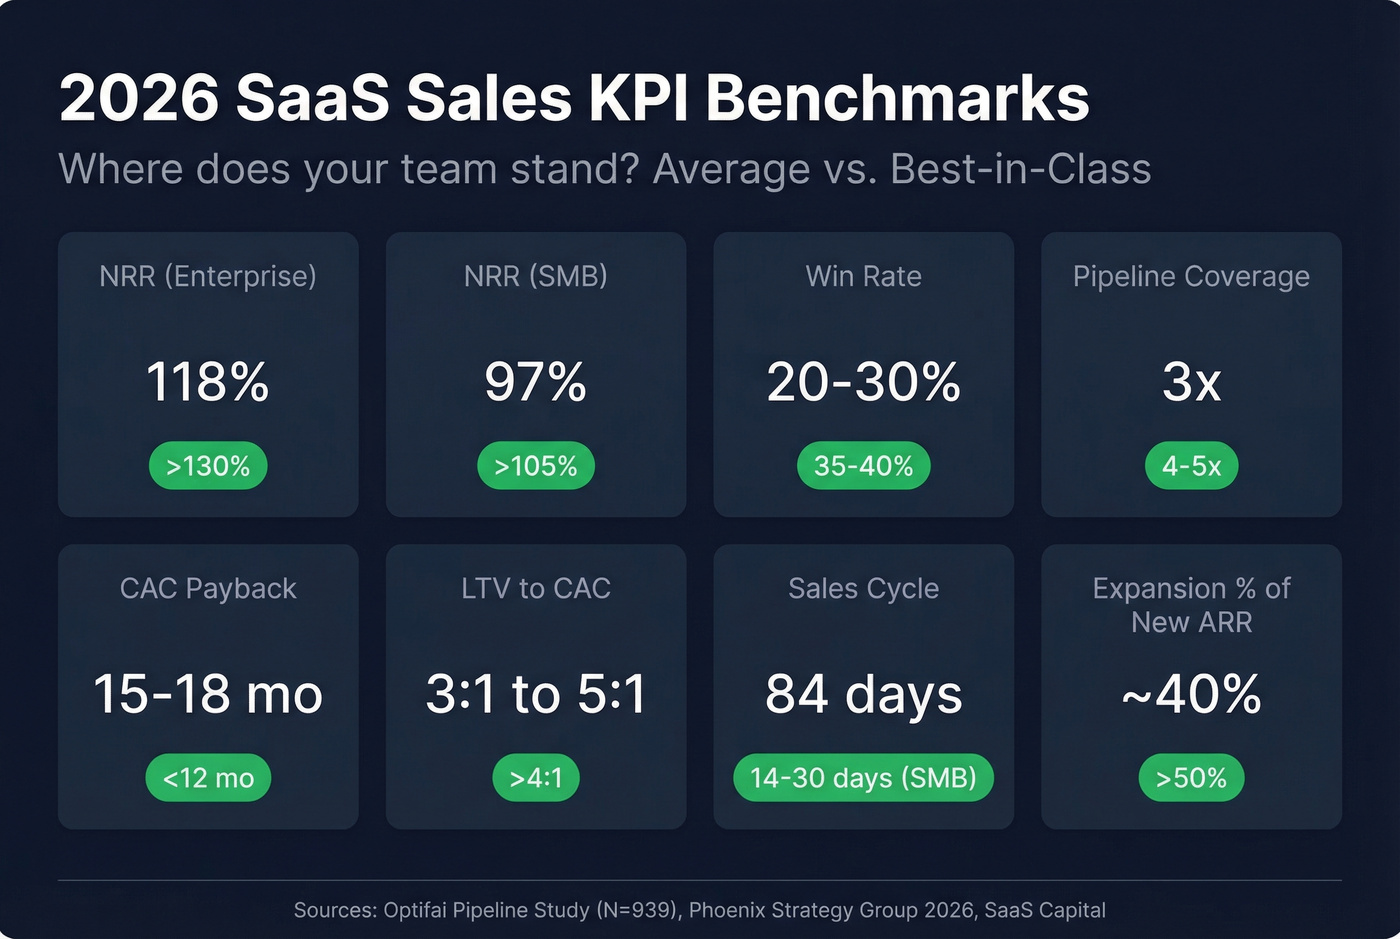
2026 Benchmark Cheat Sheet
Use this as your "are we healthy?" reference. Benchmarks draw from the Optifai Pipeline Study (N=939), Phoenix Strategy Group's 2026 analysis, and SaaS Capital's retention data.
| KPI | Average / Median | Best-in-Class |
|---|---|---|
| NRR (Enterprise) | 118% | >130% |
| NRR (Mid-market) | 108% | >120% |
| NRR (SMB) | 97% | >105% |
| CAC Payback | 15-18 months | <12 months |
| LTV:CAC | 3:1-5:1 | >4:1 |
| Win Rate | 20-30% | 35-40% |
| Pipeline Coverage | 3x | 4-5x (if win rate is low) |
| Sales Cycle | 84 days (median) | 14-30 days (SMB) |
| Revenue Growth | 26% (down from 47% in 2024) | 60%+ (<$10M ARR) |
| Expansion % of New ARR | ~40% | >50% |
Sales cycle length varies dramatically by deal size. Here's the breakdown from Focus Digital:
| ACV Range | Avg. Days |
|---|---|
| <$1K | 25 |
| $1K-$5K | 40 |
| $5K-$10K | 55 |
| $10K-$50K | 75 |
| $50K-$100K | 120 |
| $100K-$250K | 170 |
| $250K-$500K | 220 |
| >$500K | 270 |
For stage-by-stage benchmarks, Insight Partners' ScaleUp report segments by ARR band and sales motion across 300+ companies - worth downloading if you're building a board deck.
Pipeline coverage only matters if the contacts in your pipeline are real. Teams using Prospeo see bounce rates drop from 35% to under 4% - which means your 3x coverage actually converts instead of evaporating at commit stage.
Stop inflating pipeline with bad data. Start with 98% verified emails.
KPIs by GTM Motion
A PLG company obsessing over MQL-to-SQL conversion is wasting time. A sales-led enterprise team ignoring activation rate is missing the point if they've added a self-serve tier.
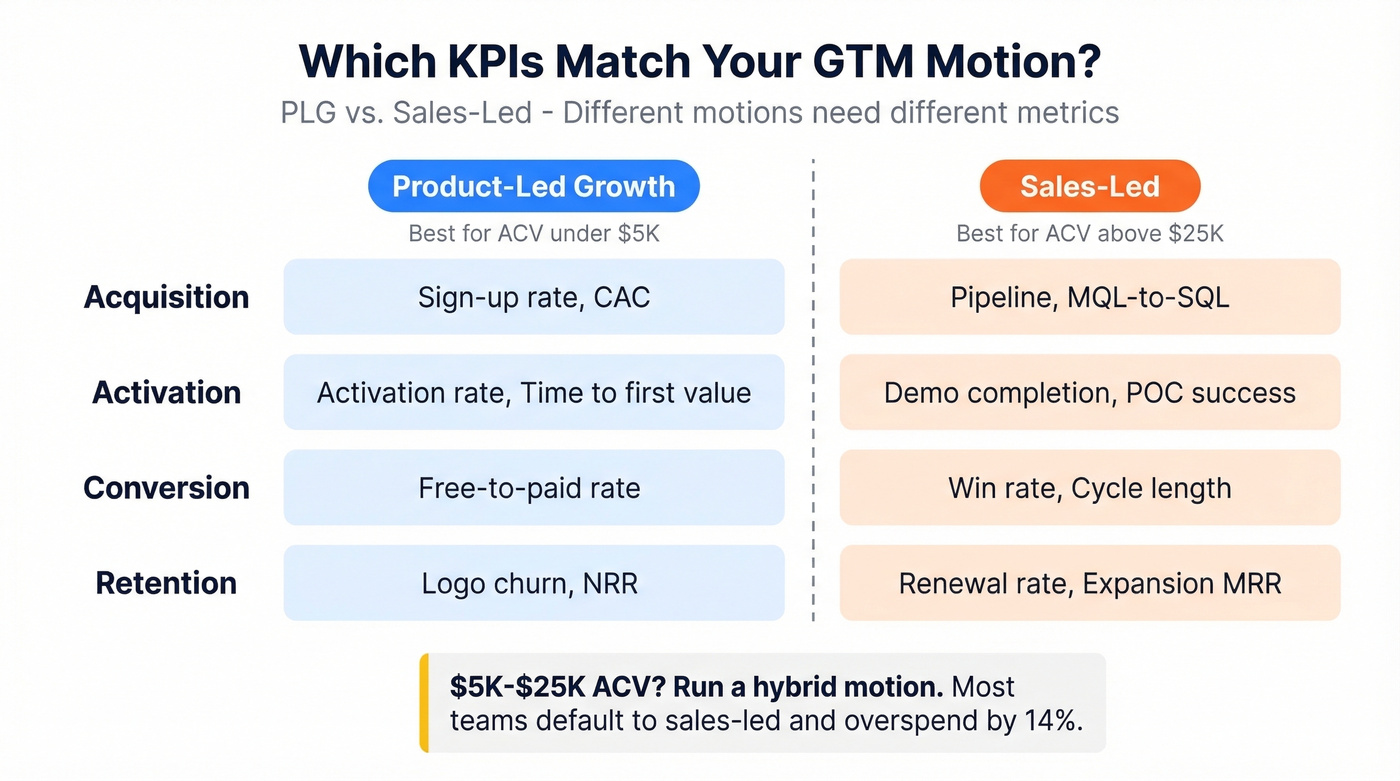
| Stage | PLG | Sales-Led |
|---|---|---|
| Acquisition | Sign-up rate, CAC | Pipeline, MQL-to-SQL |
| Activation | Activation rate, TTFV | Demo completion, POC |
| Conversion | Free-to-paid | Win rate, cycle length |
| Retention | Logo churn, NRR | Renewal rate, expansion |
Here's the thing: most teams with deal sizes between $5K and $25K should run a hybrid motion, but they default to sales-led because it feels more controllable. That's a $2-in-S&M-for-every-$1-of-new-ARR decision - up 14% since 2024. Under $5K ACV, product-led wins. Above $25K with multi-stakeholder buying committees, you need sales-led. Picking the wrong motion for your price point makes that ratio even worse.
Common KPI Mistakes
The most common pushback we hear from sales leaders: "But my board wants to see 20 metrics." Show them 20 metrics quarterly. Act on five weekly.
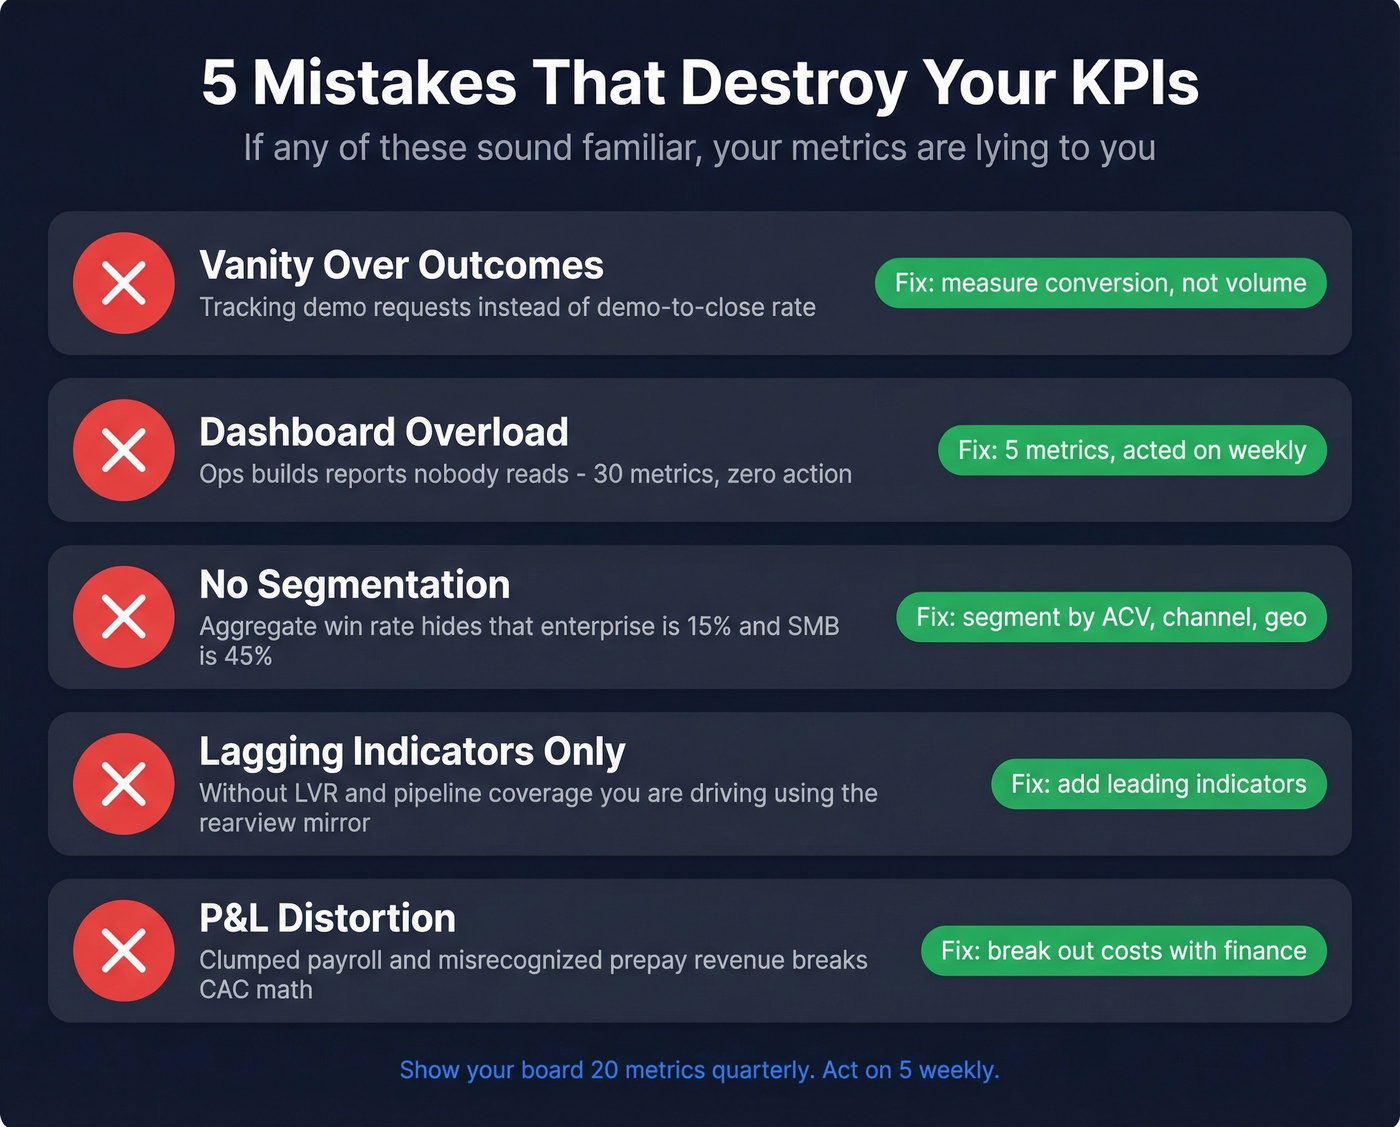
Five patterns that destroy KPI usefulness:
Vanity over outcomes. Track demo-to-close rate, not demo requests. The consensus on r/sales is that demo request volume is one of the most misleading metrics in SaaS - it looks great in a slide deck and means almost nothing for revenue.
Dashboard overload. If ops spends more time building reports than anyone spends reading them, you have a process problem, not a data problem.
No segmentation. Aggregate win rate hides that enterprise closes at 15% while SMB closes at 45%. Segment by ACV, channel, and geo. Always.
Lagging indicators only. Without LVR and pipeline coverage, you're driving by looking in the rearview mirror. The best SaaS sales KPIs for growth are always forward-looking.
Condensed P&L distortion. Clumping payroll costs and misrecognizing annual prepay revenue distorts your CAC and payback calculations before you even start tracking. If your finance team isn't breaking these out, your KPIs are built on sand.
Data Quality: The KPI Multiplier
Every KPI downstream of your prospecting data is distorted when contact data is bad. If your bounce rate is above 4%, your CAC is inflated by wasted outreach, your conversion rates are deflated by emails that never arrived, and your pipeline coverage is fiction.
This is where we've seen the biggest overnight improvements in our customers' numbers. Meritt's bounce rate dropped from 35% to under 4% after switching to Prospeo's 98% verified email data, and their pipeline tripled to $300K/week. That's not a KPI improvement - it's a KPI correction. The underlying sales motion didn't change. The data feeding it did.
Skip this section if your bounce rates are already under 3% and your connect rates are healthy. But if you're running outbound on stale data from a provider that refreshes every six weeks, every metric in this article is going to look worse than it should.
If you're diagnosing deliverability issues, start with bounce rate and work backward through your email deliverability setup.
Multi-threading closes deals 2.4x faster, but only if you can reach all 6.8 stakeholders. Prospeo gives you verified emails and direct dials across 300M+ profiles - so your reps connect with every buyer in the room, not just the one who replied to the first email.
Hit your KPIs by reaching every decision-maker, not just one.
FAQ
Which SaaS sales KPIs matter most?
NRR for companies past $5M ARR - it captures churn and expansion in one number. Enterprise NRR benchmarks sit at 118% median, mid-market at 108%, SMB at 97%. Pre-$5M, focus on conversion rate and sales cycle length instead.
How many metrics should a sales team track?
Five to seven, reviewed at different cadences - daily activity metrics, weekly performance signals, monthly strategic numbers. Tracking 30 metrics on a dashboard nobody opens is worse than tracking five you act on every Monday.
How do I improve CAC without cutting spend?
Fix data quality first - every bounced email is money spent reaching nobody. Then optimize your channel mix: referral CAC runs about $150 versus LinkedIn Ads at over $2,000. The gap is enormous, and most teams underinvest in referral programs because they're harder to scale on a spreadsheet.
What pipeline coverage ratio should I target?
Maintain at least 3x your quota in qualified pipeline. If your win rate is below 30%, push to 4-5x. Teams that celebrate "strong pipeline" at 2.5x typically miss their number by 25-30% at quarter end.