Lead Generation Metrics That Actually Matter (With Real Benchmarks)
Most lead generation metrics guides read like a glossary someone copied from a marketing textbook. They define "MQL" and "CPL," pat you on the back, and send you off with zero context for what good actually looks like. That's not useful when you're trying to justify budget or figure out why pipeline stalled.
The average B2B buying cycle runs 10.1 months, and the winning vendor lands on the buyer's Day One shortlist 95% of the time. Your leads aren't converting slowly because your nurture sequence needs a better subject line - they're converting slowly because B2B buying is a long game, and most metrics dashboards aren't built to reflect that. Lead generation is projected to be a $295B industry by 2027, yet most teams still can't tell you their cost per SQL.
What follows are the metrics that actually predict revenue, with real benchmarks by industry and channel, formulas you can plug in today, and the failure modes that make your numbers lie.
The 5 KPIs Worth Tracking
If you only track five metrics, track these:
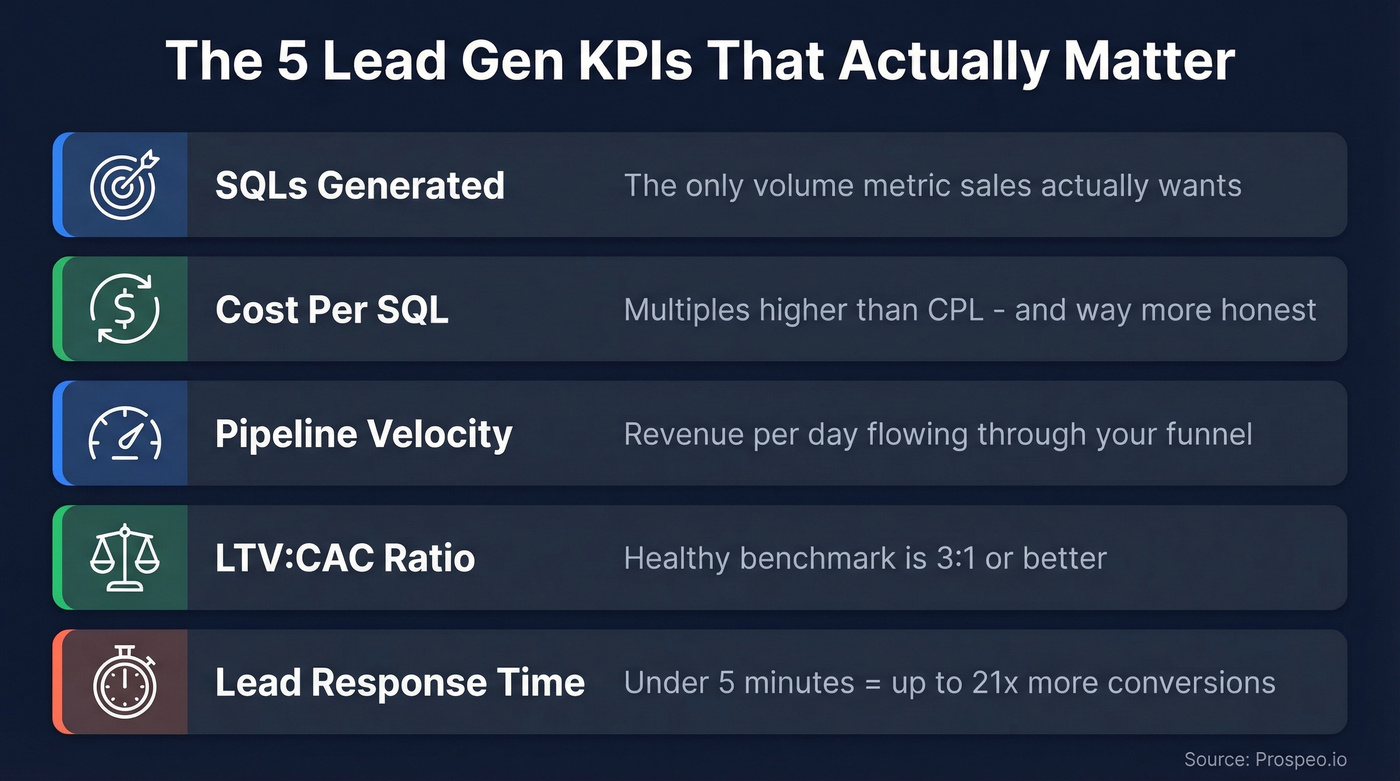
- SQLs generated - the only volume metric that reflects what sales actually wants to work.
- Cost per SQL - because CPL alone tells you nothing about quality.
- Pipeline velocity - revenue per day flowing through your funnel, not just deal count.
- LTV:CAC ratio - the sustainability check. Below 3:1, you're buying growth you can't afford.
- Lead response time - responding within 5 minutes boosts conversions up to 21x. Most teams don't even measure this.
Start here, expand later. Everything below gives you the benchmarks and formulas to make each one actionable.
Pipeline Contribution Metrics
MQLs vs. SQLs
The gap between MQLs and SQLs is where most marketing-sales friction lives. A healthy Lead-to-MQL conversion rate runs 5-15%, and MQL-to-SQL conversion sits between 13-27%. If your MQL-to-SQL rate is below 13%, your MQL definition is broken. You're handing sales leads they don't want.
If you want a deeper set of stage-by-stage benchmarks, compare against the average B2B lead conversion rate by funnel step.
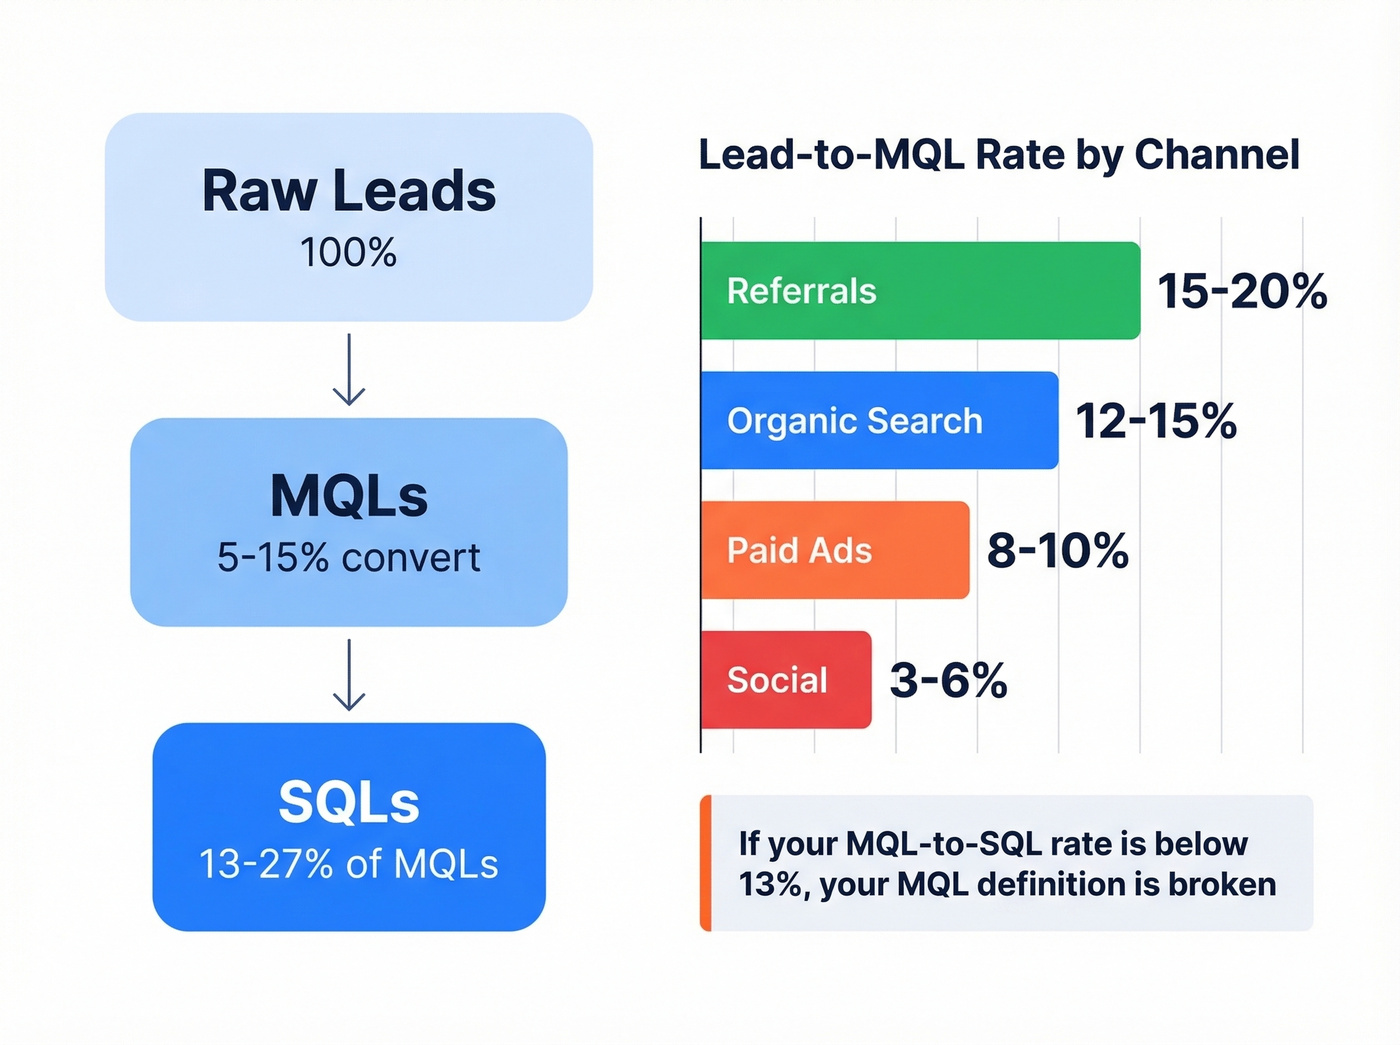
Conversion rates vary dramatically by source. Organic search leads convert to MQL at 12-15%, referrals at 15-20%, and social sits down at 3-6%. Paid ads land somewhere in the 8-10% range. These aren't just interesting data points - they should drive your budget allocation. A channel producing high MQL volume with a 4% MQL-to-SQL rate is a money pit dressed up as a growth engine, and that's exactly why your analytics need to be segmented by channel from day one.
Lead-to-Customer Conversion Rate
This is the metric that connects marketing activity to revenue. Deal win rates across B2B range from 15-50% depending on industry, deal complexity, and sales cycle length. The spread is enormous, which is exactly why you need to benchmark against your own vertical rather than some generic "average."
HubSpot's 2026 State of Marketing Report ranks lead-to-customer conversion as the #2 KPI marketers care about, behind only overall ROI. That's a shift from the MQL-obsessed era, and it's the right one. Meanwhile, 61% of marketers say generating quality leads is their top challenge, yet most dashboards still prioritize quantity metrics. The disconnect is staggering.
Lead Generation ROI
The formula is straightforward: (Revenue Generated - Cost of Lead Generation) / Cost of Lead Generation x 100.
A worked example from MarketJoy: invest $10,000/month, close $40,000 in new revenue, and your ROI is 300%. Three dollars earned for every one spent. The mistake most teams make is underloading the cost side. Your real lead gen cost includes ad spend, agency fees, tools, SDR salaries, content production, and automation platform fees. Leave any of those out and you're flattering your ROI number.
Cost Efficiency Metrics
Cost Per Lead (And Why It's Overrated Alone)
CPL = Total Marketing Spend / Number of Leads Generated. Simple formula, dangerously incomplete metric.
The blended B2B SaaS CPL runs $237 - $310 for paid channels, $164 for organic. But a $50 CPL means nothing if those leads never convert. And your real CPL is spend divided by leads that actually receive your outreach. If your bounce rate is high, fix your data first. Tools like Prospeo verify emails before you send, so your CPL reflects leads reached, not leads attempted.
If you're troubleshooting deliverability, start with email bounce rate benchmarks and root causes.
CPL Benchmarks by Industry
Your CPL should be compared against your vertical, not some cross-industry average. Deal size and buyer complexity drive massive variation.
| Industry | Avg CPL |
|---|---|
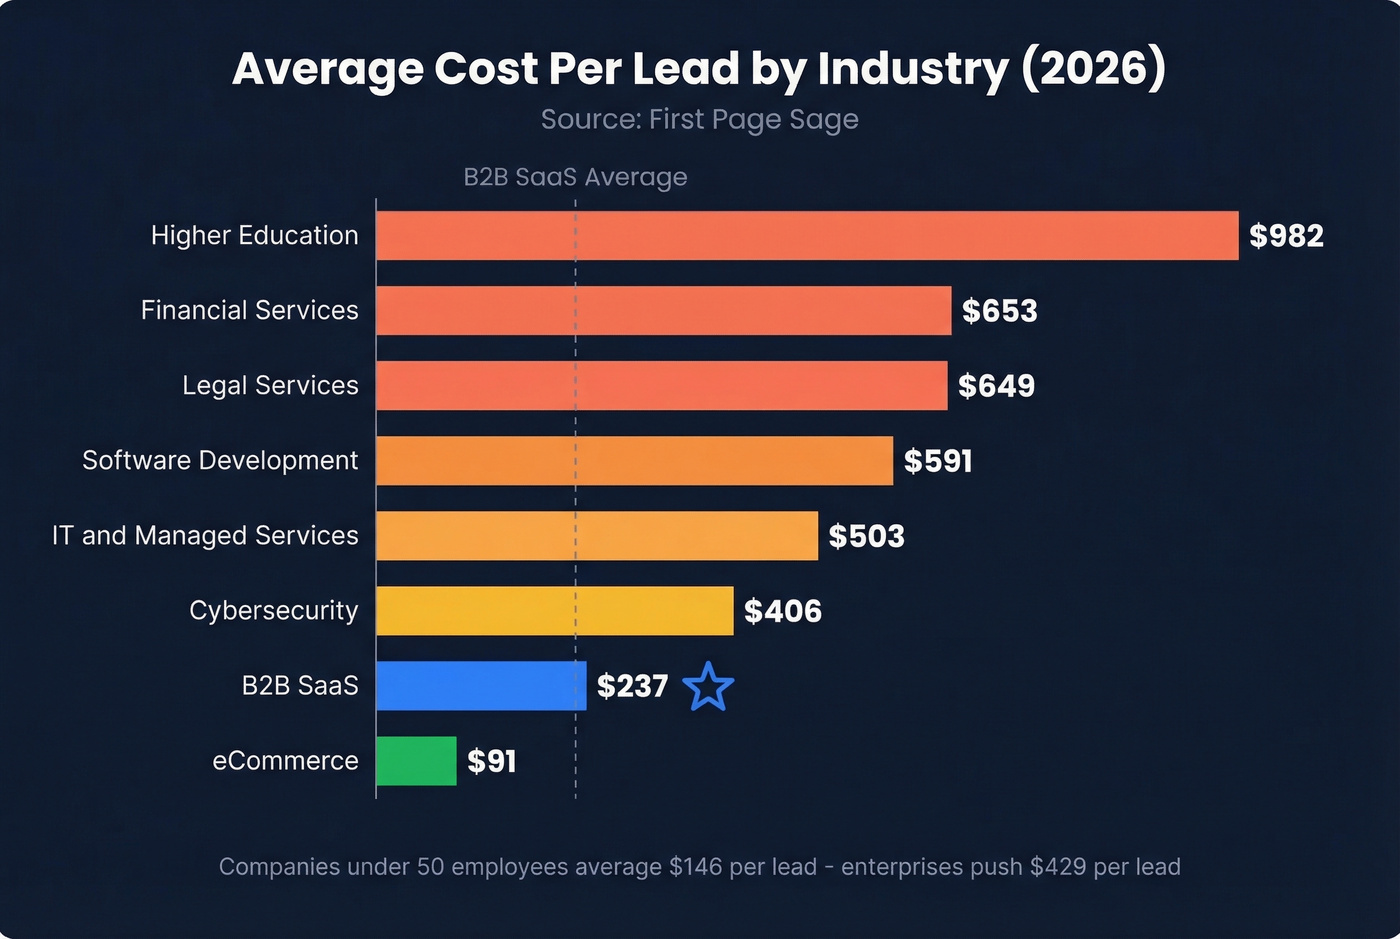
| eCommerce | $91 |
| B2B SaaS | $237 |
| Cybersecurity | $406 |
| IT & Managed Services | $503 |
| Software Development | $591 |
| Legal Services | $649 |
| Financial Services | $653 |
| Higher Education | $982 |
Data from First Page Sage's 2026 report. Company size matters too: organizations with fewer than 50 employees average $146/lead, while enterprises push $429/lead. Bigger companies pay more because they're targeting bigger buyers with longer sales cycles.
CPL Benchmarks by Channel
If you're not tracking CPL by channel, you're flying blind on budget allocation. The spread is massive.
| Channel | Avg CPL |
|---|---|
| Trade shows | $840 |
| PPC | $463 |
| LinkedIn ads | $408 |
| Cold calling | $300 |
| Webinars | $267 |
| Direct mail | $250 |
| Cold emails | $225 |
| SEO | $206 |
| Multi-channel prospecting | $188 |
| Facebook ads | $142 |
| Affiliate | $73 |
| Referrals | $25 |
Channel benchmarks from Sopro's latest update. Other sources cite significantly lower figures for SEO and webinars - the spread depends on whether you count only direct costs or fully loaded spend.
Look at the gap between trade shows at $840 and referrals at $25. That doesn't mean you should kill your events budget. Trade show leads often convert at higher rates and larger deal sizes. But you need to pair CPL with downstream conversion data before making allocation decisions.
If you're running outbound, it helps to map channel costs to a repeatable lead generation workflow so you can see where spend actually turns into SQLs.
CAC, LTV:CAC, and Cost per SQL
CAC includes everything CPL doesn't - sales team costs, demo infrastructure, proposal time, closing costs. It's the true cost of winning a customer, not just generating a lead.
The benchmark that matters most: LTV:CAC of 3:1 or better. Below that, you're spending too much to acquire customers relative to what they're worth. Above 5:1, you're likely underinvesting in growth - a 5:1+ ratio often means you've found product-market fit but aren't scaling spend to match demand.
Cost per SQL is the metric that actually predicts revenue, because it measures the cost of leads sales has accepted and is actively working. For platform-level context, Google Ads CPL averages $70.11 and LinkedIn Ads runs $110+. Those are top-of-funnel numbers - your cost per SQL will be multiples higher, and that's the number your CFO should care about.
To keep SQLs consistent across teams, align your qualification rules with a formal lead scoring model.
Your cost per SQL drops when your data is clean. Prospeo's 98% email accuracy and 5-step verification mean fewer bounces, more replies, and a CPL that reflects leads reached - not leads wasted. At $0.01 per email, your cost efficiency metrics finally tell the truth.
Stop inflating your CPL with bad data. Start with verified contacts.
Funnel Velocity Metrics
Pipeline Velocity Formula
This tells you how fast money moves through your funnel:
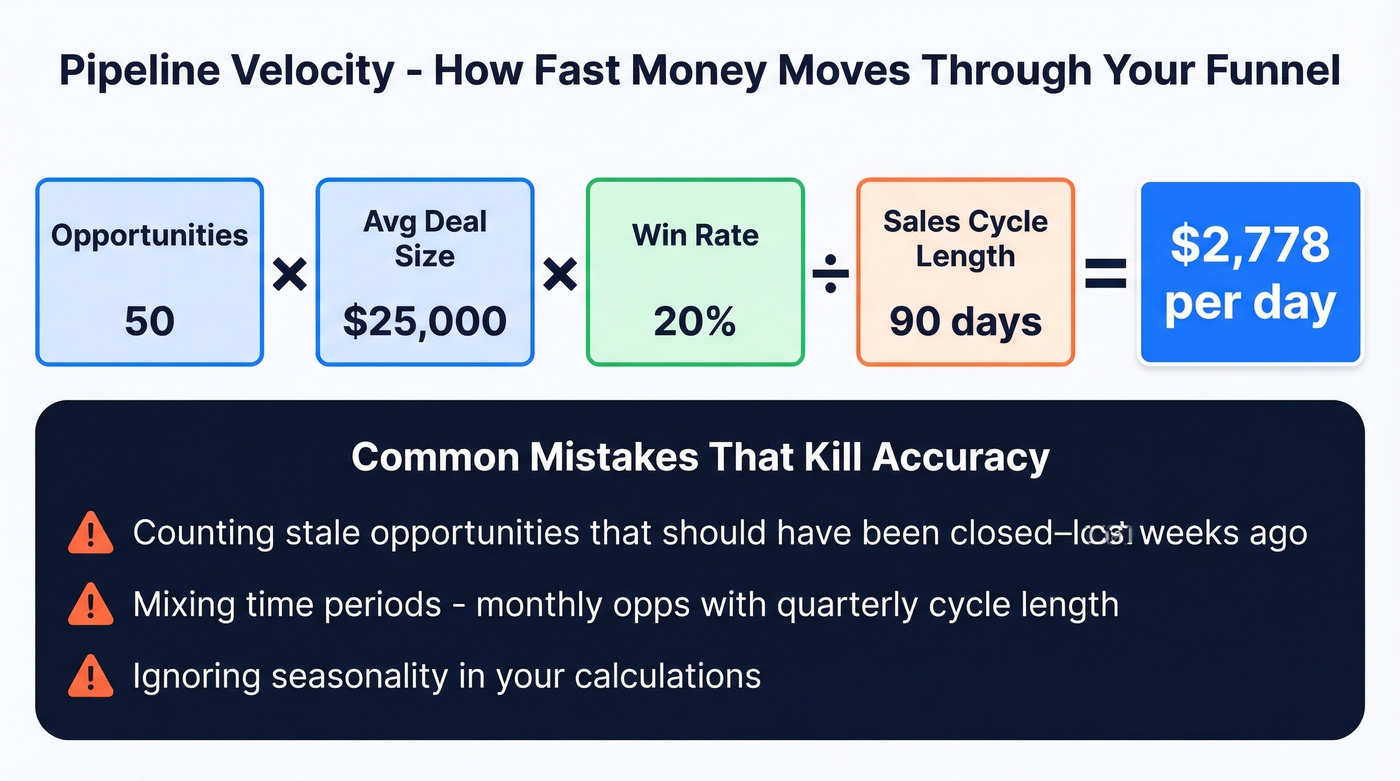
Pipeline velocity = (Opportunities x Avg Deal Size x Win Rate) / Sales Cycle Length
Worked example: 50 opportunities x $25,000 average deal x 20% win rate / 90-day sales cycle = $2,778 per day in pipeline value.
The mistakes that kill this metric's accuracy are counting stale opportunities that should've been closed-lost weeks ago, mixing time periods (monthly opps with quarterly cycle length), and ignoring seasonality. Clean your CRM before you trust this number.
If you want a broader view of what "healthy" looks like, compare against pipeline health indicators beyond velocity alone.
Lead Response Time
Here's the thing: this is the most underrated metric in B2B. Responding within 5 minutes boosts conversions up to 21x compared to responding after 30 minutes. Yet most teams don't track it at all.
Build an SLA framework. Inbound demo requests get a 5-minute SLA. Content downloads get 2 hours. Webinar attendees get same-day follow-up. Then measure compliance weekly. The teams that treat response time as a hard operational metric consistently outperform those that treat it as a suggestion - we've seen this pattern across dozens of sales orgs we work with.
If you need a practical system for what happens after the first touch, use these sales follow-up templates to standardize speed and messaging.
Time to MQL and Time to SQL
These metrics measure how long it takes a raw lead to qualify through each stage. They're useful for diagnosing bottlenecks, but keep them in context. If your time-to-SQL is 3 weeks but your sales cycle is 10 months, the bottleneck isn't lead gen. It's everything that happens after.
Why Your Metrics Are Lying
Sales rejected 60% of your MQLs last month and you're still reporting "lead volume up 40% QoQ" to the board. Sound familiar?
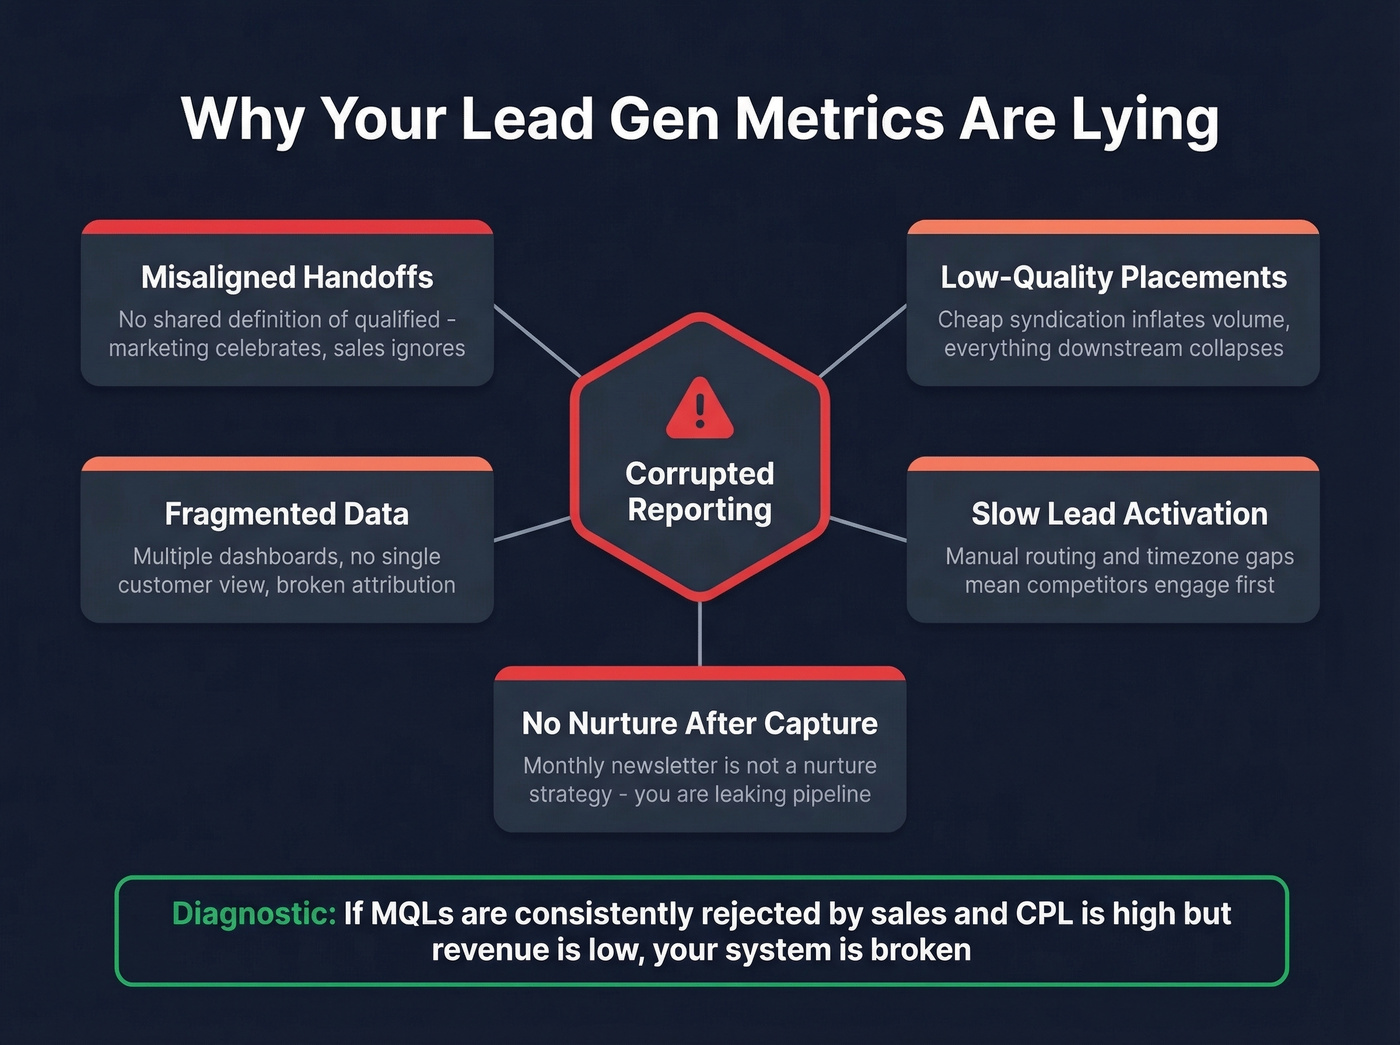
Let's be honest about what B2B practitioners actually track. Browse r/sales or any RevOps Slack community and you'll hear the same shortlist: SQLs, cost per opportunity, speed-to-lead, and pipeline created. The textbook metrics - impressions, MQLs, total leads - rarely come up. There's a reason for that. Here are the five systemic failure modes that corrupt lead gen reporting:
Misaligned marketing-to-sales handoffs. No shared definition of "qualified." No SLAs on follow-up timing. Marketing celebrates MQL volume while sales ignores half the leads. In our experience, this handoff is where the majority of metric corruption starts.
Low-quality placements inflating volume. Cheap content syndication or broad-match PPC campaigns that generate form fills from people who'll never buy. Top-of-funnel looks great; everything downstream collapses.
Fragmented data and broken attribution. Multiple dashboards, no single customer view, and nobody agrees on which touch gets credit. Without unified analytics, you're making decisions on partial information. We've run two attribution models side by side for 90 days - first-touch and W-shaped - and the results told us more about our funnel than any single model ever had.
Slow lead activation. Manual routing, timezone gaps, and approval chains mean your competitors engage the buyer first.
No nurture after capture. Buyers rarely convert on first touch. If your only post-capture motion is "add to monthly newsletter," you're leaking pipeline.
The diagnostic signals are clear: MQLs consistently rejected by sales, high CPL paired with low revenue, and long handoff delays. If you see two or more, your metrics aren't wrong - your system is.
If you're rebuilding the handoff, start by tightening lead status definitions so marketing and sales report the same funnel reality.
Data Quality: The Metric Multiplier
Every metric above assumes your contact data is accurate. Bad data doesn't just waste money - it corrupts every number in your dashboard. Inflated CPL because half your emails bounced. Deflated conversion rates because leads never received your outreach. Pipeline velocity calculations built on contacts that don't exist.
Bounce rate is the canary metric. If it's elevated, your lead generation metrics are lying to you in ways that are hard to detect and expensive to ignore.
If your email bounce rate exceeds 10%, stop optimizing your funnel and fix your data. No amount of lead scoring sophistication or attribution modeling matters when a chunk of your outreach never lands. Snyk ran a cleanup with 50 AEs and saw AE-sourced pipeline jump 180% after fixing bounce rate from 35-40% to under 5%. When Meritt made a similar fix, their pipeline tripled from $100K to $300K/week and bounce rate dropped from 35% to under 4%. Prospeo's 98% email accuracy and 7-day data refresh cycle address this directly - when the data layer is clean, every metric downstream improves automatically.
If you're doing enrichment at scale, consider how data enrichment services can reduce duplicates and missing fields before they hit your CRM.
Pipeline velocity depends on reaching real buyers fast. Prospeo gives you 300M+ verified profiles with 125M+ direct dials, refreshed every 7 days - not the 6-week-old data that tanks your lead-to-customer conversion rate and flatters your MQL numbers.
Fresh data converts faster. Build pipeline that actually moves.
Building a Lead Gen Dashboard
The recommended funnel layout is simple: Leads - MQL - SQL - Opportunities - Wins, with conversion rates between each stage and CPL/CAC tracked at every level.
Different stakeholders need different views. Founders use the dashboard for resource allocation - which channels deserve more budget. CMOs use it to prove channel value and justify headcount. Sales leaders use it for forecasting and coaching - which reps are converting SQLs and which aren't.
Track everything in HubSpot or Salesforce with GA4 connected to your CRM. Segment by channel and campaign - blended numbers hide the signals that matter. One effective approach groups metrics into pipeline contribution and channel efficiency clusters, which keeps the dashboard focused rather than sprawling.
If you need a clean structure for stage metrics and definitions, start from a B2B sales funnel template and adapt it to your CRM.
Skip the AI lead scoring hype if your data foundation isn't solid yet. But for teams with clean CRM data, AI-assisted qualification and routing can produce up to 50% more sales-ready leads and 60% lower CAC. If you're already there, it's worth testing. If you're not, fix the data first.
FAQ
What's the most important lead generation metric?
SQLs generated. They represent leads sales actually wants to work. MQLs measure marketing activity; SQLs measure pipeline reality. Pair SQLs with cost per SQL and pipeline velocity for a complete picture of whether your efforts translate into revenue.
What's a good cost per lead in B2B?
B2B SaaS averages $237, legal services $649, and eCommerce $91. Break it down by channel too - SEO leads cost ~$206 while trade show leads run ~$840. A high CPL with strong downstream conversion consistently beats a low CPL that generates junk leads.
How do you measure lead generation effectively?
Track KPIs at every funnel stage, not just top-of-funnel volume. Start with SQLs, cost per SQL, and pipeline velocity, then layer in LTV:CAC and lead response time. Segment everything by channel so you can shift budget toward what actually converts to revenue.
How can you improve results without increasing budget?
Start with data quality. If your email bounce rate exceeds 10%, you're wasting spend on leads that never receive your message. Then optimize lead response time to under 5 minutes and tighten your MQL definition so sales stops rejecting half the leads marketing sends over.