The 6 Sales Forecast Models That Actually Work (With Formulas and Benchmarks)
It's Thursday afternoon. Your VP pings you for the Q3 forecast. You open the CRM, stare at a pipeline full of deals you haven't touched in weeks, and start doing math on vibes. You're not alone - 79% of sales orgs miss their forecast by more than 10%, and the gap almost always traces back to the same root cause: the wrong sales forecast model, fed by the wrong data.
Quick version:
- Best starting model for most B2B teams: Weighted pipeline
- Best for data-rich teams running lots of deals: Multivariate regression
- No historical data yet? Start with straight-line historical plus qualitative input from reps
What Is a Sales Forecast Model?
A sales forecast model is the method you use to predict future revenue - the math and logic behind the number, not the number itself. Different approaches suit different data maturity levels, deal volumes, and business types. Pick the wrong one and you'll be precise about the wrong number every quarter.
The 6 Models That Matter
Straight-Line Historical
Take last period's revenue, assume the same growth rate continues, and project forward. If you closed $500K last quarter with 8% growth, you'd forecast $540K next quarter.
It works best for stable, predictable businesses with enough revenue history to estimate a reliable growth rate. This is the simplest of the revenue forecasting models, and the limitation is obvious: it can't account for market shifts, new competitors, or changes in your go-to-market. Think of it as a baseline, not a strategy.
Moving Average
A moving average smooths out noise by averaging revenue over a rolling window - often 3, 6, or 12 periods. A shorter window reacts faster to trends; a longer window dampens volatility.
This model handles seasonal or cyclical revenue better than a raw trend line. If your revenue has seasonal patterns, a straight-line model will miss them entirely. Sum the last N periods, divide by N, and that's your forecast for the next period.
Weighted Pipeline
This is the model most B2B teams should start with.
Forecast = Σ (Deal Value x Stage Probability)
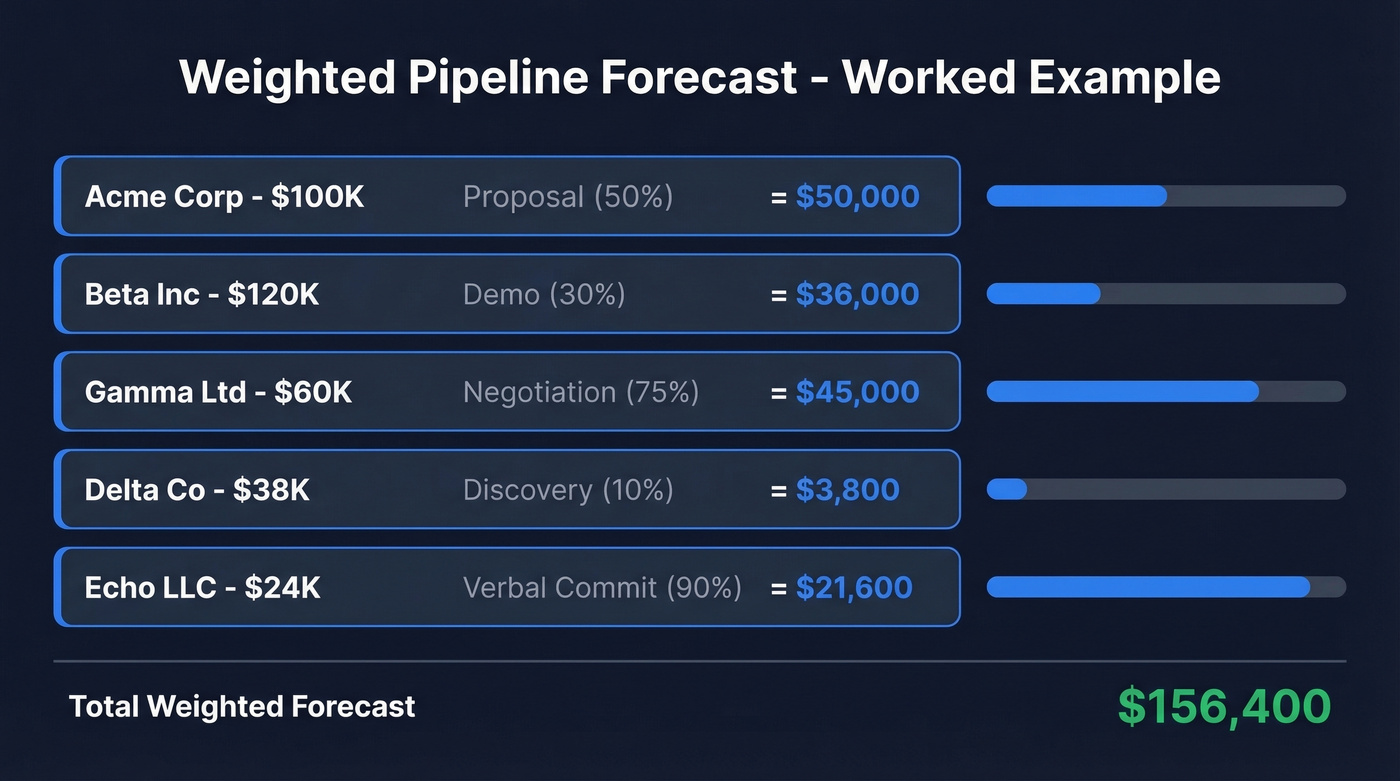
Here's a worked example using a common starting set of stage probabilities - Discovery 10%, Demo 30%, Proposal 50%, Negotiation 75%, Verbal Commit 90%:
| Deal | Value | Stage | Probability |
|---|---|---|---|
| Acme Corp | $100K | Proposal | 50% |
| Beta Inc | $120K | Demo | 30% |
| Gamma Ltd | $60K | Negotiation | 75% |
| Delta Co | $38K | Discovery | 10% |
| Echo LLC | $24K | Verbal Commit | 90% |
Your weighted forecast: ($100K x 0.50) + ($120K x 0.30) + ($60K x 0.75) + ($38K x 0.10) + ($24K x 0.90) = $50K + $36K + $45K + $3.8K + $21.6K = $156.4K.
Here's where most teams go wrong: they use default stage probabilities that haven't been calibrated in years.
The fix is simple. Every quarter, run this formula per stage:
Stage Probability = (Deals Won from Stage / Total Deals Reaching Stage) x 100
If 200 deals reached your Proposal stage last year and 90 eventually closed, your real Proposal probability is 45%, not the 50% your CRM defaulted to three years ago. We've seen teams shave 10+ percentage points off their forecast error just by running this calibration once. It takes an hour. There's no reason not to do it.
There are four ways to assign probabilities: stage-based automatic assignment, rep judgment overrides, AI/ML predictions, or a hybrid approach. We recommend hybrid - use calibrated stage probabilities as your baseline, let reps override with deal-specific context, and flag large discrepancies for manager review.
Pipeline coverage math matters too. If your target is $5M in bookings and you've got $2M in pipeline, you need $3M more. With a 7% historical win rate, that means you need $42.8M in total pipeline to hit the number. That's not a typo - it's why pipeline generation is a full-time job.
Sales Cycle Length
This model predicts close timing based on how long deals typically take to close, independent of what stage they're sitting in. If your average enterprise deal takes 90 days from first meeting to signature, a deal that started 60 days ago has roughly 30 days left - regardless of whether the CRM says "Demo" or "Proposal."
It pairs well with weighted pipeline. Use stage probabilities for the dollar amount and cycle length for the timing. Together, they answer both "how much" and "when."
Regression Analysis
Linear regression draws a line through your historical data and extends it forward. Multivariate regression is where it gets interesting - it factors in multiple signals simultaneously.
A concrete example: one RevOps team found that when a VP-level executive attended the second meeting, close rates jumped to 80%. Without that signal, they dropped to 20%. That's a 4x difference from a single variable that most weighted pipeline models ignore completely.
The "dark funnel" signals are even more revealing - repeated pricing page visits, engineers reading your documentation, prospects asking about you in private communities. Multivariate regression can weight all of these if you're tracking them. The catch: you typically need hundreds of historical deals with clean, multi-signal data to make it reliable. Below that, you're overfitting noise.
AI/ML-Assisted Forecasting
AI forecasting applies machine learning to your CRM data, weighting signals across hundreds of deals simultaneously. The Optifai benchmark puts AI/ML accuracy at ±8-15% variance - tighter than any manual method.
Here's my honest take: AI is overhyped for teams running fewer than 500 deals per quarter. The models need a solid history of clean CRM data to train on, and "clean" is doing a lot of heavy lifting in that sentence. Most CRMs are full of stale contacts, phantom deals, and stages that haven't been updated since the last QBR. AI doesn't fix dirty data - it amplifies it. Use it as a layer on top of a calibrated weighted pipeline, not as a replacement.
Model Comparison
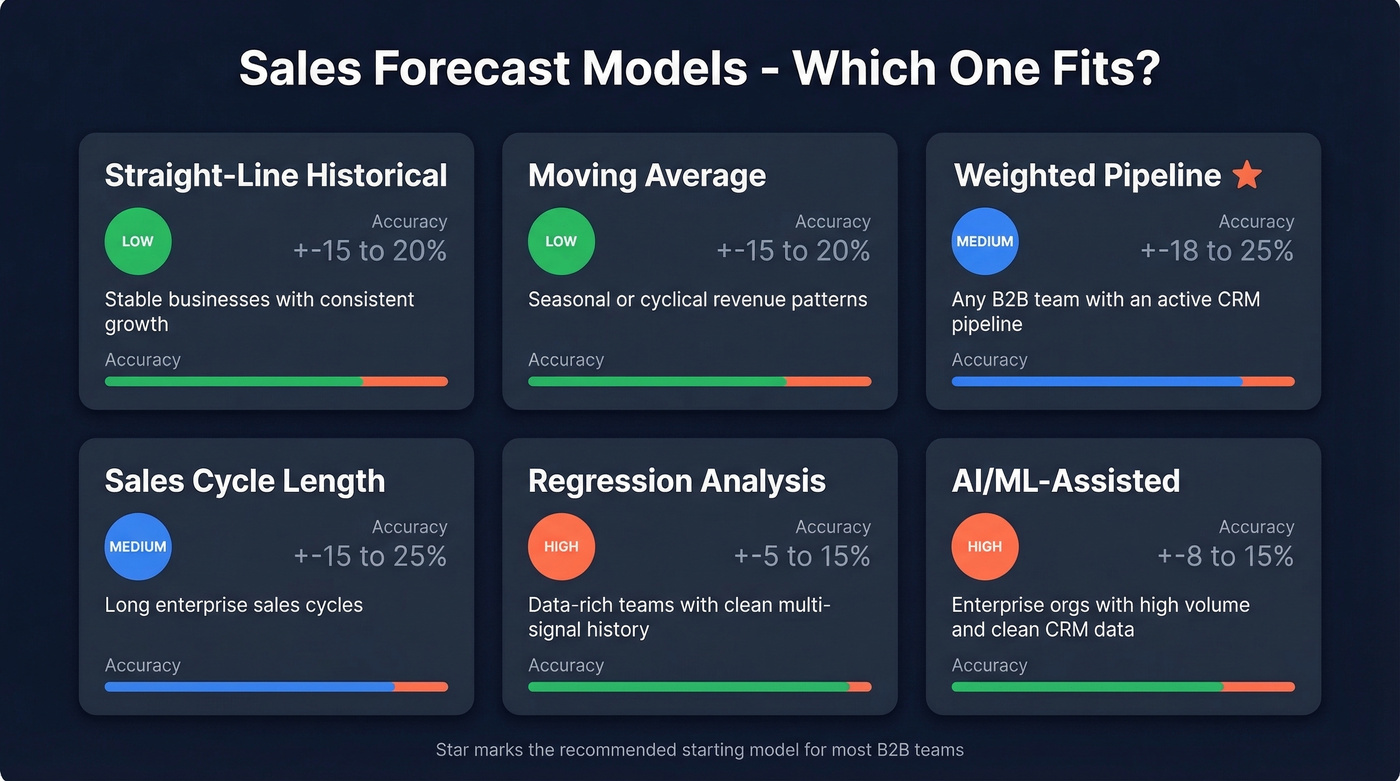
| Model | Best For | Min Data | Accuracy | Complexity |
|---|---|---|---|---|
| Straight-line | Stable businesses | Revenue history | ±15-20% | Low |
| Moving average | Seasonal patterns | Revenue history | ±15-20% | Low |
| Weighted pipeline ★ | Any B2B team with a CRM | Active pipeline | ±18-25% | Medium |
| Sales cycle length | Long sales cycles | Deal-duration history | ±15-25% | Medium |
| Regression | Data-rich teams | Clean multi-signal history | ±5-15% | High |
| AI/ML-assisted | Enterprise, clean CRM | High volume + history | ±8-15% | High |
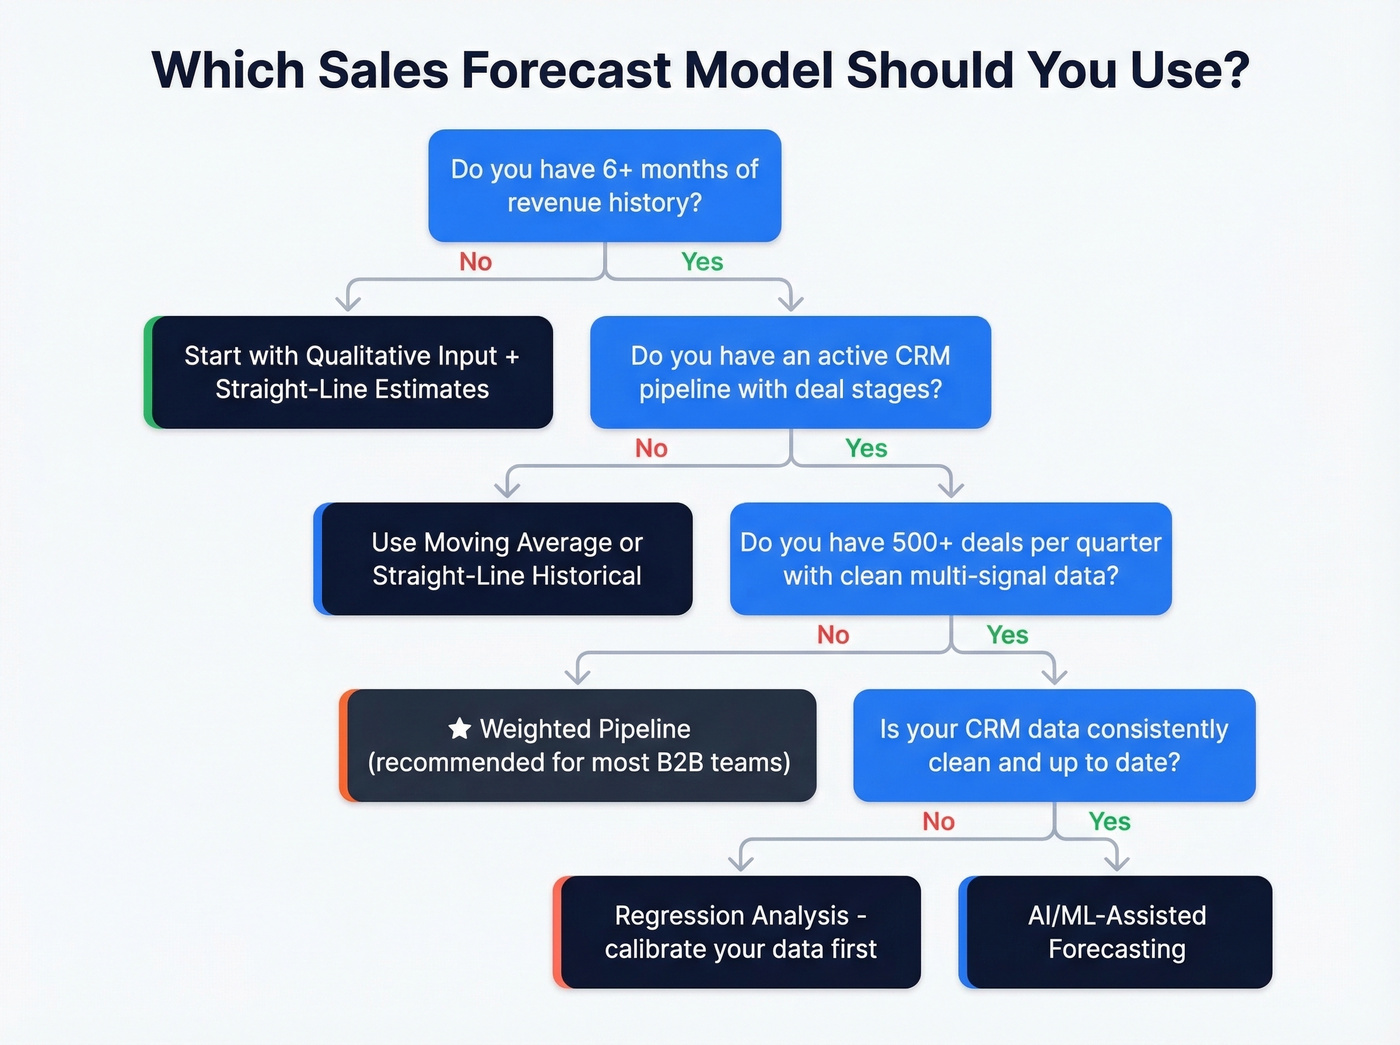
Which Model Fits Your Business
SaaS
SaaS forecasting lives and dies on cohort math. The waterfall structure: Starting MRR + New Bookings + Expansion - Churn = Ending MRR. A $100K MRR cohort with 5% monthly gross churn and no expansion declines to $53,944 by December. Add 2% monthly expansion and that same cohort lands at $74,036 - that delta is why NRR matters more than new bookings for mature SaaS companies. Benchmarkit's most recent data puts median NRR at 101%, with the 75th percentile at 110%.
Use weighted pipeline for new bookings and a cohort/waterfall model for existing revenue. Together, they give SaaS finance teams a complete picture of future cash flow.
Manufacturing
The CRM "closed-won" date and the revenue recognition date can be 120 days apart due to production schedules, shipping timelines, and inventory constraints. Layer your pipeline model with a production timeline overlay, or you'll forecast revenue that doesn't hit the P&L for another quarter. The dashboard gets even messier mid-year when H1 runs actual-vs-budget and H2 switches to actual-vs-forecast - a common FP&A headache that breaks aggregation logic.
Professional Services
Revenue is capacity-based. A $10K project running March through April should be spread as $5K per month, not lumped into whichever month the contract was signed. This is a common mistake called out in r/Airtable: templates that assign all revenue to a single date field instead of spreading it across the delivery window.
Retail and CPG
Time-series models with seasonal adjustment are the standard here. Grocery and staples hit 80-95% accuracy; fashion and apparel sit at 60-75%. The gap is volatility, not methodology.
Your weighted pipeline forecast is worthless if half the contacts in it are wrong. Prospeo's 98% email accuracy and 7-day data refresh mean every deal in your CRM is built on verified buyer data - not stale records from six weeks ago.
Fix the data feeding your forecast before you fix the formula.
Forecast Accuracy Benchmarks
Only 7% of sales organizations achieve 90%+ forecast accuracy. An XANT Labs study covering 270,912 closed-won opportunities and $18.1B in revenue found that 47% of forecasts were off by more than half. Only 28.1% landed within 5% of the actual number. The average 90-day prediction missed by 31%+.
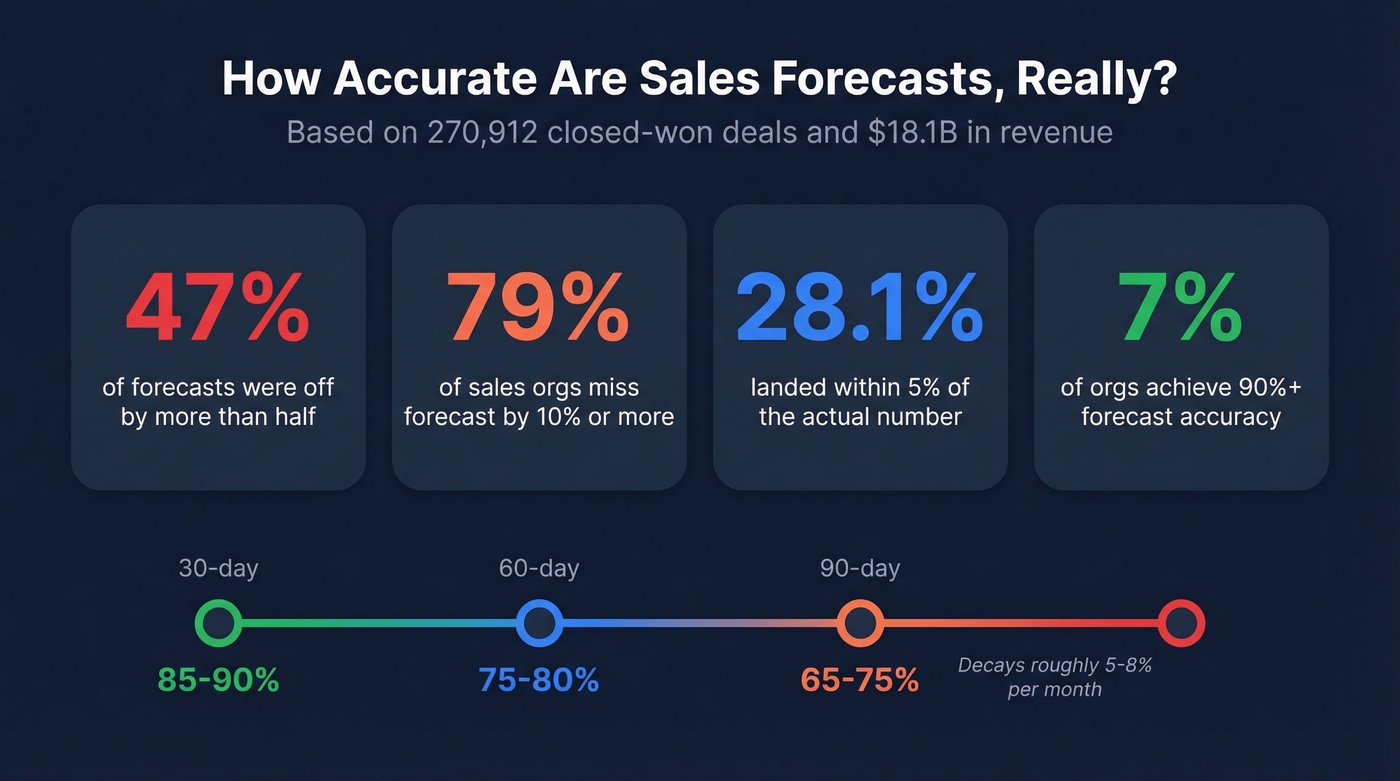
Let that sink in. Nearly half of all forecasts were wrong by more than 50%.
| Method | Variance Range |
|---|---|
| Rep roll-up | ±25-35% |
| Weighted pipeline | ±18-25% |
| Historical trend | ±15-20% |
| AI/ML-assisted | ±8-15% |
Accuracy also decays with time horizon, and this is the part most teams underestimate:
| Horizon | Accuracy Range |
|---|---|
| 30-day | 85-90% |
| 60-day | 75-80% |
| 90-day | 65-75% |
| Decay rate | ~5-8%/month |
Accuracy varies by aggregation level too. Total company forecasts can hit 90%+, category-level drops to 80-90%, and individual deal-level forecasts sit at 70-85%. A single accuracy percentage is meaningless without segmentation - your enterprise deals, mid-market deals, and SMB deals will have wildly different accuracy profiles. Segment by deal size, region, and product line before you benchmark.
Track accuracy using Weighted MAPE (WMAPE) rather than raw MAPE. Standard MAPE misleads when actuals are small, inflating error percentages on low-volume segments. And always track forecast bias separately - knowing whether you consistently over- or under-forecast is more actionable than knowing your average error.
How to Build a Forecast in Excel
Excel is fine for your first forecast. It's not fine for your tenth.
Export your pipeline with columns for Deal Name, Value, Stage, and Close Date. Add a Probability column with calibrated stage probabilities, then create a Weighted Value column using =Value * Probability. Use SUMPRODUCT to roll up the total, or filter by close date for monthly projections.
For time-series forecasting, Excel's built-in Forecast Sheet handles projections with confidence intervals and seasonality detection. Go to Data -> Forecast Sheet, select your historical range, and adjust settings like confidence interval and seasonality. For exponential smoothing, enable the Data Analysis toolpak and run Exponential Smoothing from the Data Analysis menu. Once deal volume grows or you need real-time data, move to CRM-native forecasting - constant manual updating and accidental column sorts will break you eventually.
7 Mistakes That Kill Accuracy
1. Over-reliance on rep gut feel. Rep roll-ups carry ±25-35% variance - the worst of any method. As one GTM leader put it: "Sales forecasts are never gonna be perfect. It's human-entered data... personality types, optimism levels." Calibrate with data, not vibes.
2. Dirty CRM data. Stale contacts, wrong titles, dead emails, deals that went dark six months ago still sitting in "Negotiation." Your forecast is only as good as the data feeding it. Prospeo's CRM enrichment returns 50+ data points per contact with a 92% match rate, refreshed every 7 days - plug it into HubSpot or Salesforce and your pipeline stages start reflecting reality instead of last quarter's org chart.
3. Static stage probabilities. If you set your stage weights two years ago and never recalibrated, you're forecasting with someone else's pipeline. Run the calibration formula quarterly.
4. Lumping revenue into one month. Project-based businesses that assign all revenue to the contract-signed date will overcount some months and undercount others. Spread revenue across the delivery window.
5. Forecasting siloed in sales. Finance sees one number, sales sees another, ops sees a third. Without cross-functional alignment, you're not forecasting - you're negotiating.
6. Using only lagging indicators. The r/excel community is full of practitioners wrestling with rolling forecasts that are always looking backward. Layer in leading indicators - pipeline creation rate, meeting volume, intent signals - to catch shifts before they hit revenue. Folks on r/FPandA echo the same frustration: by the time lagging data surfaces a problem, the quarter's already lost.
7. Never learning from wins and losses. If you don't debrief closed deals and update your model assumptions, you're making the same mistakes on a longer timeline.
Tools for Sales Forecasting
Most enterprise forecasting vendors hide pricing behind "talk to sales." In 2026. For a forecasting tool. The irony writes itself.
| Tool | Starting Price | Best For | Forecast Depth |
|---|---|---|---|
| Excel / Sheets | Free - $22/user/mo | First forecast | Basic (manual) |
| Pipedrive | $39/user/mo | SMB pipeline | Moderate |
| HubSpot Sales Hub | ~$100/user/mo (Professional) | SMB, CRM-native | Good |
| Prospeo | Free tier; ~$0.01/email | CRM data quality | N/A (data layer) |
| Salesforce | ~$165/user/mo (Enterprise) | Enterprise orgs | Deep |
| Clari | ~$25K-$100K/yr | AI on Salesforce | Advanced |
| Anaplan | $50K-$250K+/yr | Enterprise planning | Advanced |
| Workday Adaptive | $50K-$200K+/yr | Enterprise FP&A | Advanced |
HubSpot is the path of least resistance for SMBs already on their CRM - native forecasting in the Professional plan, no extra tooling required. Salesforce is the enterprise standard, but forecasting depth depends on edition and configuration, and the learning curve is real. Clari layers AI-powered forecasting on top of Salesforce for teams that want tighter variance without rebuilding their stack.
Skip Clari or Anaplan if your average deal size is under $15K. A calibrated weighted pipeline in HubSpot with clean data will get you 80% of the way there at 5% of the cost. The biggest ROI isn't a fancier sales forecast model - it's making sure the data feeding your current model is actually accurate. If your needs are more specific, building a custom approach that blends weighted pipeline with regression on your unique deal signals will outperform any off-the-shelf solution.
Pipeline coverage math says you need $42.8M in pipeline to close $5M. That's a lot of net-new contacts. Prospeo gives you 300M+ profiles with 30+ filters - buyer intent, headcount growth, funding - at $0.01 per verified email. Generate pipeline that actually converts.
Stop forecasting on a pipeline you can't fill. Start building one you can trust.
FAQ
What's the most accurate sales forecast model?
AI/ML-assisted models show the tightest variance at ±8-15%, but they require clean CRM data and high deal volume (500+ deals/quarter). For most B2B teams, a calibrated weighted pipeline at ±18-25% offers the best accuracy-to-effort ratio. Start there and layer AI once your data matures.
How do you calculate a weighted pipeline forecast?
Multiply each deal's value by its stage probability, then sum the results. A $50K deal at Proposal stage with 50% probability contributes $25K to the forecast. Calibrate probabilities quarterly using actual win rates per stage - default CRM probabilities are almost always wrong.
Can you forecast sales accurately in Excel?
Yes, for simple models. Excel's Forecast Sheet handles time-series projections with confidence intervals, and you can build weighted pipeline models with SUMPRODUCT. The limitation is manual updating - once you exceed 50+ active deals or need real-time data, move to a CRM with native forecasting.
How often should you update a sales forecast?
Weekly for pipeline-based models, monthly for time-series models. Forecast accuracy decays ~5-8% per month, so a 90-day forecast that was 85-90% accurate at creation drops to 65-75% by close date. Shorter update cycles catch pipeline changes faster.
How does dirty CRM data affect forecast accuracy?
Stale contacts, uncalibrated stage probabilities, and zombie deals inflate pipeline by 20-40%, making every downstream forecast unreliable. Keeping contact records current with tools like Prospeo's enrichment (98% email accuracy, 7-day refresh) ensures the data feeding your forecasting math in HubSpot or Salesforce actually reflects reality.