How to Build a Sales Forecast Template in Google Sheets (2026)
Four out of five sales and finance leaders missed a quarterly forecast in the past year. Over half missed it twice or more. The problem isn't a shortage of templates - it's picking the wrong method for how you actually sell.
On Reddit, sellers routinely build manual Sheets forecasting systems specifically to avoid paying for expensive software, and those systems work when the method fits the business. We've watched teams grab a pretty template, dump data in, and wonder why the numbers are garbage three months later. You need one template that matches your sales motion, not nine that collect dust.
What You Need (Quick Version)
Three forecasting methods you can build entirely in a spreadsheet:
- Historical growth - backward-looking, best for stable businesses
- Pipeline-weighted - deal value x stage probability, best for B2B
- Sales cycle length - qualified pipeline / average cycle time
If you're a B2B team running fewer than 100 active deals, start with pipeline-weighted. It's the most accurate method you can maintain in a spreadsheet without losing your mind. For tighter accuracy, combine two methods - run pipeline-weighted alongside historical growth and reconcile the gap.
Three Forecasting Methods in Sheets
Historical Growth
Let's get this method's biggest limitation out of the way: it assumes the future looks like the past. Launching new products or entering new markets? Skip it. Typical accuracy sits around ±15-20%.
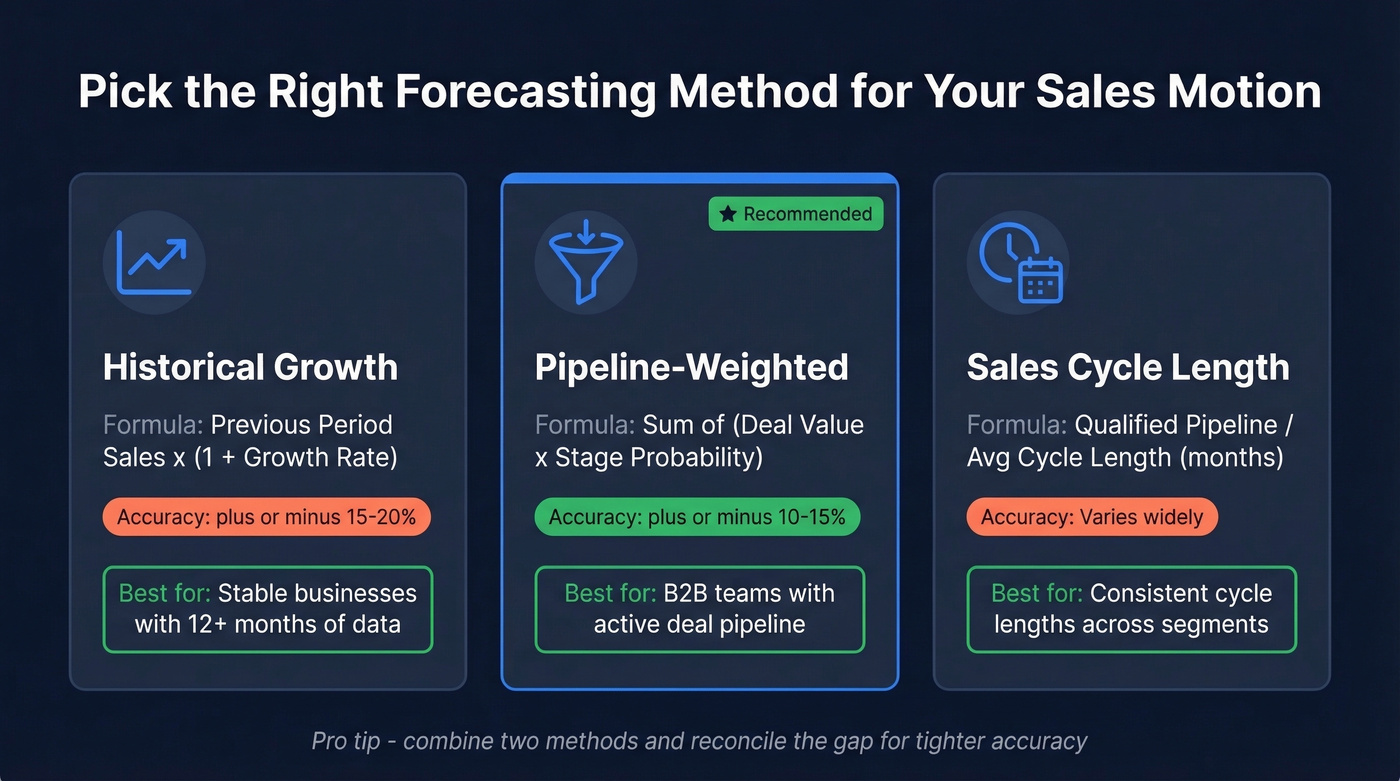
Formula: Previous Period Sales x (1 + Growth Rate)
Close $200k last quarter at 5% growth? Your forecast is $210k. Simple. Use this when you've got 12+ months of consistent data and a stable growth rate. This approach also doubles as a straightforward revenue forecast template when you only need top-line projections.
Pipeline-Weighted
This is where most B2B teams should live. Assign a win probability to each pipeline stage, multiply every deal's value by that probability, and sum the results.
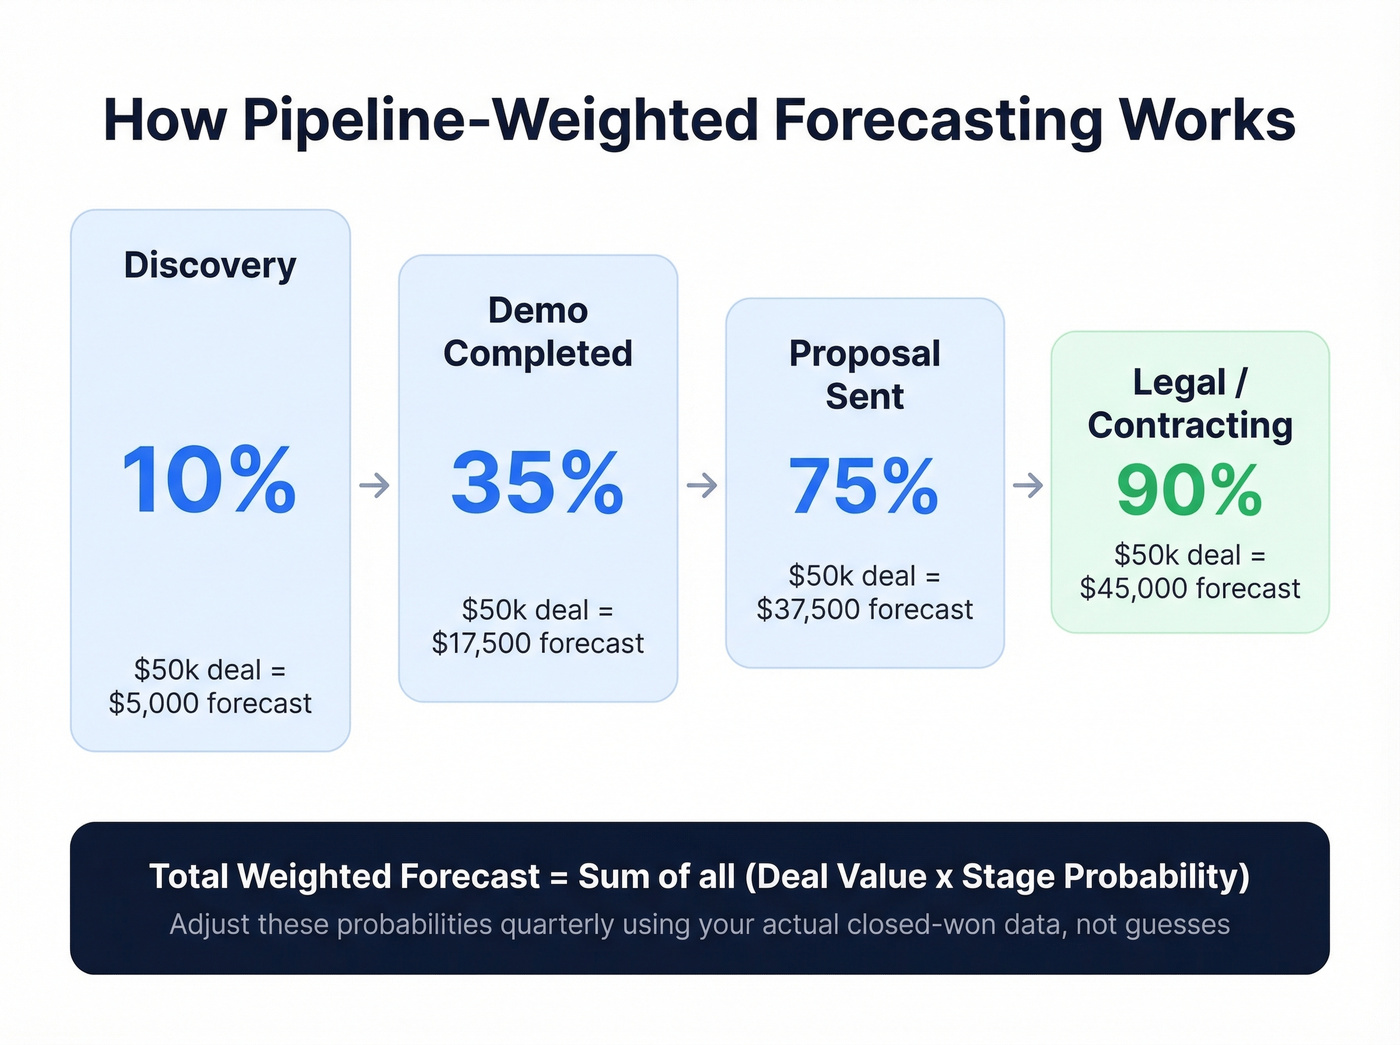
Formula: Sum of (Deal Value x Stage Probability)
| Stage | Probability |
|---|---|
| Discovery | 10% |
| Demo Completed | 35% |
| Proposal Sent | 75% |
| Legal/Contracting | 90% |
A $50k deal at proposal contributes $37,500 to your forecast. Typical accuracy for opportunity-stage forecasting is ±10-15%, which sounds rough until you realize fewer than 20% of B2B orgs consistently forecast within 5% of actual revenue. So ±10-15% puts you ahead of most.
Adjust these probabilities quarterly based on your actual win rates. Don't guess - pull your closed-won data and calculate. For a more advanced version, reverse-engineer how much pipeline you need by dividing your quota by your historical win rate.
Sales cycle length
Formula: Total Qualified Pipeline Value / Avg Cycle Length in Months
Got $600k in qualified pipeline with a 3-month average cycle? Monthly forecast: $200k.
Here's the thing: I've watched this method fall apart when teams have wildly different cycle lengths across segments. A 2-week SMB deal and a 6-month enterprise deal averaged together tells you nothing useful. Use it only when cycle lengths are reasonably consistent across your book of business, or segment your pipeline first and forecast each segment separately.
Google Sheets Functions for Forecasting
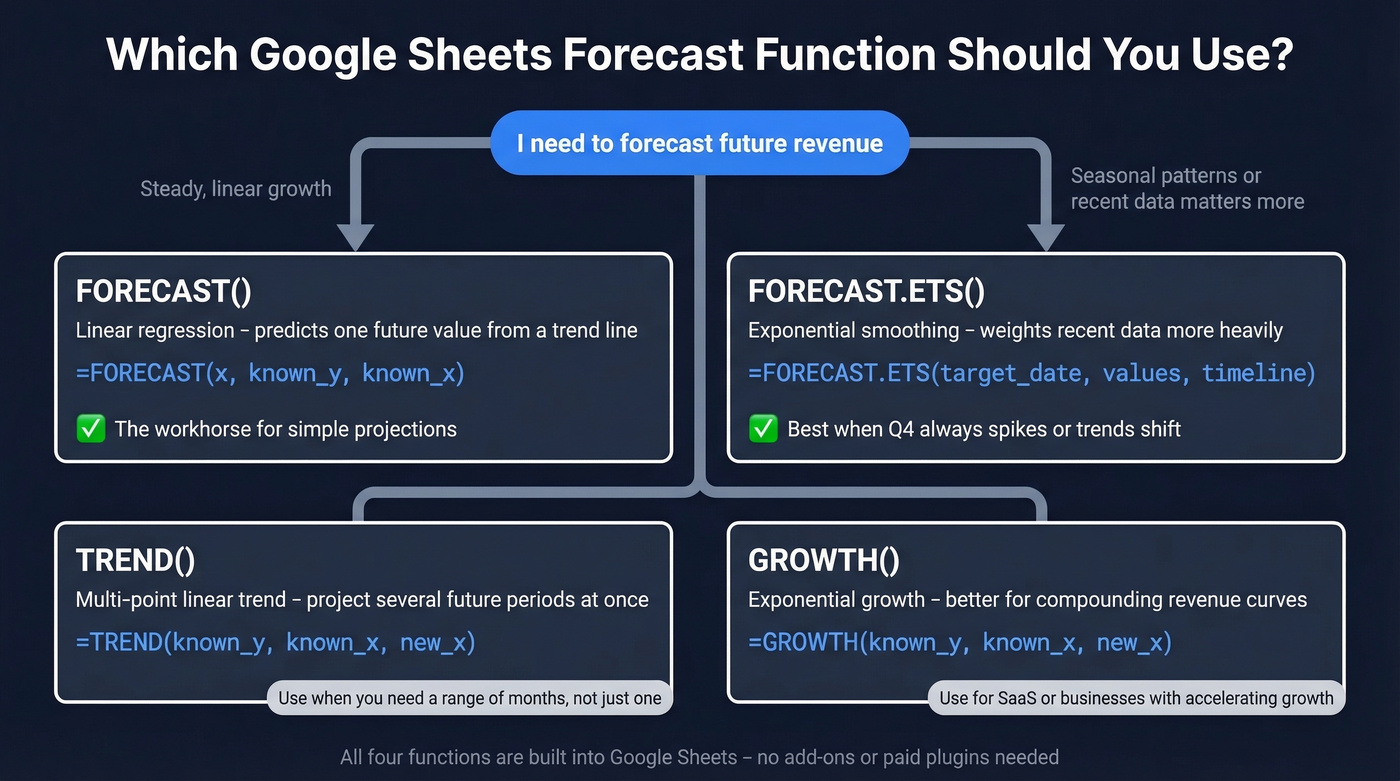
Sheets has native forecasting functions most people never touch:
| Function | Syntax | When to Use |
|---|---|---|
| FORECAST | [FORECAST(x, known_y, known_x)](https://support.google.com/docs/answer/3094000?hl=en) |
Linear regression - predict one future value from a trend line |
| FORECAST.ETS | [FORECAST.ETS(target_date, values, timeline)](https://support.microsoft.com/en-us/office/forecast-ets-function-15389b8b-677e-4fbd-bd95-21d464333f41) |
Exponential smoothing - weights recent data more heavily |
| TREND | TREND(known_y, known_x, new_x) |
Multi-point linear trend - project several future periods at once |
| GROWTH | GROWTH(known_y, known_x, new_x) |
Exponential growth - better for compounding revenue curves |
FORECAST() is the workhorse for simple linear projections. If your business has strong seasonality or you want recent months to matter more than data from two years ago, switch to FORECAST.ETS(). No add-ons or paid plugins required for either.
Pipeline-weighted forecasting only works when your pipeline reflects real opportunities. If 20% of your contacts have bad emails, your forecast is inflated by 20%. Prospeo delivers 98% email accuracy with a 7-day refresh cycle - so every deal in your weighted pipeline is one you can actually close.
Stop forecasting revenue from contacts you can't reach.
Templates by Business Type
| Business Type | Template Style | Key Columns |
|---|---|---|
| Simple revenue | Monthly units x price | Units, price, total |
| B2B pipeline | Weighted pipeline | Stage, probability, value |
| SaaS | MRR/churn model | MRR, new adds, churn, net retention |
| Retail/ecommerce | Traffic x conversion | Foot traffic, CVR, AOV |
If you sell subscriptions, a standard forecasting spreadsheet will mislead you. SaaS forecasting lives and dies on churn and expansion revenue - a model that ignores those will look great for six months and then diverge from reality hard. Most SaaS models stay useful for projections under 12 months and become highly inaccurate after two years, so keep your projection horizon tight.
Your sales projection template should match how revenue actually flows into your business, not just how deals close. For free templates you can copy directly, Smartsheet's library covers monthly, annual, and industry-specific variants.
Five Mistakes That Kill Forecast Accuracy
1. Version confusion. Multiple people emailing copies of the same spreadsheet is how forecasts diverge. Use a single shared Google Sheet with edit history. One source of truth.
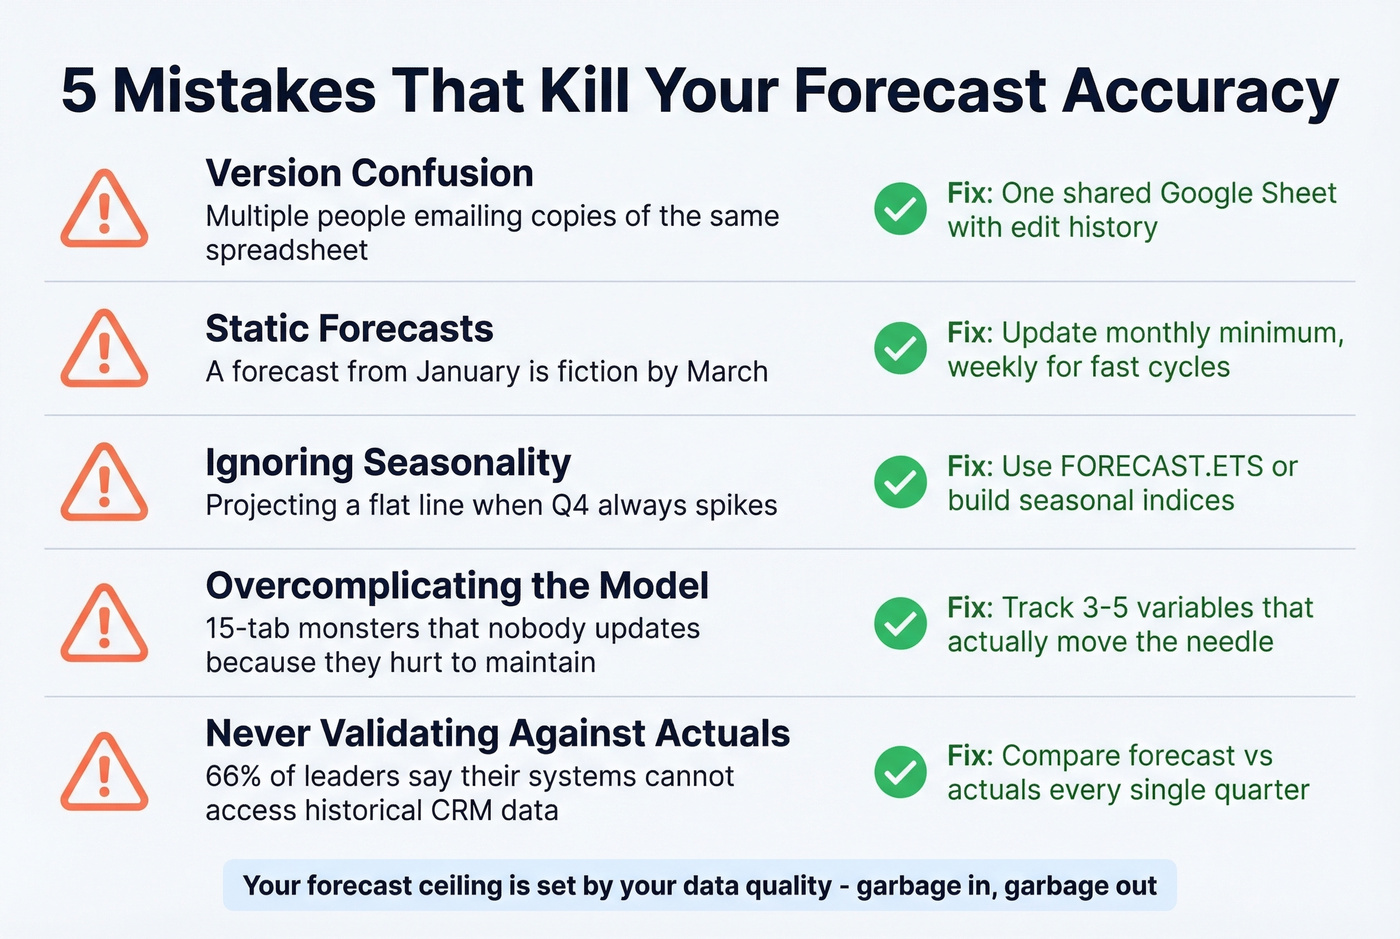
2. Static forecasts. A forecast you built in January is fiction by March. Update monthly at minimum - weekly if you're running a fast sales cycle.
3. Ignoring seasonality. If Q4 always spikes and you're projecting a flat line, your model is lying to you. Use FORECAST.ETS or build manual seasonal indices to account for it.
4. Overcomplicating the model. We've seen teams build 15-tab monsters that nobody updates because they're too painful to maintain. Track 3-5 variables that actually move the needle and stop there.
5. Never validating against actuals. Compare your forecast to actual results every quarter. 66% of sales and finance leaders say their reporting systems can't access historical CRM or performance data. Don't let that be you.
Your forecast ceiling is set by your data quality. If pipeline contacts have invalid emails, you're forecasting revenue from deals you can't actually reach. Prospeo's 98% email accuracy and 7-day data refresh cycle mean your weighted pipeline reflects real opportunities - not ghosts sitting in your CRM.
When Sheets Isn't Enough
Sheets works until you're managing a huge volume of active deals, the sheet crawls on every edit, multiple reps start stepping on each other's changes, or you're tired of manually copying CRM data into a spreadsheet every Monday morning.
Most teams graduate to expensive forecasting platforms too early. HubSpot CRM is free for up to 2 users ($15/user/mo on paid tiers). Pipedrive starts at $14/user/mo. Salesforce runs $25-$300/user/mo depending on the edition. Dedicated tools like Clari start around $10k+/year. Ride Sheets as long as it serves you, then graduate when the pain is real - not when a vendor's SDR tells you it should be.
If you're not there yet, skip the enterprise tools. A well-maintained Google Sheet with the right method will outperform a $50k platform that nobody trusts or updates. If you do need to compare options, start with a shortlist of sales forecasting platforms and work backward from your process.
You just built a forecasting system that depends on clean CRM data. Prospeo enriches your CRM with 50+ data points per contact at a 92% match rate - for roughly $0.01 per email. No more ghost deals inflating your Google Sheets forecast.
Enrich your CRM and forecast against real pipeline, not stale records.
FAQ
What's the best sales forecast template for Google Sheets?
Pipeline-weighted forecasting is the most reliable for B2B teams - typically accurate to ±10-15% and maintainable in a single tab. Start with Discovery 10%, Demo 35%, Proposal 75%, Contracting 90% and adjust quarterly based on your actual win rates.
Does Google Sheets have a built-in forecast function?
Yes. FORECAST() uses linear regression to predict a future value from historical data. For a model that weights recent months more heavily, FORECAST.ETS() applies exponential smoothing. No add-ons or paid plugins required.
Can I use Google Sheets as a revenue forecast template?
For straightforward top-line projections, the historical growth method works well - plug in prior-period revenue and your expected growth rate. For deal-level detail, switch to the pipeline-weighted approach with stage probabilities.
How often should I update my sales forecast?
Monthly at minimum. Weekly if your average sales cycle is under 30 days. The consensus on r/sales is that a forecast older than two weeks is already stale, and in our experience that tracks - especially for teams with high deal velocity.