Sales Funnel Analysis: How to Diagnose Where Deals Actually Die
Your VP just asked why pipeline is up 30% but closed-won is flat. You pull up the dashboard, stare at the numbers, and realize you don't actually know where deals are dying. That's the gap between having a funnel and running a real sales funnel analysis - and with 60% of consumers taking 6+ actions before buying, the answer is rarely obvious.
Here's the short version:
- Know your stage-to-stage conversion rates and compare them against benchmarks (table below).
- Run the pipeline velocity formula monthly. It's the single number that connects funnel health to revenue.
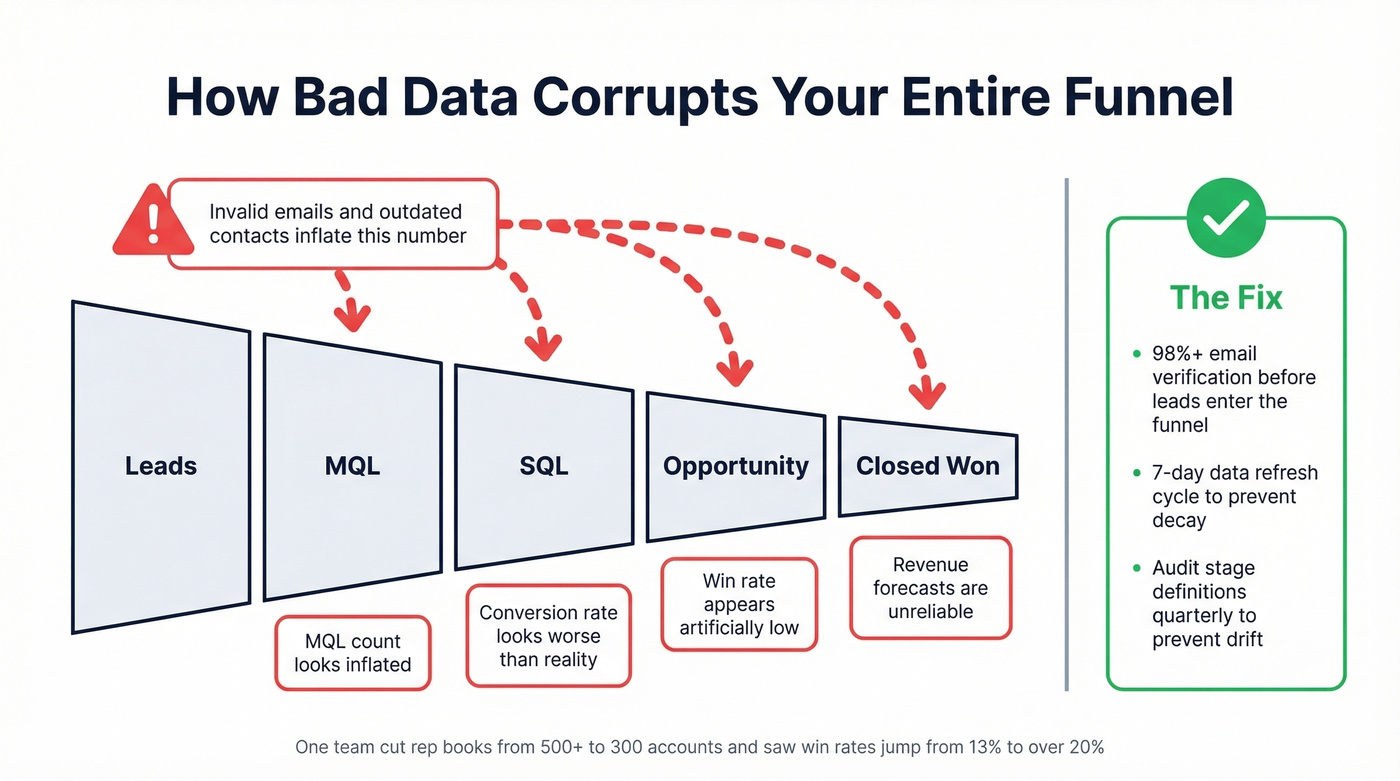
- Before you analyze anything, verify your data is clean. Bad emails inflate top-of-funnel and corrupt every downstream metric.
Stages You're Actually Analyzing
Forget AIDA for a minute. Awareness-Interest-Desire-Action is a marketing framework, and BCG has argued that linear models oversimplify how buyers actually move through decisions. For operational funnel diagnosis, you need pipeline stages: Lead → MQL → SQL → Opportunity → Closed Won.
These map to things your CRM can track and your reps can influence. MQLs have a scoring threshold. SQLs passed a qualification call. Opportunities have a dollar value attached. That's what you're measuring - not "desire."
Key Metrics and Formulas
Stage conversion rate is the foundation:
(Leads reaching next stage ÷ Leads entering current stage) × 100
So if 200 out of 350 SQLs become Opportunities, that's 200/350 × 100 = 57.0%. Easy enough. The power comes from segmenting it by channel, rep, deal size, and persona.
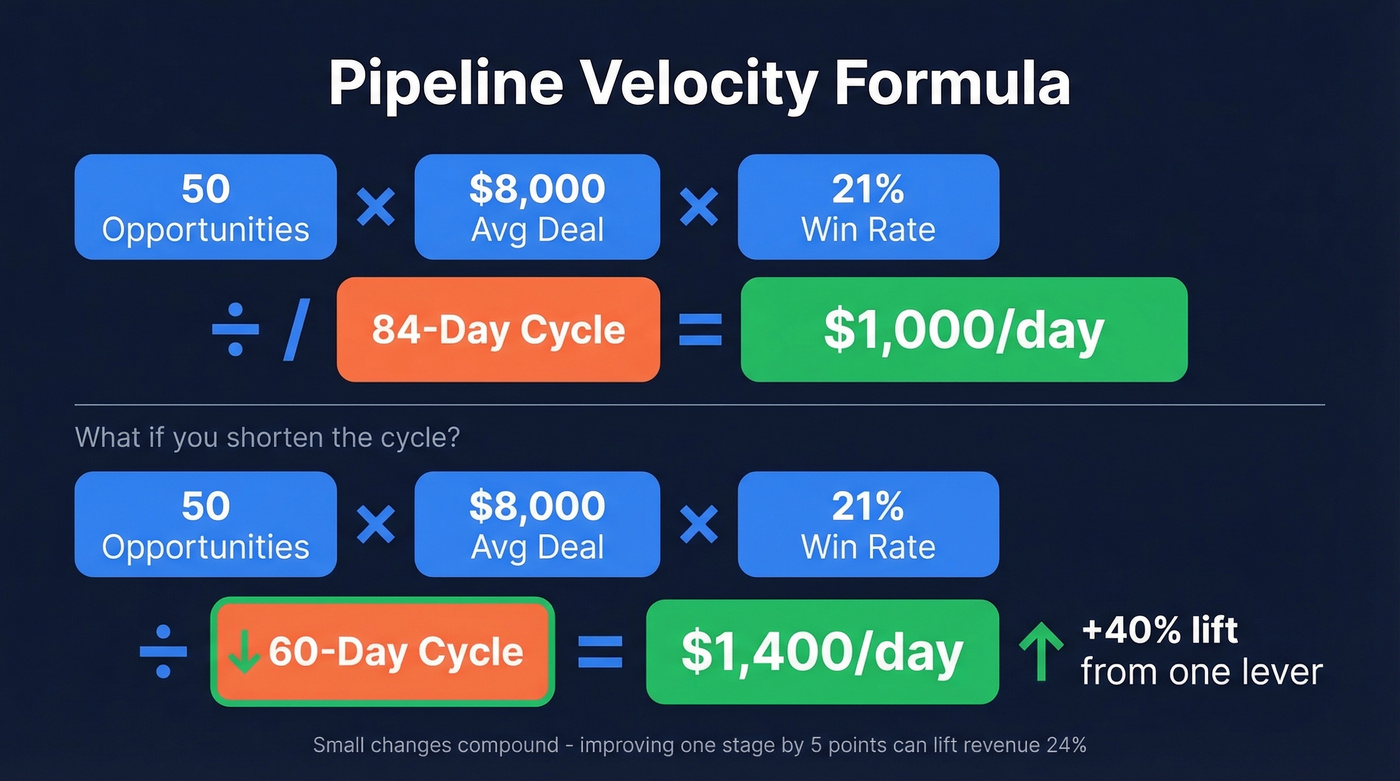
Pipeline velocity is the single best composite metric for evaluating funnel performance. It tells you how much revenue your pipeline generates per day :
(# Opportunities × Avg Deal Value × Win Rate) ÷ Sales Cycle Length
Worked example: 50 opportunities × $8,000 avg deal × 21% win rate ÷ 84-day cycle = $1,000/day in pipeline velocity. Shorten the cycle to 60 days with everything else constant, and that jumps to $1,400/day - a 40% lift from one lever.
Small conversion improvements compound hard. Kluster's analysis shows that improving a single stage from 57% to 62% moved revenue from £200,000 to £248,622 - a 24% increase from a 5-point lift at one stage.
Funnel Conversion Benchmarks
Numbers without context are useless. Here's what the latest benchmark data shows across industries:
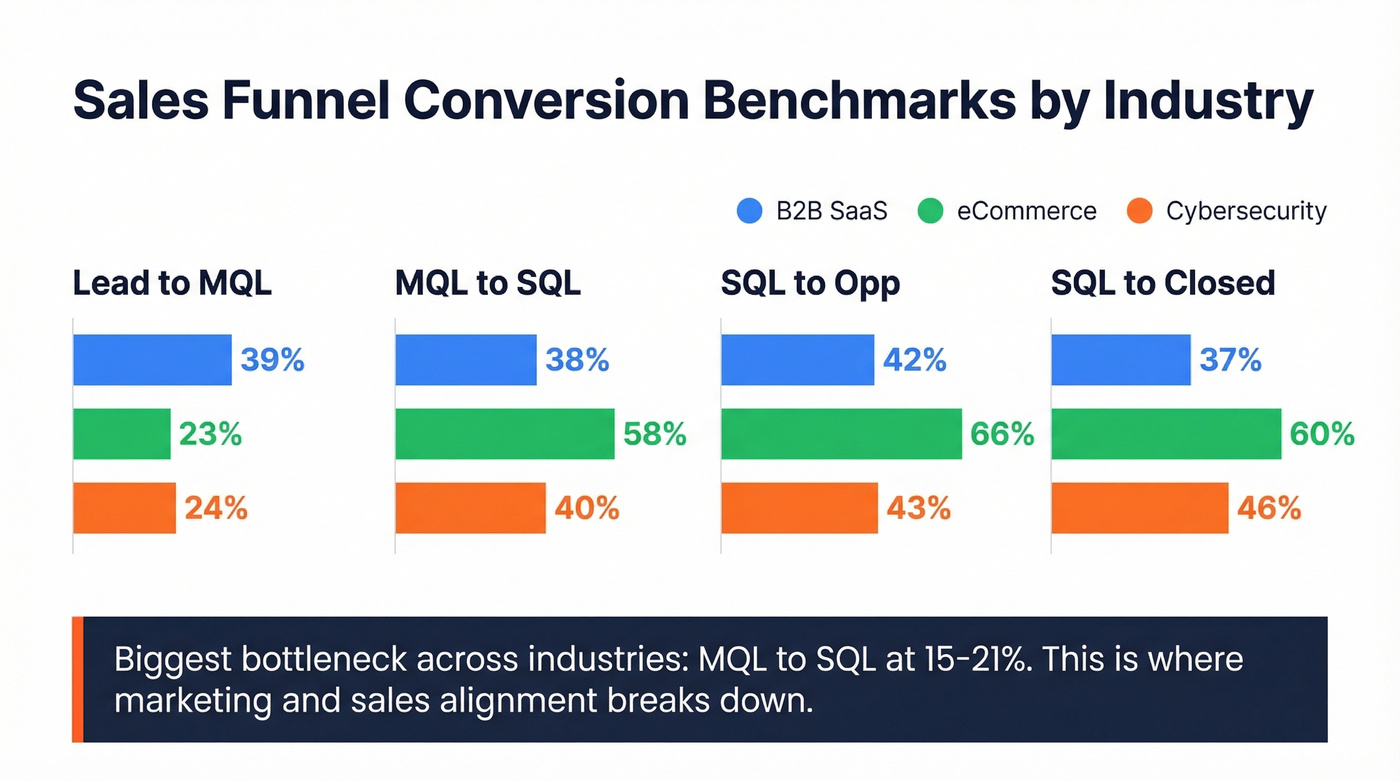
| Industry | Lead→MQL | MQL→SQL | SQL→Opp | SQL→Closed |
|---|---|---|---|---|
| B2B SaaS | 39% | 38% | 42% | 37% |
| eCommerce | 23% | 58% | 66% | 60% |
| Cybersecurity | 24% | 40% | 43% | 46% |
For a full SaaS funnel baseline: Visitor→Lead 1.4%, Lead→MQL 41%, MQL→SQL 39%, SQL→Opportunity 42%, Opportunity→Close 39%. That implies an overall lead-to-customer rate of roughly 2.7%, consistent with the 2-5% range most B2B companies land in.
The biggest bottleneck across industries? MQL→SQL, which runs 15-21% in most datasets. That's where marketing and sales alignment breaks down. Median sales cycle sits at 84 days, the average B2B win rate is 21%, and sales cycles have lengthened 32% since 2021. That last stat is critical: pipeline velocity is declining even if your conversion rates hold steady.
Channel matters too. SEO-sourced visitors convert to leads at 2.1%, while PPC lands at 0.7%. But PPC leads often convert faster downstream - don't optimize one stage in isolation.
Bad emails inflate your Lead→MQL numbers and corrupt every conversion rate downstream. Prospeo's 98% email accuracy and 7-day data refresh cycle ensure the leads entering your funnel are real - so your stage-by-stage analysis actually means something.
Stop diagnosing a funnel built on dirty data. Start with 75 free verified emails.
How to Run the Analysis Step by Step
1. Define stages and exit criteria. Every stage needs a clear definition of what moves a lead forward and what disqualifies them. If your team can't agree on when an MQL becomes an SQL, your conversion rates are meaningless.
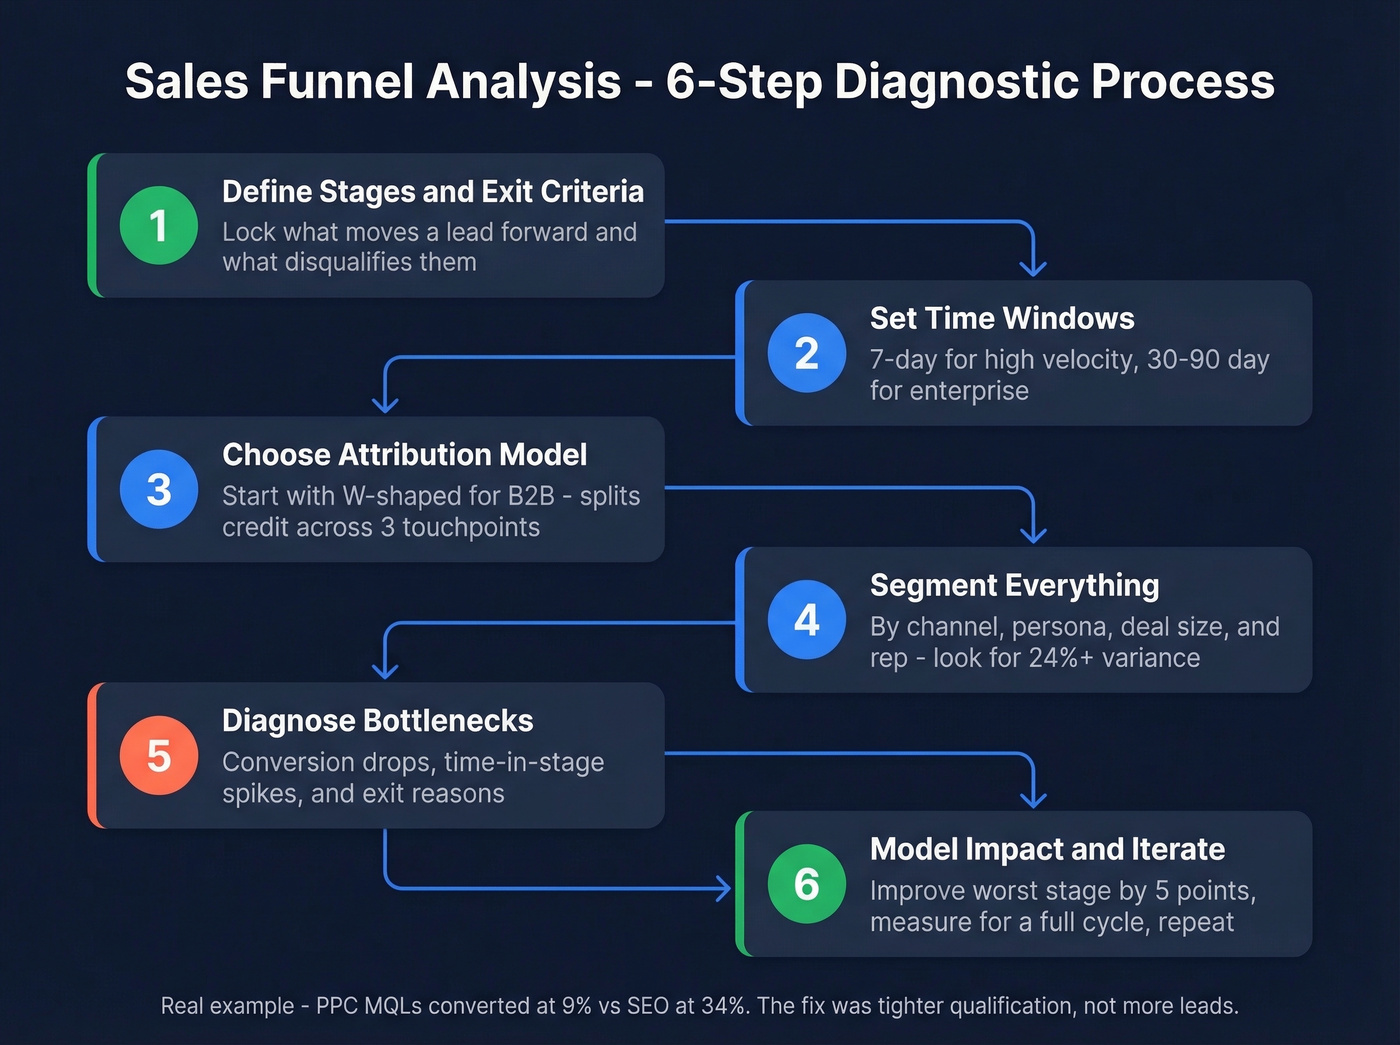
2. Set time windows. A 7-day window works for high-velocity sales. For enterprise deals with 84-day cycles, you need 30- or 90-day windows. Funnels with more than 5-7 steps become unmanageable, so use multiple focused funnels instead.
3. Choose an attribution model. First-touch credits the original source. Last-touch credits the final interaction before conversion. A W-shaped model splits credit across first interaction, lead creation, and opportunity creation - it's the best starting point for B2B. If you're running queries directly, use first-touch attribution with a 7-day window as your baseline.
4. Segment everything. Break conversion rates by channel, persona, deal size, and rep. We've seen a 24% variance between reps at the same stage - that's a coaching opportunity hiding in your data.
5. Diagnose bottlenecks. Look for conversion drops, time-in-stage spikes, and exit reasons. Track time-to-convert between stages. If median SQL→Opportunity is 21 days but p90 is 60+, you have a stalling problem that conversion rates alone won't reveal.
Here's what a real diagnosis looks like: a SaaS team sees 41% Lead→MQL but only 18% MQL→SQL. Segmenting by channel reveals PPC MQLs convert at 9% while SEO MQLs convert at 34%. The fix isn't more leads - it's tighter PPC qualification criteria.
6. Model the impact and iterate. Pick your worst-performing stage and model what happens if you improve it by 5 points. That's your business case. Change one variable, measure for a full cycle, then move to the next bottleneck.

Common Data Mistakes That Corrupt Your Funnel
Siloed channel data creates misattribution. Buyers take 6+ actions across channels before converting. If you're only looking at last-touch, you're crediting the wrong channel and starving the one that actually works.
Stage definition drift kills trust in your numbers. In our experience, this is the silent killer - marketing calls something an MQL, sales disagrees, and six months later nobody knows what the numbers mean. Lock definitions in writing and audit quarterly.
Let's be honest: if your average deal size is under $10K, you don't need a $55K analytics platform. You need clean data and a spreadsheet. One team trimmed rep books from 500+ to 300 accounts and saw win rates jump from 13% to over 20%. Their funnel diagnosis revealed the problem was coverage, not conversion. The most effective drop-off fixes often come from simplifying your process, not adding more technology.
Tools for Funnel Analysis
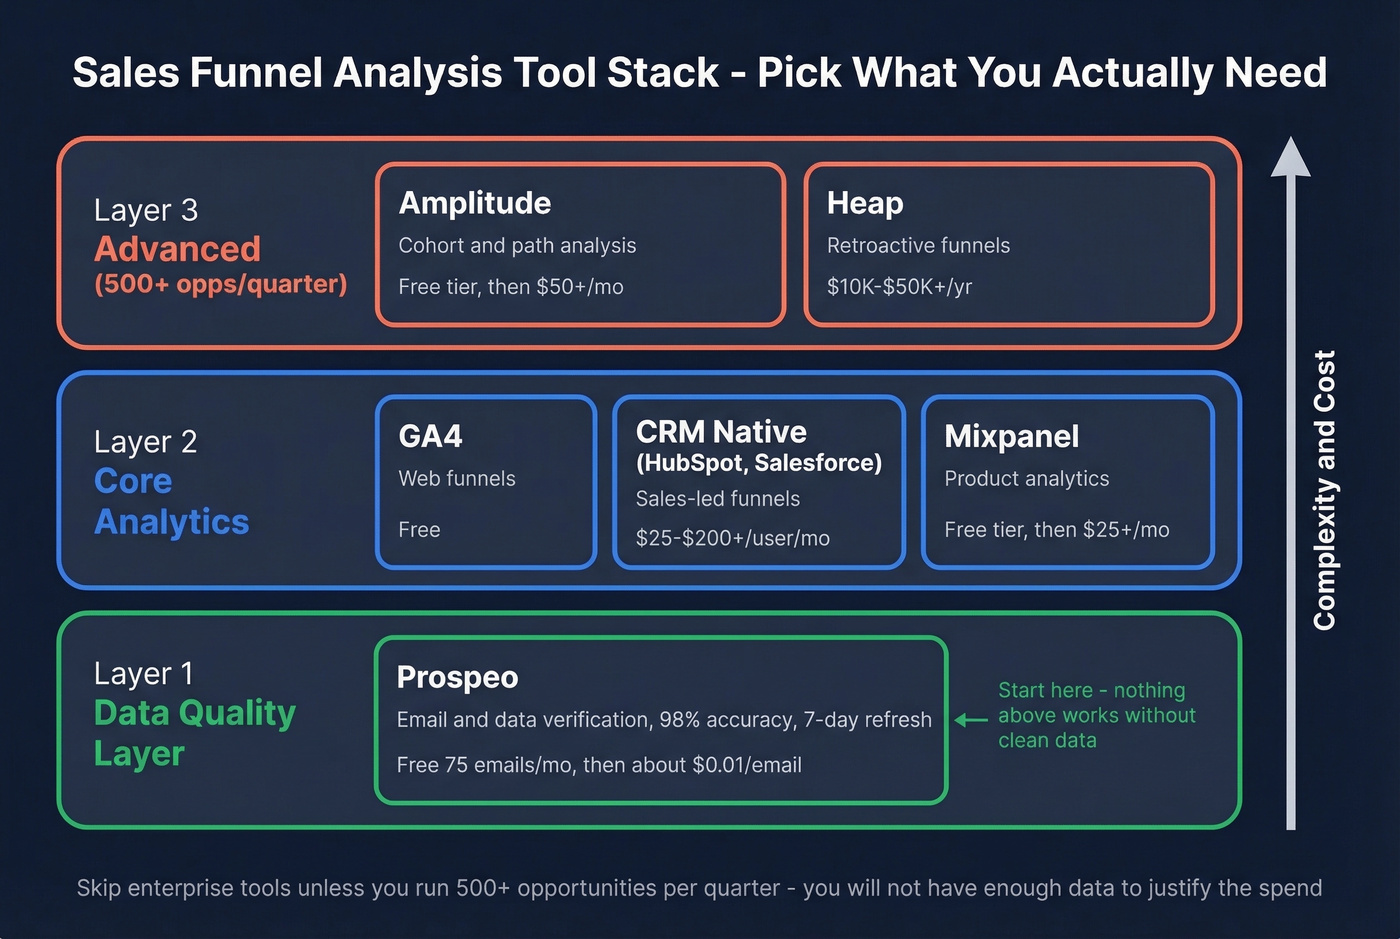
A CRM with decent reporting plus clean data gets you 80% of the way there. Skip the enterprise analytics suite unless you're running 500+ opportunities per quarter - you won't have enough data to make the investment worthwhile.
| Tool | Best For | Pricing |
|---|---|---|
| Prospeo | Email/data verification | Free (75 emails/mo) → ~$0.01/email |
| GA4 | Basic web funnels | Free; GA4 360 starts ~$50K+/year |
| Mixpanel | Product analytics | Free tier → ~$25+/mo |
| Amplitude | Cohort/path analysis | Free tier → ~$50+/mo |
| Heap | Retroactive funnels | ~$10K-$50K+/yr |
| CRM-native (HubSpot, Salesforce) | Sales-led funnels | ~$25-$200+/user/mo |
Prospeo sits in a different category - it's the data quality layer underneath your analytics stack. With 98% email accuracy on a 7-day refresh cycle, it ensures your top-of-funnel numbers actually mean something before you start diagnosing conversion rates.
That 15-21% MQL→SQL bottleneck? Often it's not alignment - it's bad contact data sending reps to dead ends. Prospeo delivers verified emails at $0.01 each and 125M+ direct dials with a 30% pickup rate, so reps connect with real buyers instead of bouncing.
Fix your biggest conversion drop by giving reps contacts that actually connect.
How AI Is Changing Funnel Diagnostics
McKinsey data shows AI in sales drives a 50% increase in leads and appointments and a 10-20% revenue lift. Predictive lead scoring replaces static MQL thresholds with dynamic probability models, while anomaly detection flags sudden conversion drops before your quarterly review catches them. Add next-best-action recommendations for stalled deals and conversational AI handling initial qualification at scale, and the diagnostic layer gets significantly sharper.
Real talk: most teams should nail their basic funnel math before investing in AI tooling. Salesforce Einstein runs $50/user/month, and 6sense averages ~$55K/year. Start with the formulas above, get your stage definitions locked, and only layer on AI once you trust the underlying data.
FAQ
What's the most important metric in a sales funnel analysis?
Pipeline velocity. It combines opportunities, deal value, win rate, and cycle length into one number that directly predicts revenue. Stage-to-stage conversion rate segmented by channel and rep is the diagnostic layer underneath it. Start with velocity for the executive view, then drill into stage conversions to find problems.
How often should you analyze your funnel?
Monthly for stage conversion rates and pipeline velocity. Quarterly for deeper diagnostic work - attribution model review, benchmark comparisons, and segmentation by persona or deal size. Weekly if you're actively running optimization experiments on a specific stage.
How does bad data affect funnel metrics?
Invalid emails and outdated contacts inflate your top-of-funnel count, making every downstream conversion rate look worse than reality. A 7-day data refresh cycle and 98%+ email verification ensure your funnel starts with verified prospects, so metrics reflect actual pipeline health rather than data decay.
What's a good free tool for cleaning funnel data?
Prospeo's free tier gives you 75 verified emails per month plus 100 Chrome extension credits - enough for small teams to validate top-of-funnel quality before committing to a paid plan. Pair it with GA4's free funnel reports for a zero-cost starting stack.