Sales Funnel Velocity: The Formula, Benchmarks, and How to Fix Yours
84% of sales reps are missing quota right now. That's not a pipeline problem - it's a velocity problem. Most teams measure how much is in the funnel. They never ask how fast it's moving.
Sales funnel velocity is the metric that actually predicts revenue, and almost nobody tracks it correctly.
What You Need (Quick Version)
- The formula: (Opportunities x Deal Size x Win Rate) / Cycle Length = $/day
- Benchmark yourself: SaaS averages $1,847/day; Professional Services $876/day - full table below
- The fastest fix: shorten cycle length (not more leads) and clean your pipeline data
What Is Sales Funnel Velocity?
Sales Funnel Velocity measures how quickly deals move through your pipeline and convert to revenue. The output is dollars per day - a single number that captures pipeline health better than any individual metric could on its own.
Whether you call it sales velocity, pipeline velocity, or funnel velocity, it's the same formula. Every B2B deal now involves 6-10 decision-makers, which means cycle length is the silent killer most teams underestimate.
The Formula and a Worked Example
Sales Funnel Velocity = (Opportunities x Avg Deal Size x Win Rate) / Avg Sales Cycle Length
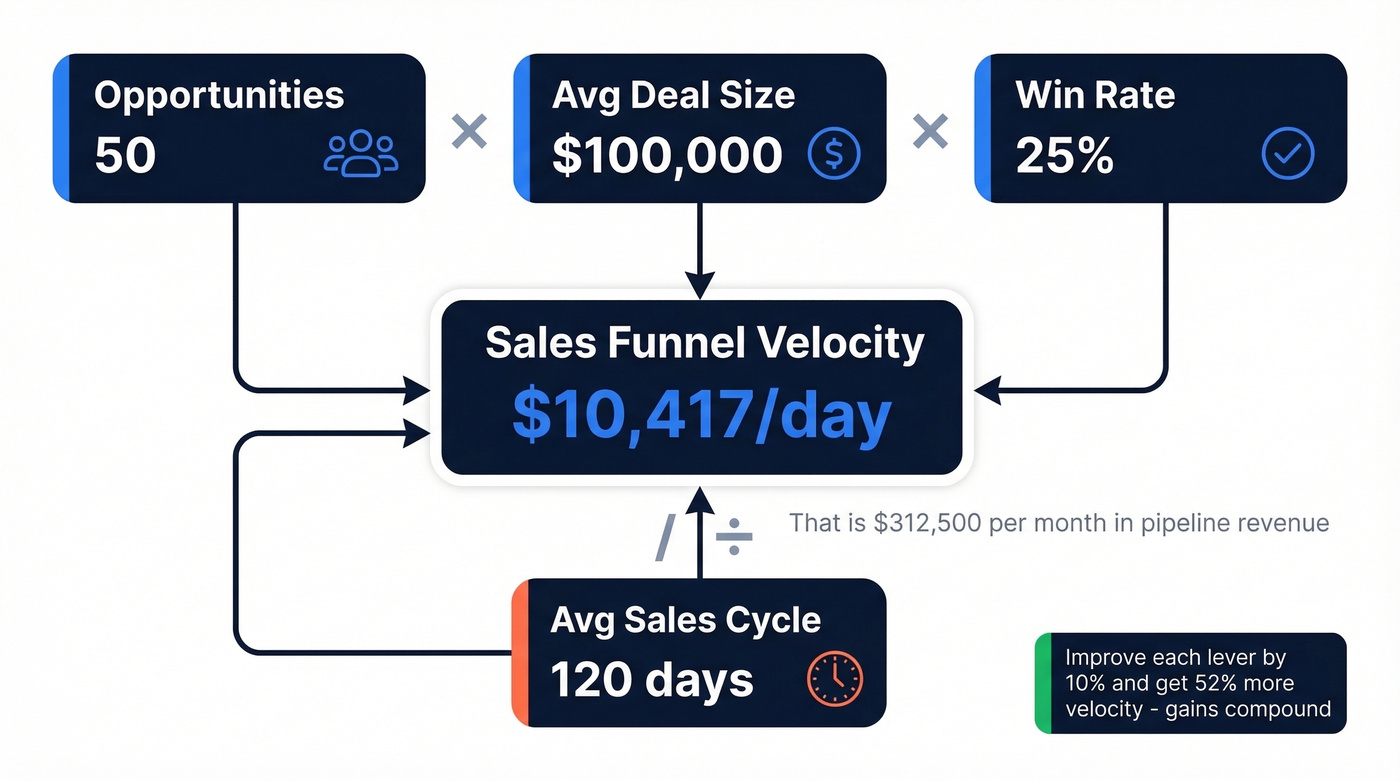
Say you've got 50 qualified opportunities, a $100K average deal, a 25% win rate, and a 120-day cycle:
(50 x $100,000 x 0.25) / 120 = $10,417/day
That means your pipeline is generating revenue at a rate of $312,500/month. Here's what makes this powerful: the four variables are multiplicative, not additive. A 10% improvement in each lever doesn't give you 40% more velocity - it gives you roughly 52% more, because the gains compound across all four inputs simultaneously. That compounding effect is why velocity is the highest-leverage metric in your entire sales operation.
Industry Benchmarks for 2026
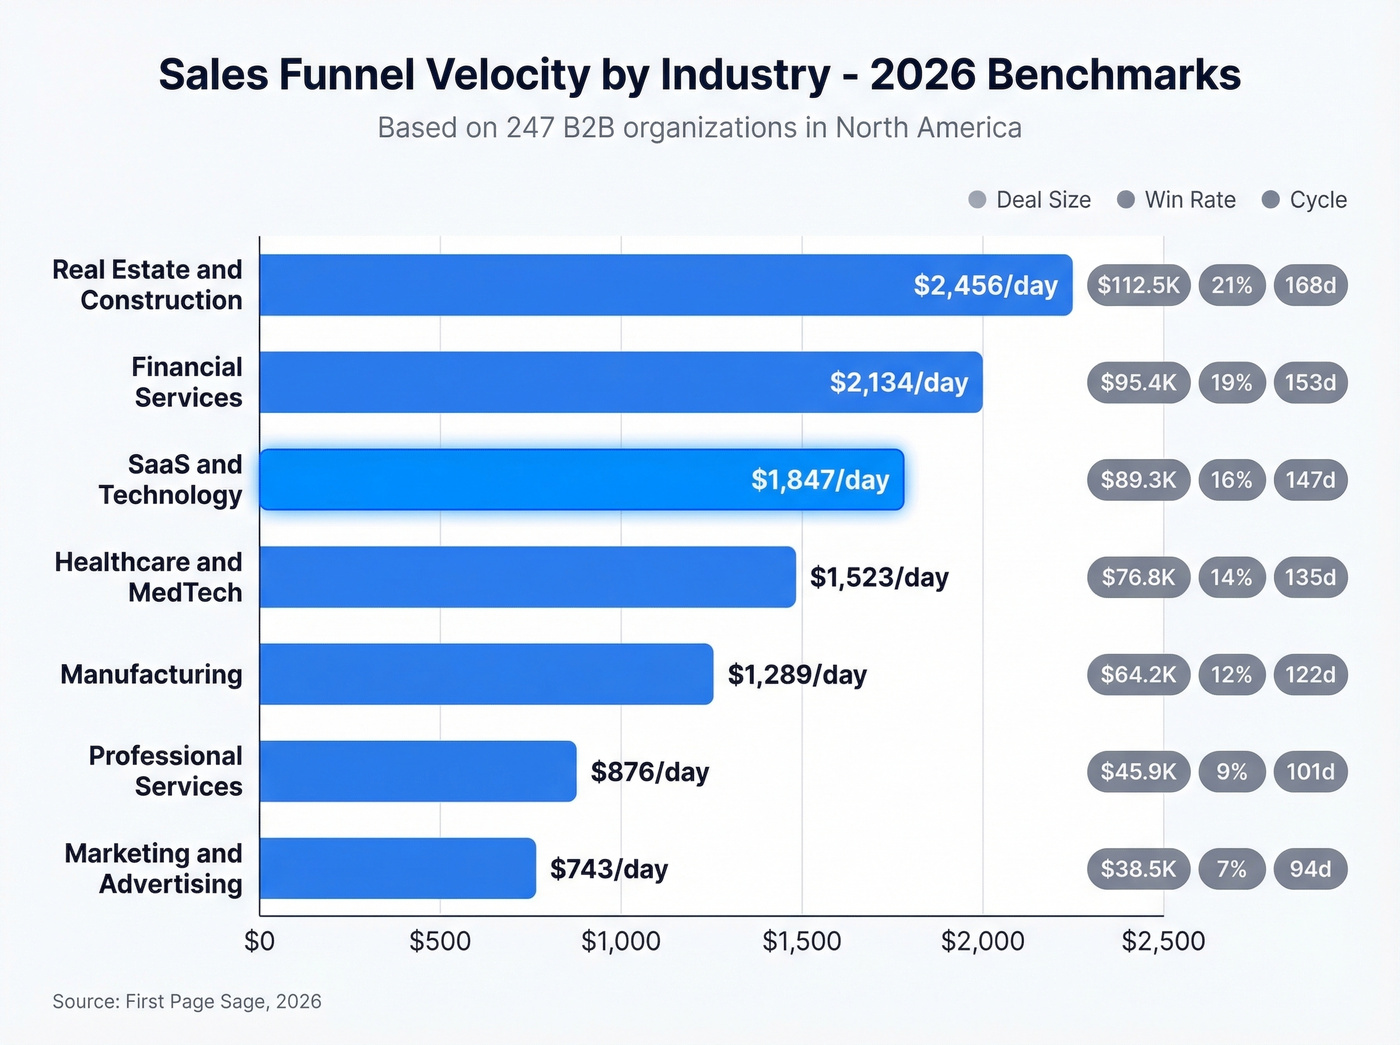
A First Page Sage study across 247 B2B organizations in North America gives us the clearest velocity benchmarks available:
| Industry | Velocity ($/day) | Avg Deal | Win Rate | Cycle |
|---|---|---|---|---|
| Real Estate & Construction | $2,456 | $89,300 | 16% | 147 days |
| Financial Services | $2,134 | $31,200 | 18% | 89 days |
| SaaS & Technology | $1,847 | $12,400 | 22% | 67 days |
| Healthcare & MedTech | $1,523 | $18,700 | 25% | 72 days |
| Manufacturing | $1,289 | $47,800 | 19% | 124 days |
| Professional Services | $876 | $8,900 | 28% | 51 days |
| Marketing & Advertising | $743 | $15,200 | 24% | 58 days |
Velocity also scales predictably with company size:
| Company Revenue | Velocity ($/day) |
|---|---|
| $1M-$5M | $687 |
| $5M-$25M | $1,303 |
| $25M-$100M | $3,484 |
| $100M-$500M | $6,919 |
| $500M+ | $12,945 |
Cycle length correlates tightly with deal size. Deals under $1K close in about 25 days; $50K-$100K deals take 120 days; anything above $500K stretches to 270 days. If your cycle is significantly longer than these ranges for your ACV, that's your first diagnostic signal. In our experience, the gap between "where you are" and "where the benchmark says you should be" is almost always a data quality or qualification problem, not a selling problem.
Your velocity formula is only as good as the data feeding it. 72% of pipeline never closes because reps chase bad-fit contacts with wrong emails. Prospeo's 98% verified emails and 30+ ICP filters - including buyer intent, technographics, and headcount growth - let you fill the funnel with qualified opportunities only. That's how teams book 35% more meetings than Apollo users.
Stop inflating your pipeline with dead leads. Start with data that actually converts.
Find Your Bottleneck
Velocity is an aggregate number. To fix it, you need to know where deals stall.
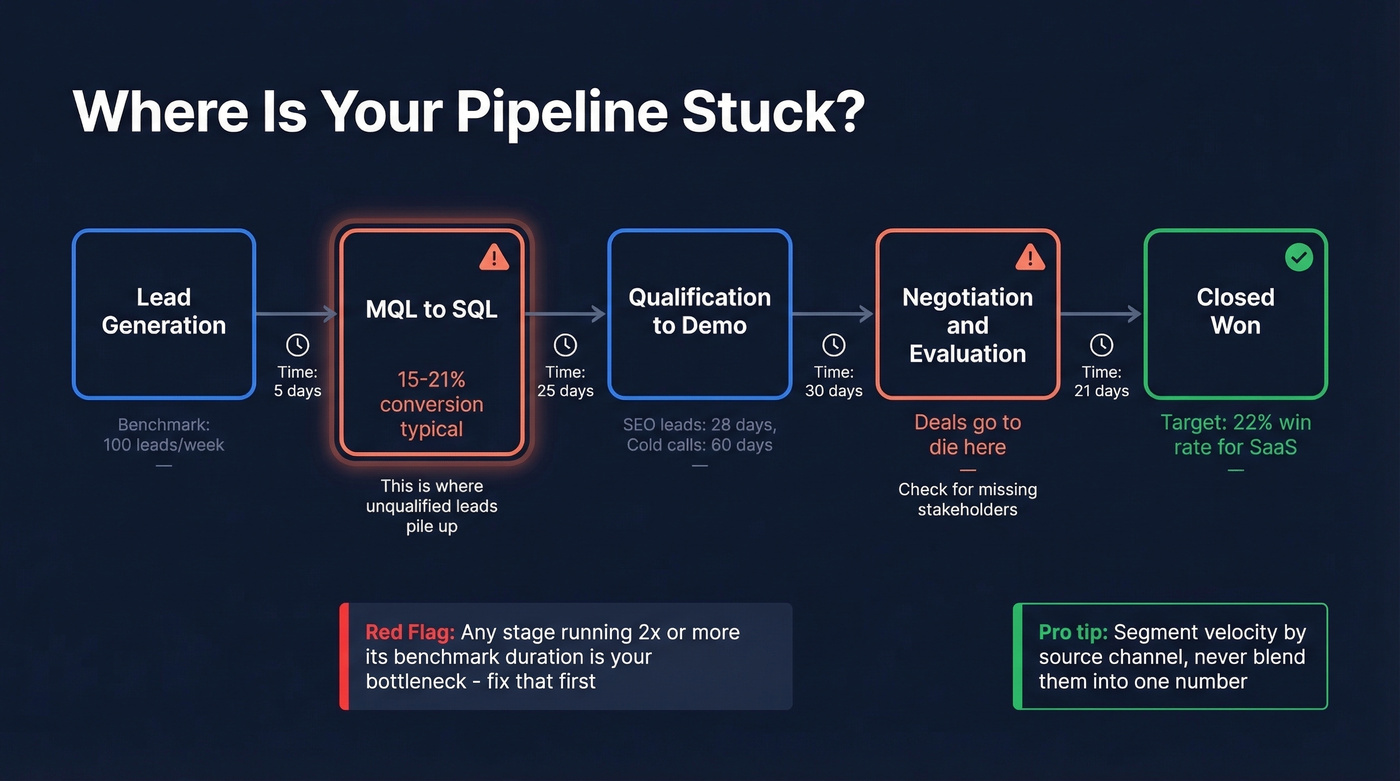
Use this diagnostic checklist - measure time-in-stage and compare against benchmarks:
- Map time-in-stage for every pipeline phase against industry averages
- Isolate your MQL-to-SQL conversion rate - many teams see just 15-21% here, and this is where unqualified leads pile up
- Segment velocity by source channel (SEO leads close in ~28 days; cold-call deals average 60 days)
- Flag any stage running 2x+ its benchmark duration - that's your bottleneck
If you're blending channels in a single velocity calculation, you're masking the real performance of each motion. RevOps practitioners on r/salesoperations frequently debate whether to include all open opportunities or only qualified ones in the formula. The answer is always qualified only. Anything else inflates your number and gives you false confidence.
How to Improve Each Lever
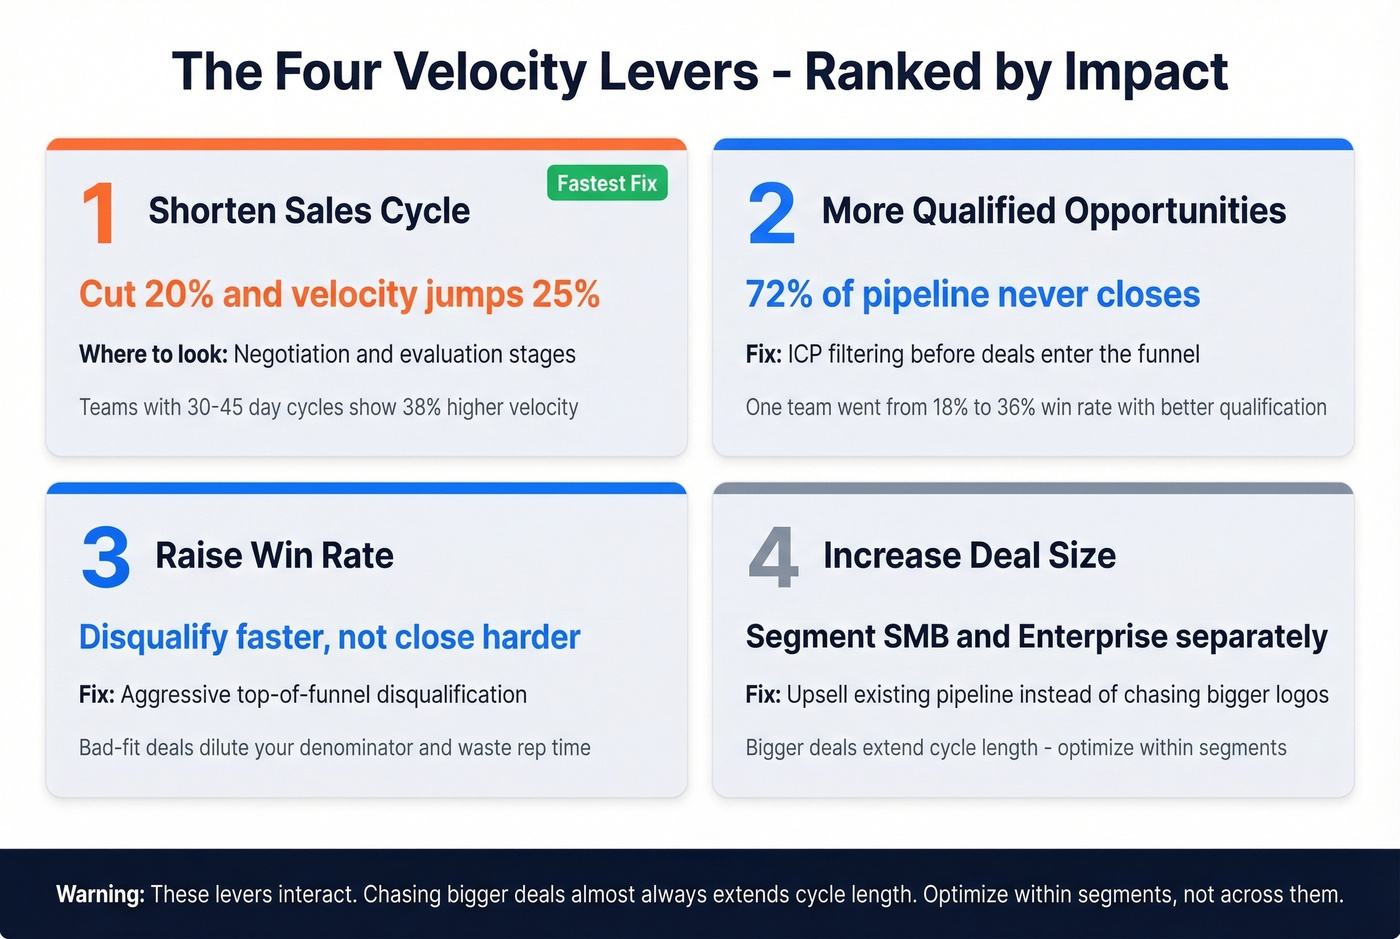
One caution before we get into specifics: these levers interact. Chasing bigger deals almost always extends cycle length. Optimize within segments, not across them.
More Qualified Opportunities
Adding more leads doesn't improve velocity if those leads aren't qualified. Full stop.
One anonymized SaaS case study found that 72% of pipeline was never going to close - the fix was ICP filtering before opportunities entered the funnel. Win rate jumped from 18% to 36% once bad-fit deals stopped diluting the denominator. That's not a marginal improvement; that's a completely different business.
Increase Deal Size
Segment your velocity calculation by deal size. Mixing SMB and enterprise deals in one number produces a meaningless average. Within each segment, focus on upsell and cross-sell into existing pipeline rather than chasing bigger logos - it's faster and doesn't extend your cycle.
Raise Win Rate
Here's the thing: the fastest way to raise win rate isn't better selling. It's faster disqualification. We've seen teams obsess over close techniques when the real problem is bad-fit opportunities clogging the pipeline. Disqualify aggressively at the top, and win rate takes care of itself.
Shorten Your Sales Cycle
Everyone obsesses over the numerator. The denominator is where most teams have the biggest, fastest gains.
Shorten your cycle by 20% and velocity jumps 25% - zero additional pipeline needed. Teams with 30-45 day cycles show 38% higher velocity compared to those running 76-90 day cycles. Census cut time-to-close by 40% using automated alerts that triggered on buying signals. Look at your negotiation and evaluation stages first - that's where deals go to die.
If your average contract value is under $15K, you don't need a longer sales cycle. You need a shorter one with fewer touchpoints. Most mid-market teams are running enterprise playbooks on SMB deals, and it's destroying their velocity.
Why Your Velocity Number Might Be Wrong
Velocity is only as accurate as the data feeding it. Three data hygiene rules most teams ignore:
Exclude stale opportunities. Anything with 90+ days of no activity is dead weight skewing your pipeline math. Kill it.
Handle outliers. One $500K deal in a pipeline averaging $15K distorts everything. Segment or exclude.
Use qualified date, not created date. If your CRM records opportunity creation before qualification, your cycle length is artificially inflated. This is the most common measurement mistake we see, and it makes teams think they're slower than they actually are.
If your bounce rate is running 30%+, your outreach volume and connect rate collapse, and your pipeline data gets noisy. Prospeo's Email Finder runs a 5-step verification process - including catch-all handling, spam-trap removal, and honeypot filtering - so bad records never enter your funnel in the first place.
Measuring Full-Funnel Velocity Weekly
Weekly measurement isn't optional. Organizations tracking velocity weekly saw 34% revenue growth and 87% forecast accuracy, compared to 11% growth and 52% accuracy for teams measuring ad-hoc. Build the dashboard once, review it every Monday.
Let's be honest - most teams build a velocity dashboard, look at it twice, then forget it exists. Don't be that team. Pin it to your Monday standup. Make it the first number your CRO sees each week.
Sales funnel velocity isn't a vanity metric. It's the single best predictor of whether your revenue engine is accelerating or stalling. Measure it weekly, fix the weakest lever first, and keep your pipeline data ruthlessly clean.
You just read that shortening cycle length by 20% boosts velocity by 25% - with zero additional pipeline. The fastest way to shorten cycles? Reach the right decision-maker on the first attempt. Prospeo gives you 125M+ verified mobile numbers with a 30% pickup rate and emails refreshed every 7 days - not the 6-week-old data that's adding ghost stages to your funnel.
Cut your sales cycle by reaching real buyers with fresh, verified contact data.
FAQ
Is sales funnel velocity the same as pipeline velocity?
Yes. Sales funnel velocity, pipeline velocity, and sales velocity all use the same formula: (Opportunities x Deal Size x Win Rate) / Cycle Length. The output is always dollars of revenue generated per day. The terms are interchangeable across CRMs and revenue platforms.
What's a good velocity number for a SaaS company?
Mid-market SaaS teams typically benchmark around $1,847/day with a 67-day cycle and 22% win rate. If you're below $1,000/day with similar deal sizes, cycle length or qualification is likely the bottleneck - not pipeline volume.
How often should I measure velocity?
Weekly. Teams tracking velocity weekly achieve 34% revenue growth and 87% forecast accuracy, versus 11% growth for teams that check ad-hoc. Set a recurring Monday dashboard review with your RevOps team.
How does bad contact data affect velocity?
Bounced emails and wrong numbers inflate cycle length and deflate win rate simultaneously. Snyk saw AE-sourced pipeline jump 180% after switching to verified data, dropping bounce rates from 35-40% to under 5%. Clean data is the fastest velocity fix most teams overlook.