Sales Funnel vs Marketing Funnel: Differences That Actually Matter
Nearly 70% of companies have never measured whether their sales funnel or marketing funnel actually works. They've got the diagrams - neat little triangles in their pitch decks - but no stage-by-stage conversion data to back them up. The funnel concept has been around since 1898, when St. Elmo Lewis sketched out the AIDA model). And yet, most teams still can't tell you where they're losing deals or why.
Here's the thing: most funnel guides are useless. They'll give you a textbook definition, a stock graphic, and zero numbers. Below you'll find real conversion benchmarks by industry, a pipeline velocity formula you can plug your own numbers into, and the specific alignment fixes that stop the "marketing says leads are qualified, sales says they're not" argument that every RevOps manager knows too well. If you take one thing from this article: stop optimizing stages you've never benchmarked.
Quick Summary
The marketing funnel attracts strangers and turns them into interested leads. The sales funnel takes those leads and turns them into paying customers. One is about demand creation; the other is about deal execution. The real problem isn't knowing the difference - it's that most companies have a CRM full of deal stages and no idea where conversion actually breaks down.
What Is a Marketing Funnel?
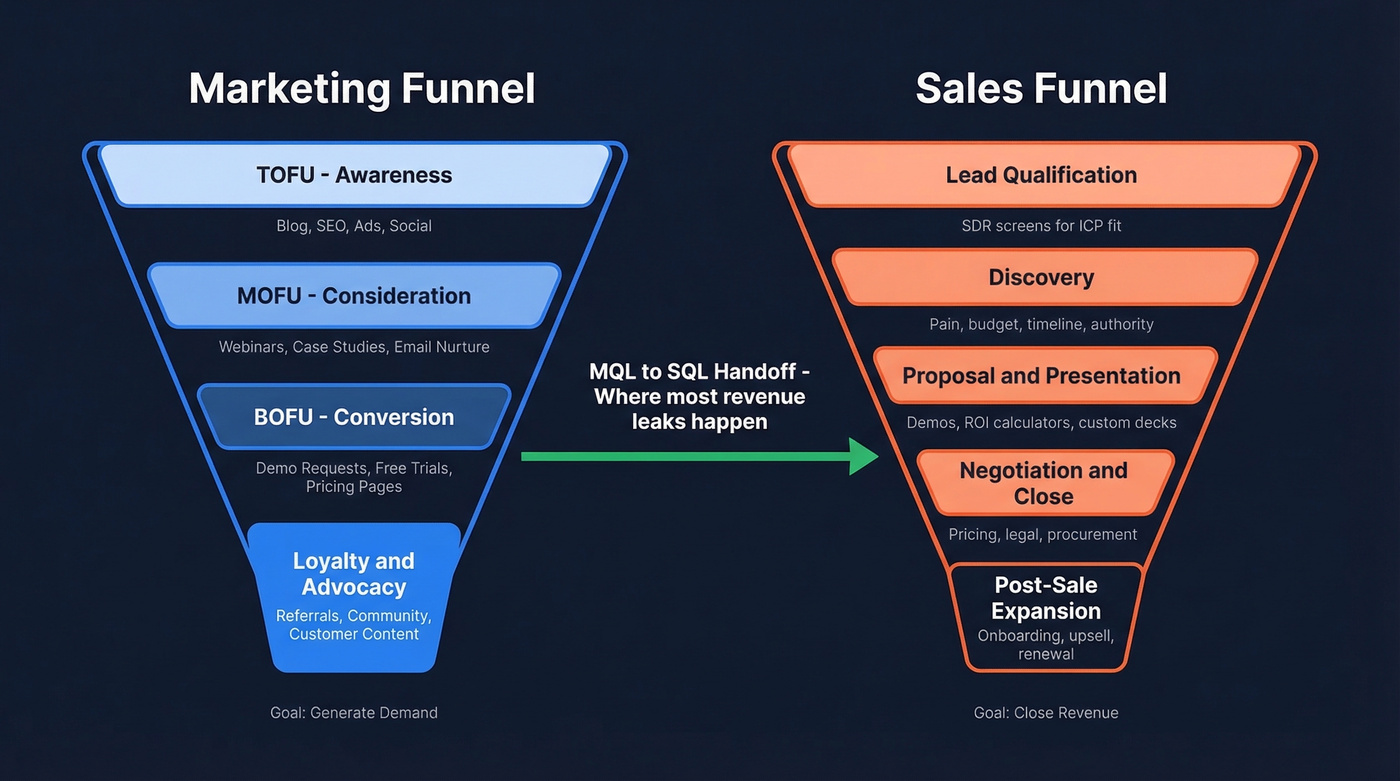
A marketing funnel maps the journey from "never heard of you" to "ready to talk to sales." It's the demand-generation engine - everything that happens before a rep gets involved.
A common framework breaks into four zones.
TOFU (Top of Funnel) is awareness: blog posts, social content, paid ads, SEO, podcasts. You're casting a wide net. The goal isn't conversions - it's reach and relevance. 96% of visitors aren't ready to buy on their first visit, so measuring revenue here misses the point entirely.
MOFU (Middle of Funnel) is consideration: webinars, case studies, comparison guides, email nurture sequences. Prospects know they have a problem and they're evaluating solutions. 70% of B2B buyers watch video during the buying process, making it a MOFU staple alongside gated content and live demos. This is where trust gets built, and where lazy teams lose the most ground because they stop producing content after the awareness stage and expect prospects to just figure it out on their own.
BOFU (Bottom of Funnel) is conversion: demo requests, free trials, pricing pages, sales-ready content. This is where marketing qualified leads (MQLs) get handed to sales.
Loyalty and advocacy is the stage most funnel diagrams forget. Marketing doesn't stop at the handoff. Customer newsletters, community programs, referral incentives, and case study requests all keep existing buyers engaged - and turn them into your best acquisition channel.
The AIDA framework - Attention, Interest, Desire, Action - maps cleanly onto these stages, and it's still a common mental model marketers use whether they realize it or not. Key metrics here are reach, engagement, cost per lead, and MQL volume. Marketing typically owns this entire journey, and the output is a pipeline of leads that sales can actually work.
What Is a Sales Funnel?
The sales funnel picks up where marketing leaves off. It starts with a qualified lead and ends with a signed contract (and ideally, a renewal).
The stages look different from marketing's neat TOFU/MOFU/BOFU breakdown.
Lead qualification is the entry gate - an SDR or AE determines whether the MQL actually fits your ICP and has buying authority. This is where the lead becomes a sales qualified lead (SQL). Discovery is the diagnostic call: understanding the prospect's pain, budget, timeline, and decision-making process. These two stages are where reps earn or lose the deal, and most reps rush through discovery because they're eager to pitch.
Proposal and presentation is where you make the case - demos, ROI calculators, custom decks. Negotiation covers pricing discussions, legal review, procurement hoops. Close is the signature.
Post-sale - often forgotten - includes onboarding, expansion, and renewal. The probability of selling to an existing customer is 60-70%, compared to 5-20% for a new prospect. Skipping this stage is leaving the easiest revenue on the table.
The ownership distinction matters. Marketing generates demand; sales converts it. When these responsibilities blur without clear handoff rules, leads fall through cracks. The metrics shift too: pipeline velocity, win rate, average deal size, and sales cycle length replace the marketing metrics from earlier stages.
68% of companies haven't even identified their sales funnel, let alone measured it.
Key Differences at a Glance
| Dimension | Marketing Funnel | Sales Funnel |
|---|---|---|
| Goal | Generate demand | Close revenue |
| Stages | Awareness, Consideration, Conversion, Loyalty | Qualification, Discovery, Close, Expansion |
| Ownership | Marketing team | Sales team |
| Key metrics | CPL, MQLs, engagement | Win rate, deal size, velocity |
| Timeframe | Weeks to months | Days to quarters |
| Primary tools | CMS, ads, email automation | CRM, dialer, sequencer |
The table makes it look clean. Reality is messier. The handoff between these two funnels - the MQL-to-SQL transition - is where most revenue leaks happen. Marketing says they sent 500 leads. Sales says 400 were garbage. Neither team is wrong; they just don't share a definition of "qualified." Ask any RevOps manager what their biggest headache is, and this exact argument comes up every time.
The MQL-to-SQL handoff breaks when sales can't reach the leads marketing sends over. Prospeo delivers 98% verified emails and 125M+ direct dials so every qualified lead that enters your sales funnel actually gets a conversation - not a bounce.
Fix the handoff. Give sales contacts that actually connect.
How Funnels Differ: B2B vs B2C
The funnel framework applies to both B2B and B2C, but the shape, speed, and psychology are fundamentally different.
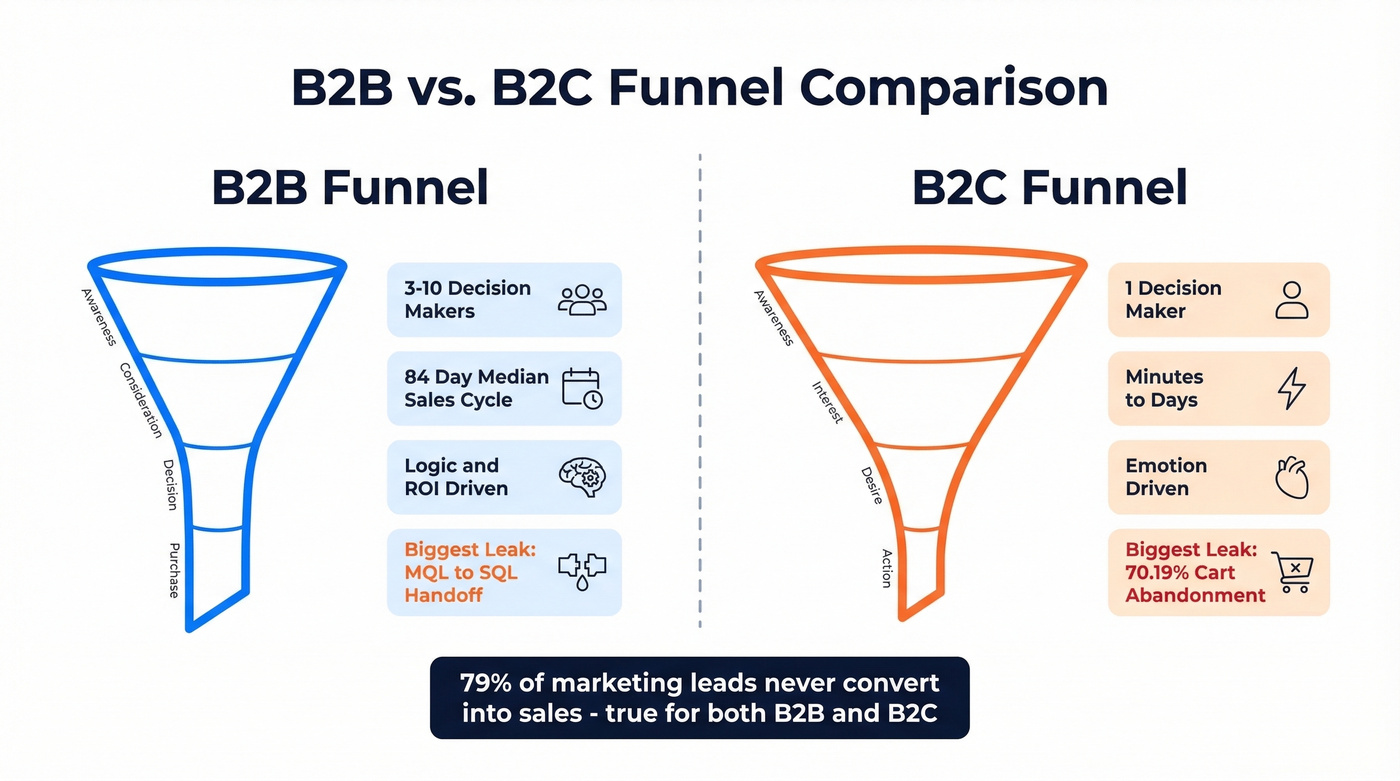
| Dimension | B2B | B2C |
|---|---|---|
| Buyer psychology | Logic/ROI-driven | Emotion-driven |
| Decision-makers | 3-10 stakeholders | Usually 1 person |
| Sales cycle | Median 84 days | Minutes to days |
| TOFU shape | Narrow, targeted | Wide, mass-market |
| Content style | In-depth, educational | Crisp, visual, catchy |
| Biggest leak | MQL to SQL handoff | Cart abandonment |
A cybersecurity vendor targeting CISOs might spend months nurturing a single enterprise account, building a buyer persona for each stakeholder on the buying committee. A DTC skincare brand can convert the same customer in minutes with a clean product page, strong social proof, and a compelling offer. Same funnel concept, completely different execution.
B2B funnels are narrow at the top by design. You're targeting specific companies, roles, and buying signals. The median B2B SaaS deal takes 84 days to close, and enterprise deals run longer because you're navigating procurement, legal, and multiple stakeholders who all need to say yes.
B2C funnels are the opposite: wide top, fast progression, emotion-driven decisions. The biggest conversion killer is cart abandonment at 70.19%. Nearly three out of four shoppers add something to their cart and walk away. The fix is usually UX and urgency, not more nurture emails.
One stat that applies to both: 79% of marketing leads never convert into sales. Whether you're selling SaaS or sneakers, most of your top-of-funnel effort doesn't translate to revenue. That's not a failure - it's the nature of funnels. The question is whether you know where the drop-off happens.
Funnel Conversion Benchmarks
This is the section most funnel guides skip, and it's the one you actually need.
Industry Benchmarks
Data from First Page Sage's conversion benchmark report gives us stage-by-stage rates across industries:
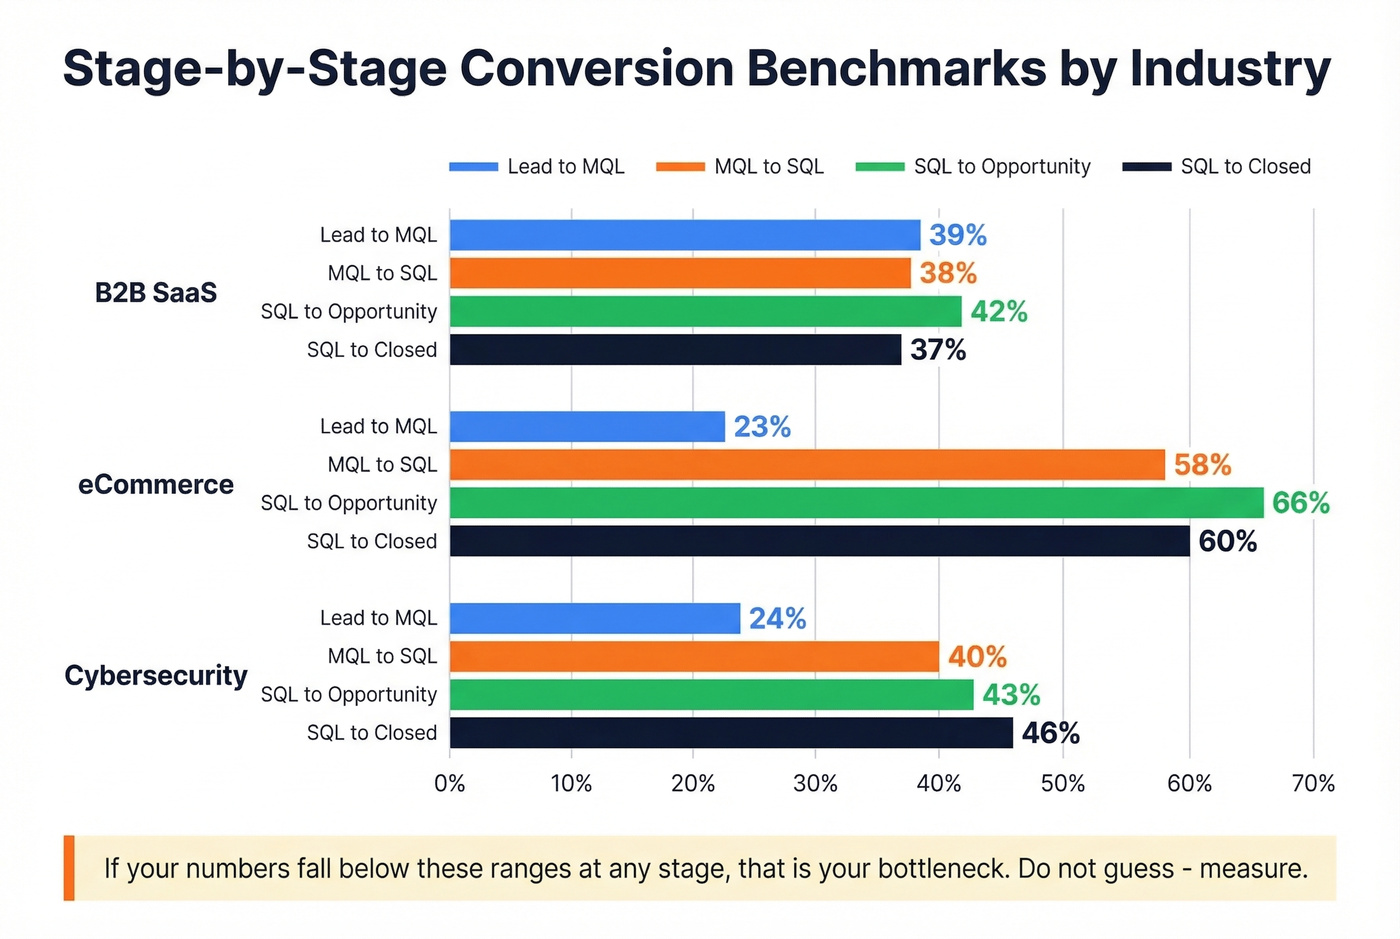
| Industry | Lead to MQL | MQL to SQL | SQL to Opp | SQL to Closed |
|---|---|---|---|---|
| B2B SaaS | 39% | 38% | 42% | 37% |
| eCommerce | 23% | 58% | 66% | 60% |
| Cybersecurity | 24% | 40% | 43% | 46% |
These are post-visitor benchmarks - they don't include the visitor-to-lead conversion, which is much lower.
Quick Reference Ranges
For teams that don't fit neatly into one industry, VWO's benchmark data provides useful guardrails:
- Visitor to Lead: 1-5%
- Lead to MQL: 25-35%
- MQL to SQL: 13-26%
- SQL to Opportunity: 50-62%
- Opportunity to Closed Won: 15-30%
If your numbers fall below these ranges at any stage, that's your bottleneck. Don't guess - measure.
Pipeline Velocity: The Unifying Metric
Pipeline velocity combines all the funnel variables into one number: (Opportunities x Avg Deal Value x Win Rate) / Sales Cycle Length.
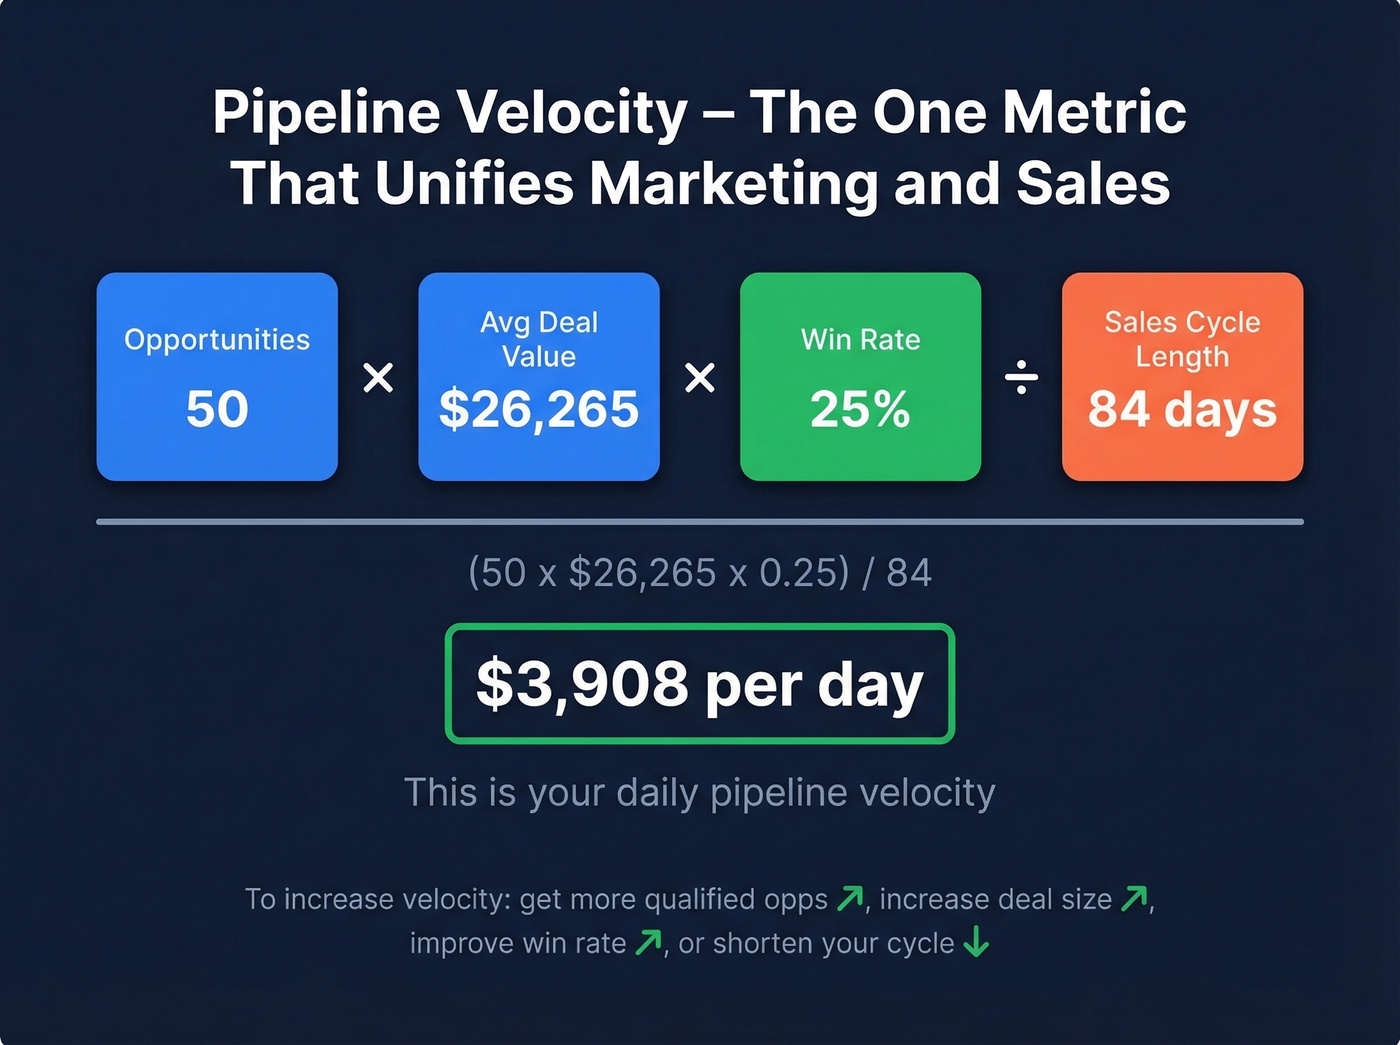
Here's a worked example using median B2B SaaS benchmarks. Say you've got 50 opportunities, a median deal size of $26,265, a 25% win rate, and an 84-day cycle. That's (50 x $26,265 x 0.25) / 84 = $3,908/day in pipeline velocity. Now you've got a single number to optimize against, and every team - marketing and sales - can see how their work affects it.
We've seen teams obsess over visitor-to-lead conversion when their real bottleneck is MQL to SQL. The pipeline velocity formula forces you to look at the whole picture instead of one vanity metric.
Channel Matters Too
Not all leads are created equal. SEO-sourced leads convert from MQL to SQL at 51%, while PPC leads convert at just 26%. That's a 2x difference from the same funnel stage. If you're pouring budget into paid channels without measuring downstream conversion, you're optimizing the wrong thing.
Funnel Mistakes That Kill Conversions
No shared MQL/SQL definition
If marketing and sales don't agree on what "qualified" means, every handoff becomes an argument. Write it down. A lead scoring model with explicit thresholds - job title, company size, engagement signals - eliminates the "these leads are garbage" conversation.
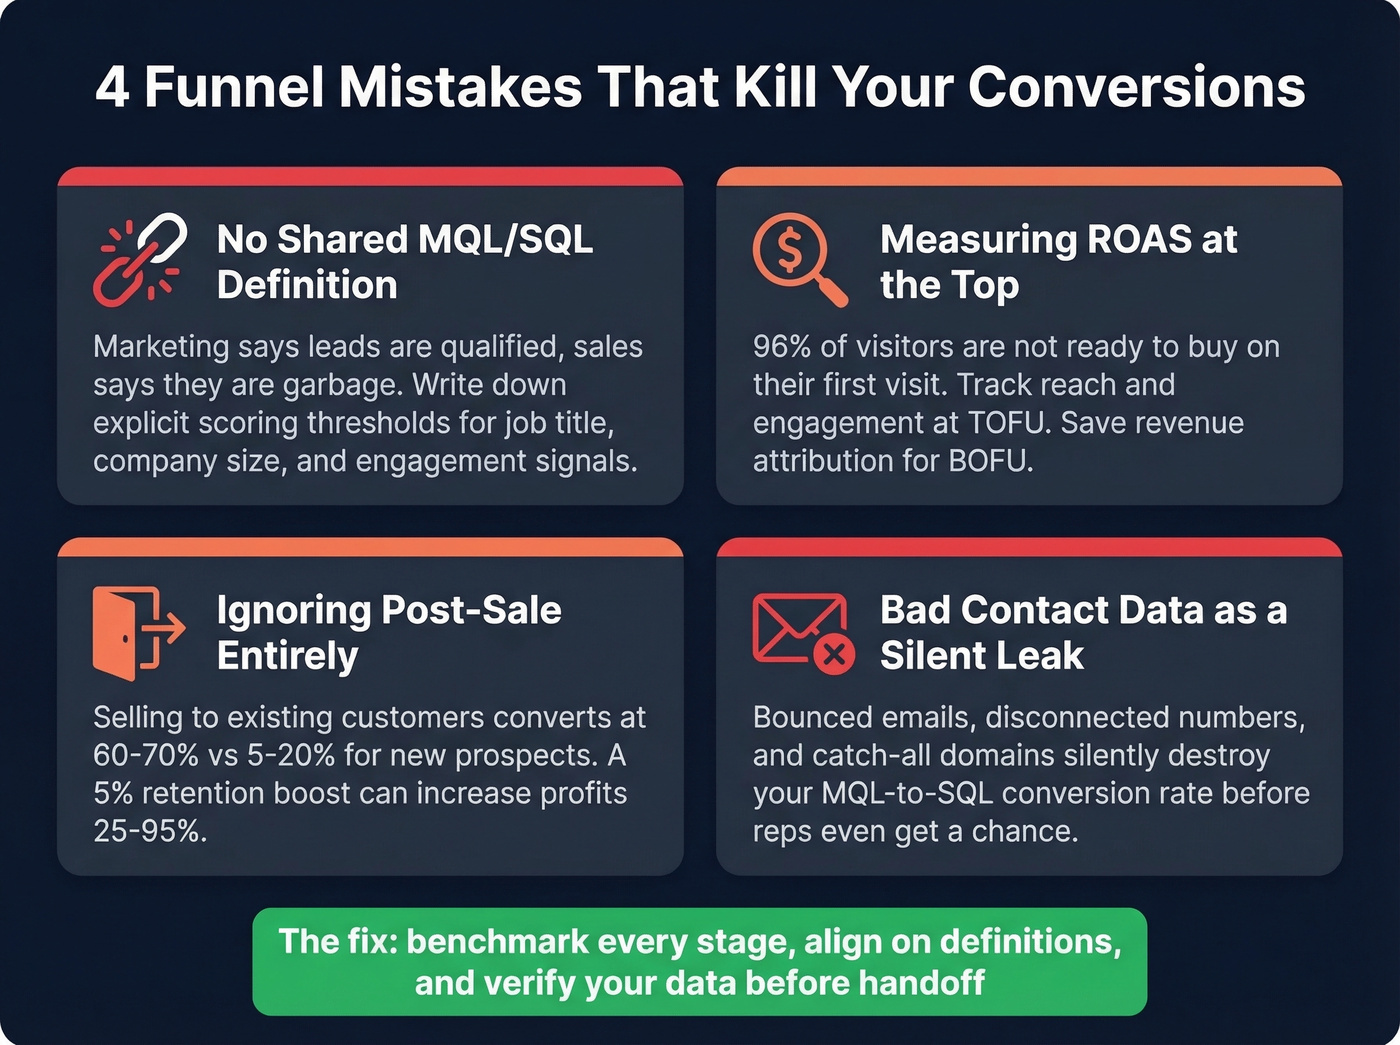
Measuring ROAS at the top
TOFU exists to create awareness, not close deals. Measuring return on ad spend at the awareness stage is like judging a first date by whether they proposed. 96% of visitors aren't ready to buy on their first visit. Track reach, engagement, and content consumption at the top. Save revenue attribution for BOFU.
Ignoring post-sale entirely
Acquiring a new customer costs 5-7x more than retaining one. A 5% increase in retention can boost profits by 25-95%. Yet most funnel diagrams end at "closed won" as if the customer disappears.
Bad contact data as a silent leak
Let's walk through a scenario we've seen play out dozens of times. You run a webinar, generate 500 leads, and hand them to your SDR team. Reps start dialing and emailing. Forty voicemails go to disconnected numbers. Ten emails bounce. Another 30 go to catch-all domains that silently eat your messages. By the time you measure MQL-to-SQL conversion, it looks broken - but the funnel isn't the problem. The data is.
This is where data quality becomes a funnel variable. Prospeo's 98% email accuracy and 7-day refresh cycle mean your reps actually reach the people marketing generated. When MQL-to-SQL looks broken, the fix often isn't a better funnel diagram - it's better data feeding the funnel you already have.
One-step checkout losing conversions
This one's B2C-specific but too common to skip. A two-step checkout process can improve conversions by 20-40% compared to cramming everything onto one page. If you're running ecommerce and haven't split your checkout flow, that's likely your biggest quick win.
How to Align Your Funnels
Your VP of Sales told the CEO that marketing leads are garbage. Your VP of Marketing pulled up the dashboard showing 2,000 MQLs delivered last quarter. Both are right. The leads were generated; they just weren't qualified, timed, or followed up correctly. This is an alignment problem, not a volume problem.
Only 22% of companies feel marketing and sales are tightly aligned. The other 78% are leaking 10%+ of annual revenue due to poor cross-team coordination.
If your average deal is under $15k, you probably don't need a complex funnel at all. A tight ICP definition, verified contact data, and a three-email sequence will outperform a 14-stage nurture campaign every time. Complexity is a luxury for teams with the headcount to manage it.
Walk the Funnel Like a Customer
Pick a recent closed-won deal and trace the entire journey. When did the prospect first engage? What content did they consume? When did marketing hand them off? How long before sales followed up? Where were the delays? In our experience, the teams that fix alignment fastest are the ones that start with this exercise - not a new tool or a reorg.
The SLA That Makes It Work
An SLA between marketing and sales isn't optional at scale. The best ones cover:
- MQL/SQL definitions with explicit criteria, not vibes
- Handoff triggers that specify what action moves a lead from marketing to sales
- Sales response time of 24 hours max for inbound leads
- Minimum touch cadence before a lead gets recycled
- Shared metrics like pipeline velocity and stage conversion rates
- Weekly pipeline reviews and feedback loops where sales tells marketing which leads converted and why
Pipeline velocity is the unifying metric. It's the one number both teams can rally around because it incorporates marketing's lead quality, sales' close rate, and the cycle length that both teams influence. When velocity goes up, everyone wins.
Are Funnels Dead?
No. Incomplete.
Every few years, someone declares the funnel dead. They're wrong, but they're onto something.
The funnel is linear. Real buyer journeys aren't. Google's "Messy Middle" research showed that buyers loop between exploration and evaluation repeatedly before making a decision. They don't march neatly from awareness to consideration to purchase. They Google, compare, forget, come back, read a review, ask a colleague, and then maybe - maybe - fill out a demo form.
The flywheel model - Attract, Engage, Delight - addresses this by putting the customer at the center instead of the sale. The power source isn't marketing spend; it's customer satisfaction and referrals. The probability of selling to an existing customer is 60-70%, compared to 5-20% for a new prospect.
So the funnel isn't dead. It just ends too early. The best teams use both: funnels for measuring stage-by-stage conversion, and the flywheel for strategic thinking about retention, expansion, and advocacy. They're complementary frameworks, not competing ones.
Understanding the sales funnel vs marketing funnel distinction still matters - not because the models are perfect, but because they give you measurable stages to diagnose where revenue stalls. Pair that measurement discipline with a flywheel mindset, and you've got a system that actually scales.
68% of companies haven't identified their sales funnel - and even fewer have the data to fill it. Prospeo's 30+ filters let you target by buyer intent, job changes, and headcount growth so the right prospects enter your pipeline from day one. At $0.01 per email, benchmarking every stage finally makes economic sense.
Stop optimizing stages you can't fill with real buyers.
FAQ
What's the difference between a sales pipeline and a sales funnel?
A pipeline tracks deals from your sales team's perspective - stages like "proposal sent" or "negotiation." A funnel models the buyer's journey from awareness to purchase. Pipelines are internal workflow tools; funnels map customer behavior. Most CRMs show you a pipeline view. Understanding the funnel requires journey mapping across both marketing and sales touchpoints.
Can one team own both funnels?
In companies under 10-15 people, yes - and it often works better than splitting ownership prematurely. Alignment breaks down at scale. The fix isn't merging teams; it's a shared SLA with defined MQL/SQL criteria and handoff triggers. RevOps teams increasingly bridge the gap, owning data and metrics while marketing and sales own execution.
How do you fix a leaky funnel fast?
Measure stage-to-stage conversion rates first - most teams haven't. The three fastest wins: tighten your MQL definition so sales stops rejecting 80% of leads, verify contact data before handoff so reps aren't wasting touches on dead emails and disconnected numbers, and enforce a 24-hour follow-up SLA on inbound leads.
Do B2C companies need separate funnels?
Most B2C brands operate a single combined funnel since one person handles both awareness and purchase. The critical split happens in B2B, where marketing nurtures over weeks or months before handing off to sales. B2C teams should focus on reducing cart abandonment (70.19% average) rather than building elaborate multi-funnel architectures.