Sales Performance in 2026: Benchmarks, Formulas & Playbook
Reps spend 60% of their time on non-selling tasks. Sales cycles keep stretching. And leadership still expects the same pipeline coverage from the same headcount. Sales performance isn't a motivation problem - it's a systems problem. Here's how to diagnose it, measure it, and fix it.
TL;DR - What You Need
Track five metrics, not thirty: win rate, sales velocity, pipeline coverage, quota attainment, and CAC payback. These cover both leading and lagging indicators across the full funnel.
Fix your data layer before investing in AI or coaching. If reps work off stale contacts and bounced emails, no amount of enablement changes outcomes.
Shift from lagging indicators (closed revenue) to leading indicators (activities, pipeline creation, stage conversion). You'll catch problems two quarters earlier - the difference between a course correction and a missed year.
What Sales Performance Really Means
Most articles define it as "how well your team sells." That's not wrong, but it's useless.
Sales performance is the system connecting inputs to outcomes - the full chain from rep activity, to pipeline creation, to conversion, to revenue, to efficiency. Activity is what reps do. Results are what happens. Performance is the system that determines whether activity reliably produces results. When that system breaks - bad data, misaligned quotas, leaky funnel stages, undertrained reps - you don't just miss a quarter. You misdiagnose why you missed it.
Metrics That Matter (by Role)
When teams monitor everything, they act on nothing. That's Highspot's line, and it's dead right. Pick five to eight metrics that drive decisions for each role.
Role-Based Metric Selection
SDRs should be measured on activity volume and qualified meeting output - calls per day, emails sent, meetings booked, meetings booked, and MQL-to-SQL conversion. Don't measure SDRs on closed revenue. They can't control it, and it warps incentives.
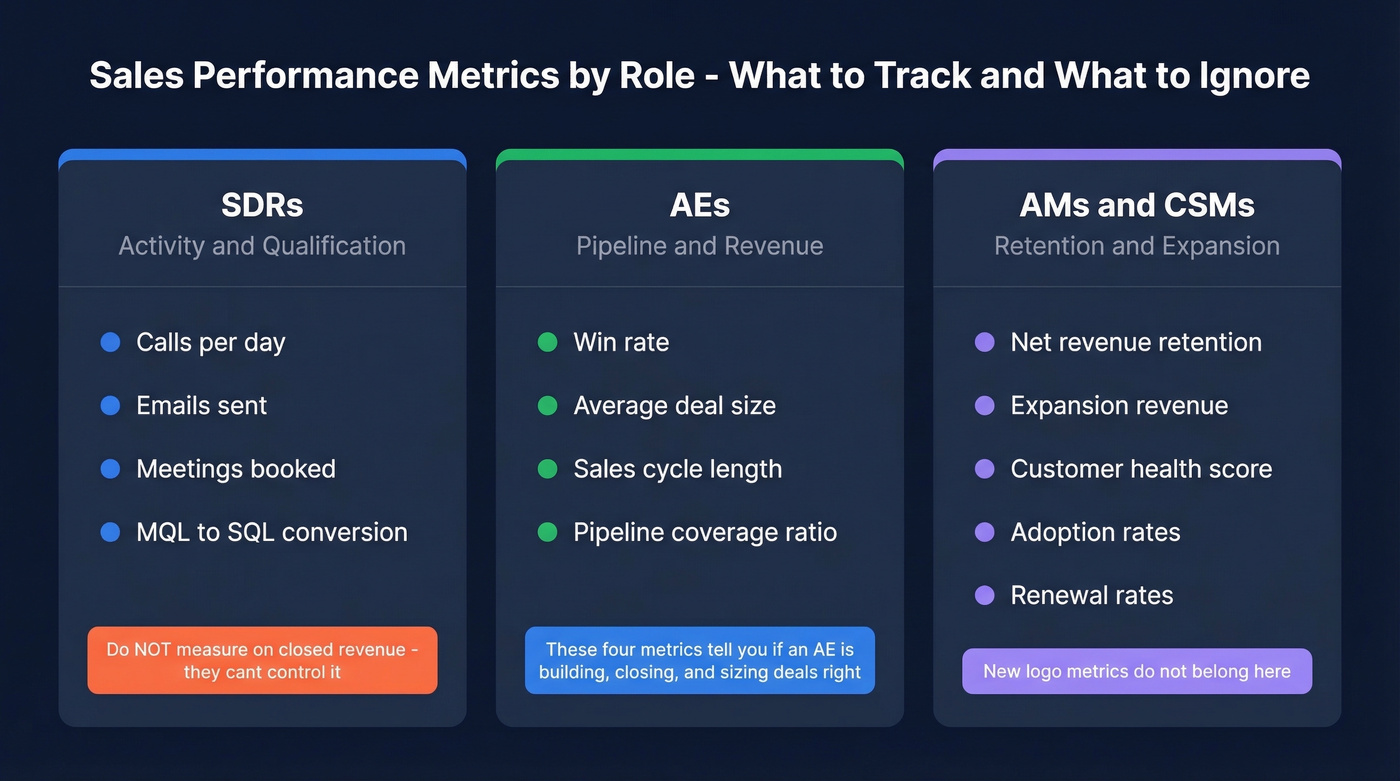
AEs own pipeline creation and closed revenue. Track win rate, average deal size, sales cycle length, and pipeline coverage ratio. Those four tell you whether an AE is building enough pipe, closing efficiently, and doing it at the right deal sizes.
Account Managers and CSMs live in retention and expansion territory. Net revenue retention, expansion revenue, customer health scores, adoption rates, and renewal rates matter more than new logo metrics.
Core Formulas With 2026 Benchmarks
| Metric | Formula | Benchmark |
|---|---|---|
| Win Rate | Deals won / Total deals | ~20% average; ~30% for high performers |
| Sales Velocity | (Opps x Deal value x Win rate) / Cycle length | Trend your own baseline weekly |
| Sales Efficiency | Revenue / Sales investment | 1-3x is healthy |
| CAC Payback | CAC / monthly gross profit per customer | B2B SaaS: 12-24 months |
| CLV (LTV) | Avg deal size x Avg customer lifetime | Target ~3:1 LTV:CAC |
| B2B Conversion (lead to customer) | (Customers / Total leads) x 100 | ~2.9% median B2B |
A quick sales velocity example: 50 qualified opportunities, $25,000 average deal value, 22% win rate, 90-day cycle. That's (50 x $25,000 x 0.22) / 90 = $3,056 per day. Now you can improve it by pulling specific levers - more opportunities, larger deals, higher win rate, or shorter cycles.
Funnel Stage Benchmarks
This is where most teams discover their real problem. The MQL-to-SQL conversion is the biggest leak in nearly every B2B funnel.
| Stage | Conversion Rate | What to Watch |
|---|---|---|
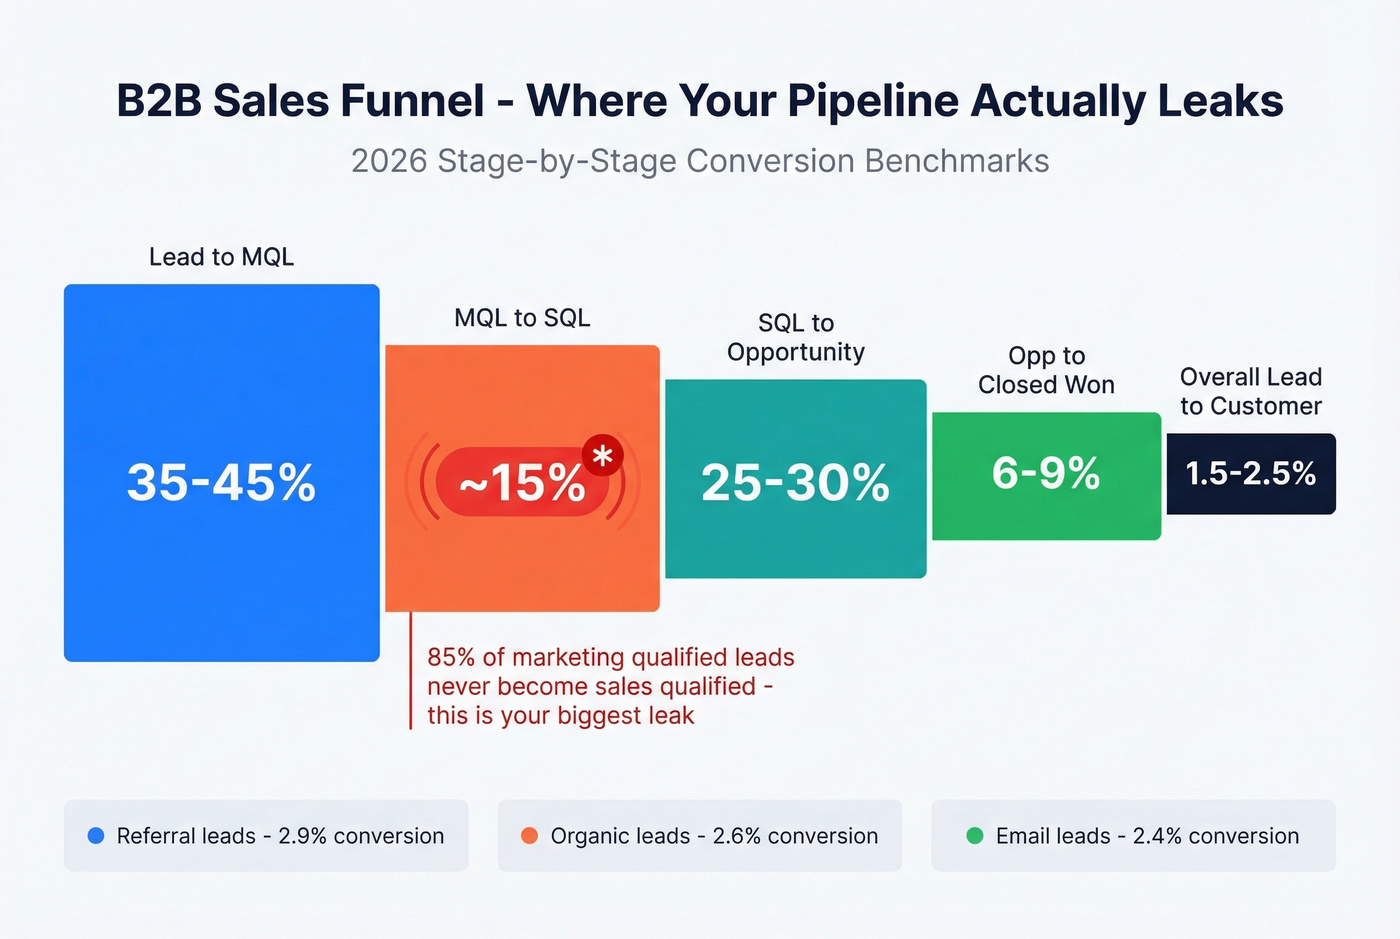
| Lead to MQL | 35-45% | Lead source quality |
| MQL to SQL | ~15% | Qualification criteria |
| SQL to Opportunity | 25-30% | Discovery call quality |
| Opp to Closed-Won | 6-9% | Multi-threading depth |
| Overall Lead to Customer | 1.5-2.5% | Full-funnel health |
That 15% MQL-to-SQL number should keep you up at night. It means 85% of "marketing qualified" leads never become sales qualified - either your qualification criteria are wrong, your lead sources are weak, or your SDRs aren't equipped to convert. Channel matters too: referral leads convert at roughly 2.9%, organic at around 2.6-2.7%, and email at 2.4%. Where your leads originate shapes what "good" looks like.
Industry Conversion Rates
| Industry | Conversion Rate |
|---|---|
| Legal Services | ~7.4% |
| Professional Services | 4.0-6.0% |
| Industrial/Wholesale | 3.5-4.5% |
| Healthcare | 3.0-4.0% |
| Finance/Banking | 3.0-4.0% |
| Manufacturing | 3.0-5.0% |
| B2B E-commerce | ~1.8% |
| B2B SaaS | 1.1-7.0% |
The SaaS range spans self-serve PLG motions (high volume, low conversion) to enterprise sales (low volume, higher conversion). Know which motion you're running before benchmarking.
Where Performance Breaks Down
Picture this: it's QBR time. Pipeline coverage is 2.1x against a 3x target. MQL-to-SQL conversion dropped from 18% to 11% over two quarters. Revenue is still okay - but only because your top AEs are closing bigger deals to compensate. That's not performance. That's a house of cards.
The Non-Selling Time Problem
57% of sales professionals say the sales cycle is getting longer, and reps spend 60% of their time on non-selling tasks - data entry, CRM hygiene, researching contacts, chasing down phone numbers. You can't ask reps to close more in longer cycles while giving them less actual selling time. And 73% of B2B buyers actively avoid sellers who send irrelevant outreach, so the time reps do spend selling had better target the right people with the right message.
Leading vs. Lagging Indicators
Revenue is a lagging indicator. By the time you see it drop, the damage happened two quarters ago.
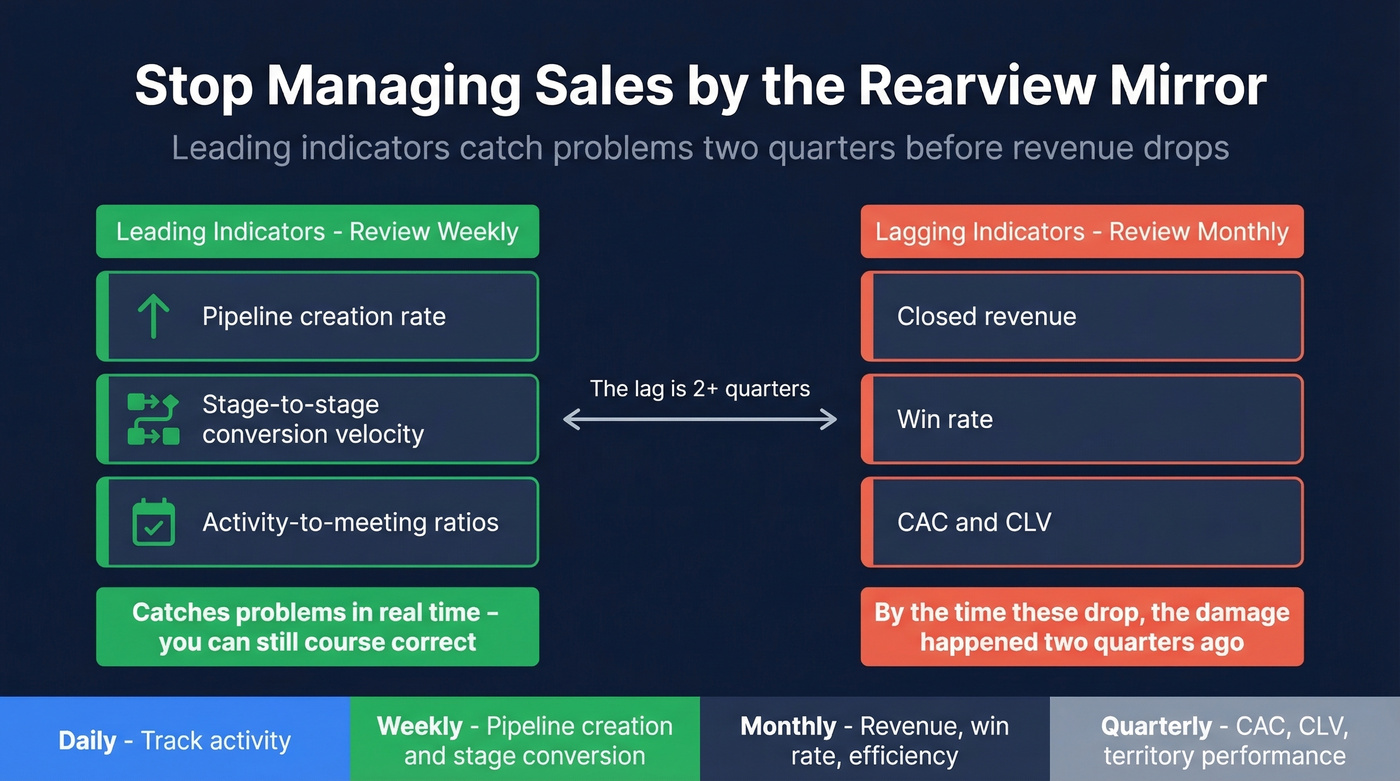
The leading indicators that predict revenue problems are pipeline creation rate, stage-to-stage conversion velocity, and activity-to-meeting ratios. We've seen teams run entire quarters off revenue dashboards, only to realize in Q3 that pipeline creation collapsed in Q1. By then, there's no recovery. Build your cadence around weekly leading indicator reviews and monthly lagging indicator analysis. Daily: track activity. Weekly: pipeline creation and stage conversion. Monthly: revenue, win rate, and efficiency. Quarterly: zoom out to CAC, CLV, and territory performance.
The Data Quality Tax
Here's a scenario we see constantly: your top AE spent three hours researching contacts for a target account. She found an email on an old conference attendee list, guessed at a phone number format, and sent a sequence to six people - three of whom had left the company. That's not a productivity problem. That's a data quality tax.
Bad contact data - bounced emails, wrong numbers, outdated titles - silently degrades every metric in your stack. Pipeline coverage drops because reps can't reach enough of the right people. Conversion rates fall because outreach lands in dead inboxes. Sales velocity slows because reps waste hours on research instead of conversations. Snyk's team of 50 AEs was spending 4-6 hours per week just prospecting, and their bounce rate sat at 35-40%. After switching to Prospeo's verified data (143M+ emails at 98% accuracy, refreshed every 7 days), bounce rates dropped below 5% and AE-sourced pipeline jumped 180%. That's a structural fix, not a marginal improvement.

Bad data is the silent killer of every metric on this page. Bounced emails tank conversion rates. Wrong numbers destroy sales velocity. Stale contacts waste the hours reps should spend selling. Prospeo's 143M+ verified emails at 98% accuracy - refreshed every 7 days - eliminate the data quality tax dragging your performance down.
Fix your data layer first. Every metric improves after that.
How to Improve Results Across the Org
Diagnosing problems is the easy part. Here's the playbook for fixing them.
Quota and Compensation Design
If fewer than 75% of your reps hit quota, the problem is your quota - not your reps.
A common SaaS heuristic sets quota at roughly 5x OTE, with a range of 2-10x depending on deal size and cycle length. Quota attainment across B2B typically runs around 40-60%. Below 40%, your quotas are aspirational fiction. Above 70%, you're probably leaving money on the table. 47% of sales organizations cite market uncertainty as their top compensation challenge, and only 30% say their comp strategy is prepared for economic volatility. Treat planning as a continuous process across four levers: capacity planning, quota management, territory design, and incentive compensation. Adjust quarterly, not annually.
Here's the thing: most sales orgs set quotas annually, argue about them for six weeks, then never touch them again. If your market shifts mid-year and you don't adjust quotas, you're not running a performance system - you're running a lottery.
Sales cycle length benchmarks by deal size give you a sanity check. SMB deals typically close in 30-60 days, mid-market in 60-120 days, and enterprise in 6-18 months. If your cycles run significantly longer than these ranges, your demo-to-close ratio will tell you where deals stall.
Coaching That Changes Behavior
Most sales coaching is feedback disguised as coaching. "You need to do more discovery" isn't coaching - it's an observation.
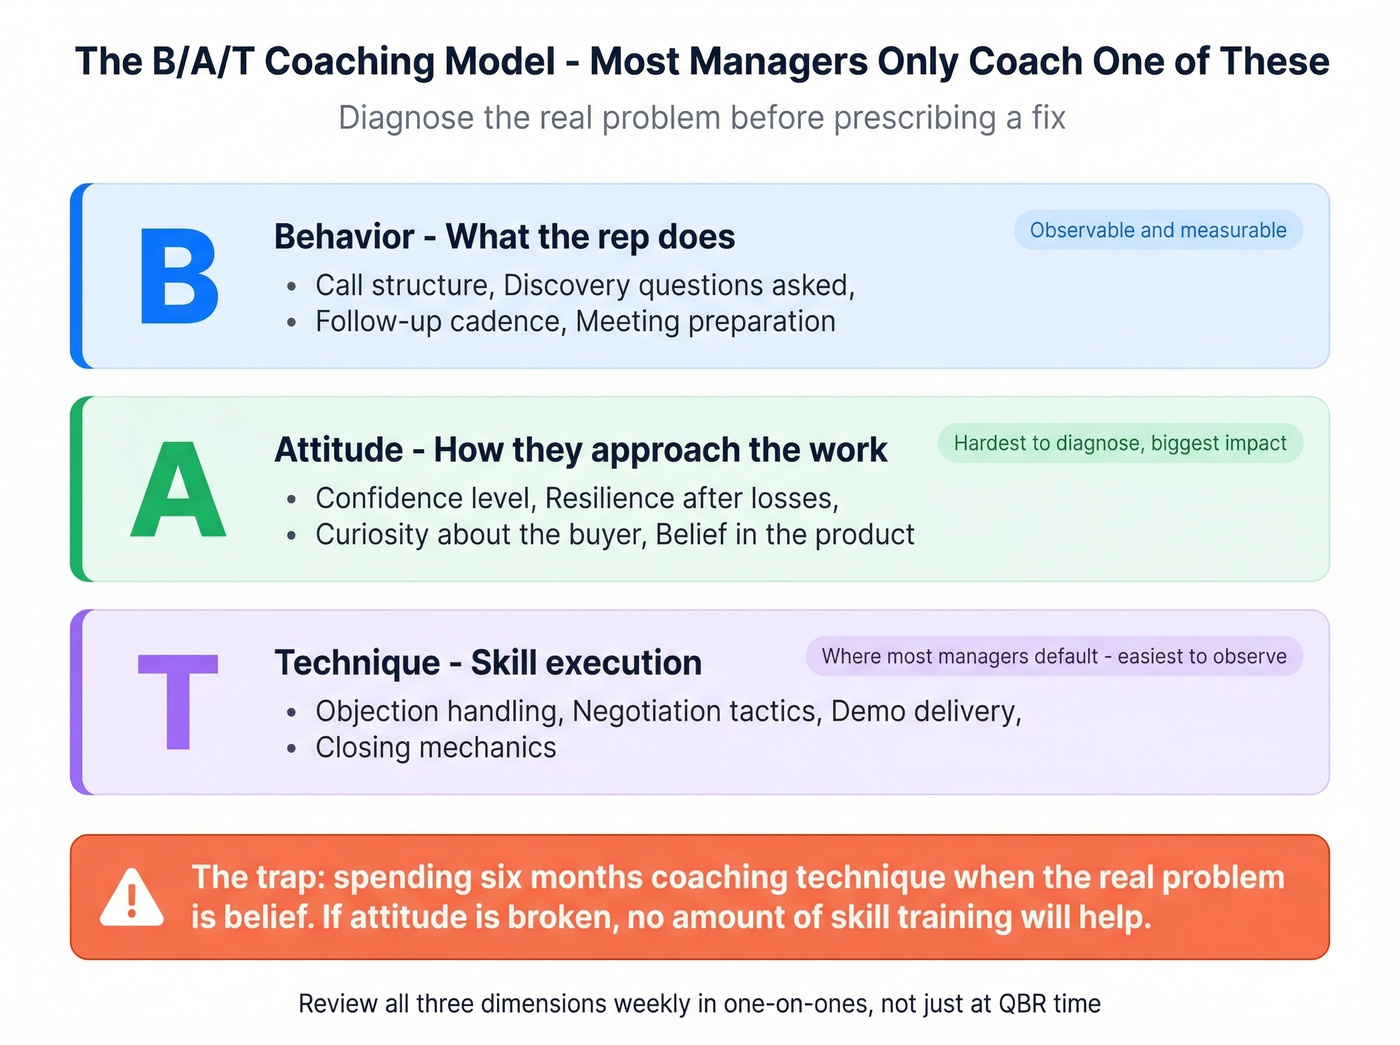
The B/A/T model gives you a better framework. Behavior is what the rep does: call structure, discovery questions, follow-up cadence. Attitude is how they approach the work: confidence, resilience, curiosity. Technique is skill execution: objection handling, negotiation, demo delivery. Most managers default to technique coaching because it's easiest to observe. But if a rep's attitude is shot - they don't believe in the product, they're burned out - no amount of technique coaching will help.
Let's be honest: ask any sales leader on r/sales about coaching underperformers and you'll hear the same refrain. "I spent six months coaching technique when the real problem was belief." Build individual scorecards tracking all three dimensions and review them weekly in one-on-ones, not just at QBR time.
Methodology and Buyer Enablement
The KARE account model - Keep, Attain, Recapture, Expand - gives reps a simple framework for prioritizing their book. "Keep" accounts need retention plays. "Attain" accounts need prospecting. "Recapture" means win-back campaigns. "Expand" is upsell and cross-sell into existing logos.
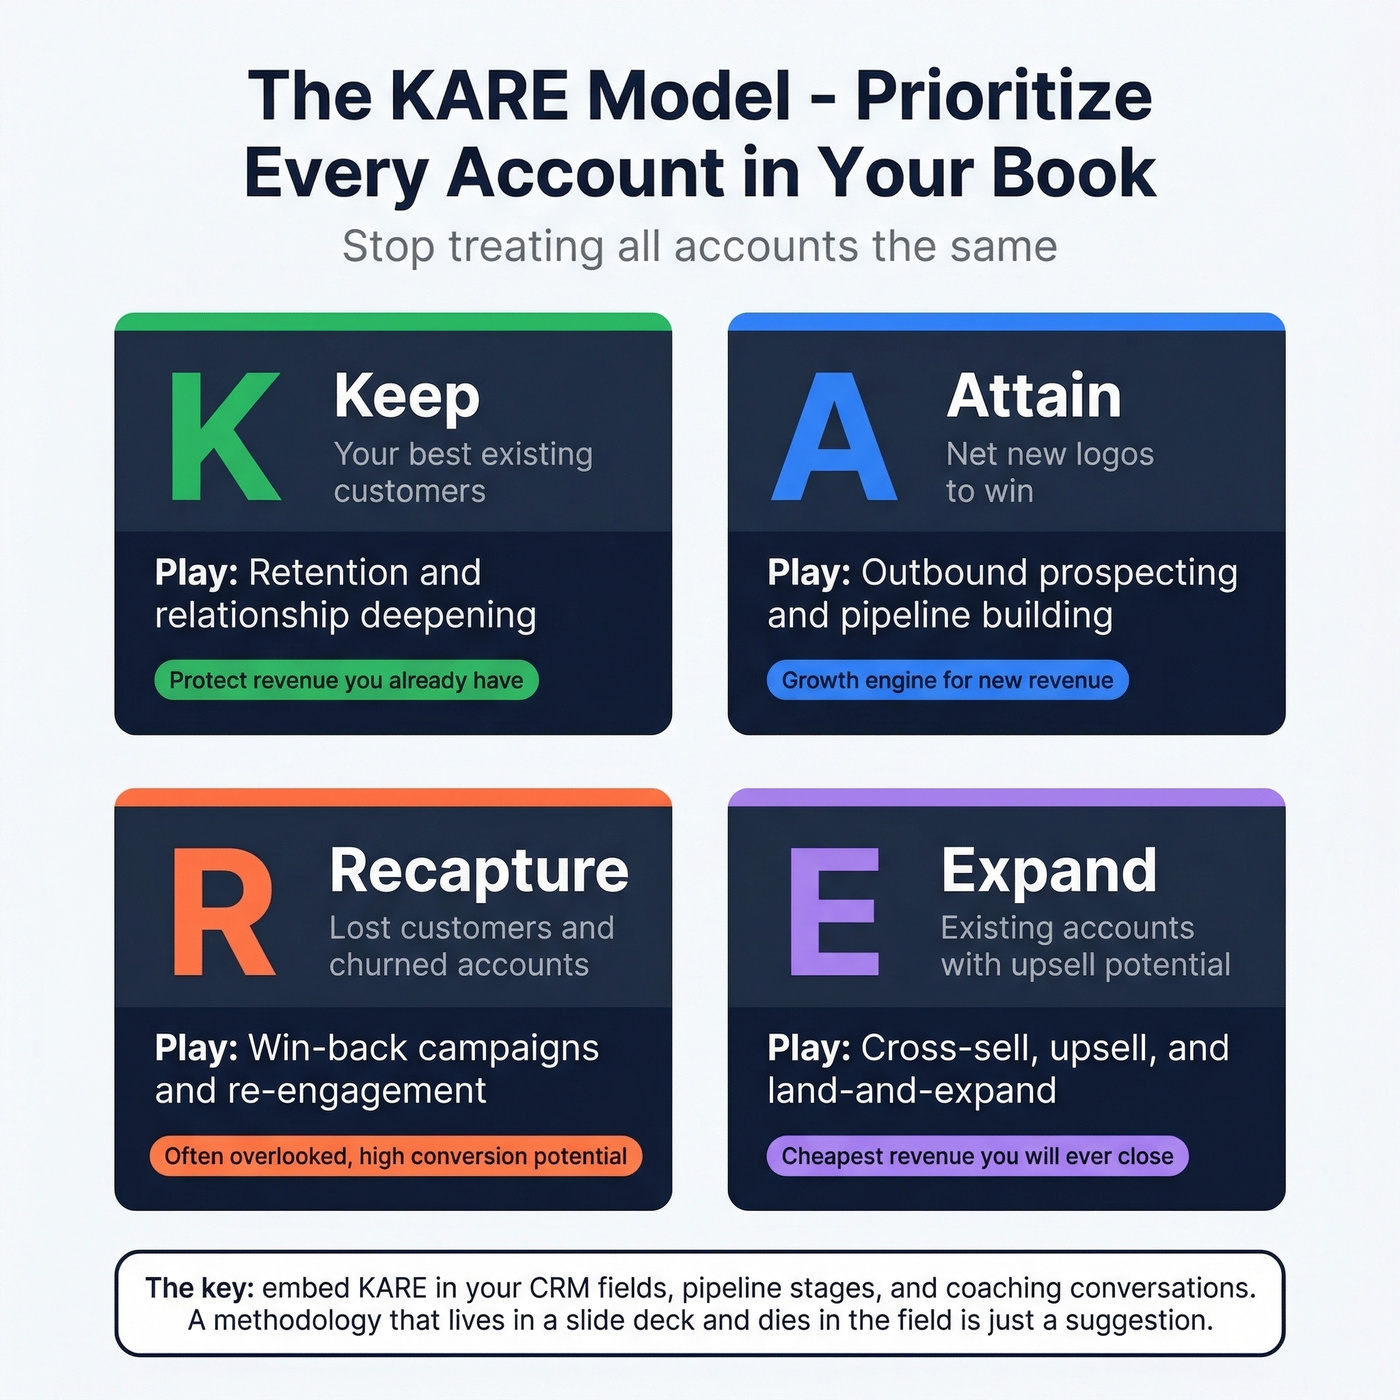
The mistake most teams make is adopting a methodology without operationalizing it. KARE only works if it's embedded in your CRM fields, pipeline stages, and coaching conversations. A methodology that lives in a slide deck and dies in the field isn't a methodology - it's a suggestion.
One angle most teams overlook entirely: buyer enablement. Your champion has to sell internally after your AE logs off the call. Equip them with ROI calculators, one-pagers for their CFO, and competitive battle cards they can forward. Deals involving multiple stakeholder demos close faster because the champion isn't doing the internal selling alone.
The four management traps Sandler identifies are real: micromanagement, laissez-faire leadership, over-indexing on metrics, and the "I am the closer" syndrome where managers swoop in on deals instead of developing reps. If you recognize yourself in any of those, that's your starting point.
The AI Effect on Selling Outcomes
Teams using AI sales tools are 3.7x more likely to meet quota. Early deployments have boosted win rates by 30%+, per Bain. AI adoption among reps jumped from 24% to 43% in a single year, and high performers are 1.7x more likely to use prospecting agents than their peers.
But AI won't fix a broken process - it'll just break it faster.
74% of AI-enabled sales teams are prioritizing data hygiene to support their AI initiatives, because garbage in, garbage out applies to machine learning just as much as it applies to a cold email sequence. If your CRM is full of stale contacts and unverified emails, your AI tools will confidently automate outreach to people who left the company six months ago. Clean data first, AI second - always.
Building Sales Performance Dashboards
Three dashboards cover most of what sales organizations need.
Pipeline Dashboard (Leadership)
Track pipeline coverage ratio (target 3x+), forecast accuracy, top deals by expected close date, new pipeline created vs. target, and revenue against plan. Review weekly. If pipeline coverage drops below 2.5x, you've got a problem that won't show up in revenue until later in the quarter - or the next one.
Activity Dashboard (Managers)
Track outbound calls per rep, emails sent, meetings booked, call-to-meeting conversion, and average call duration. Review daily for volume, weekly for conversion trends. The goal isn't policing - it's spotting reps who are active but not converting, which signals a coaching opportunity.
Rep Scorecard
Each rep should own a personal dashboard: pipeline value, deals by stage, win rate trending, quota attainment pace, and next actions on top opportunities. When reps own their data, they self-correct faster than any manager can correct them.
The cadence matters as much as the content. Daily activity checks. Weekly pipeline reviews. Monthly performance analysis. Quarterly strategic reviews that zoom out to territory health, market shifts, and compensation alignment.
Seven Mistakes That Kill Results
Only 52% of CEOs believe in their own growth plans. Leaders who nail GTM strategy are 2x more likely to meet revenue targets. Here's what separates the two groups.
Neglecting continuous coaching. One SKO per year isn't development. It's an event. Coaching needs to happen weekly, tied to specific deals and observable behaviors. The teams that build coaching into their weekly operating rhythm consistently outperform those that treat it as a quarterly exercise.
Ignoring the data layer. Every metric downstream of contact data suffers when that data is wrong. Bounce rates climb, connect rates drop, and reps burn hours on research instead of conversations. This is the single most underinvested area in most sales orgs.
Poor cross-functional communication. When marketing, sales, and CS operate in silos, you get MQLs that sales doesn't want, handoffs that drop, and churn nobody saw coming.
Managing instead of leading. Strategic leadership - setting vision, aligning GTM, building culture - gets sacrificed for pipeline reviews and deal inspection. Both matter, but strategy comes first.
Ignoring customer-centricity. If your sales process is built around your pipeline stages instead of your buyer's journey, you're optimizing the wrong thing.
Over-investing in low performers. The instinct is to coach struggling reps. Your time is better spent turning B-players into A-players. The bottom 10% rarely recover, and every hour you spend there is an hour you didn't spend accelerating someone with real upside.
Micromanaging autonomy away. Reps who feel trusted outperform reps who feel watched. Set clear expectations, provide the tools, then get out of the way. Skip this advice if your team is brand new and still ramping - new hires need guardrails, not autonomy.
Snyk's 50 AEs cut bounce rates from 35% to under 5% and grew AE-sourced pipeline 180% - not by hiring more reps, but by switching to verified contact data. When reps reach real buyers on the first attempt, win rates climb, cycles shorten, and sales velocity compounds.
Stop diagnosing a systems problem with a motivation fix.
FAQ
What are the most important sales performance metrics?
Win rate, sales velocity, pipeline coverage, quota attainment, and CAC payback. These five cover leading and lagging indicators across the full funnel, giving you early warning signals and outcome measurement in one view. Start with these before adding role-specific KPIs.
How do you calculate sales velocity?
Multiply opportunities by average deal value by win rate, then divide by sales cycle length in days. Example: (50 x $25,000 x 0.22) / 90 = $3,056/day. Improving any single variable - more opps, bigger deals, higher close rate, or shorter cycles - moves the number.
What's a good B2B conversion rate?
The median B2B conversion rate is 2.9%. Legal services averages 7.4%, professional services runs 4-6%, and B2B SaaS ranges from 1.1% to 7.0% depending on whether you run a PLG or enterprise motion.
How does data quality affect selling outcomes?
Bad contact data wastes rep selling time and depresses conversion rates, pipeline coverage, and velocity. Snyk cut bounce rates from 35-40% to under 5% with verified data and saw AE-sourced pipeline jump 180% - proof that clean data is a structural performance lever, not a nice-to-have.
Can AI really improve quota attainment?
Teams using AI are 3.7x more likely to meet quota, and early deployments have boosted win rates by 30%+. But 74% of AI-enabled teams prioritize data hygiene first - because AI trained on stale contacts just automates bad outreach faster.