Sales Performance Analysis: Benchmarks, Formulas, and Frameworks for 2026
Sales performance analysis should tell you why the forecast was off by 40%. Instead, you pull up the CRM, stare at the pipeline, and realize half the "open opportunities" are contacts with bounced emails and disconnected phones. The forecast wasn't wrong - the data underneath it was fiction.
77% of sellers struggle to complete their assigned tasks efficiently, according to a Gartner survey of 501 sellers. In a separate study, 82% of CSOs said enablement content and delivery must significantly change over the next five years to meet revenue goals. Sales subreddits are full of reps asking whether anyone actually looks at their dashboards - which tells you everything about how most orgs handle performance measurement. The tools and training aren't working because teams measure the wrong things, with the wrong data, at the wrong cadence.
What You Need (Quick Version)
- Track 5 metrics: win rate, sales cycle length, average deal size, open opportunities, closed opportunities
- Benchmark them against the numbers below - not against your gut feeling
- Audit your CRM data quality before you trust any of it. If 30%+ of your contact emails bounce, every metric is corrupted
- Review weekly at the rep level, monthly at the team level, quarterly for strategy
- Ignore the noise. You don't need 30 KPIs. You need 5, measured well.
The Only 5 Metrics That Matter
Every sales performance guide lists 15-25 metrics and tells you to "pick the ones that matter." That's not helpful. InsightSquared's framework - which we've seen hold up across dozens of orgs - narrows it to five.
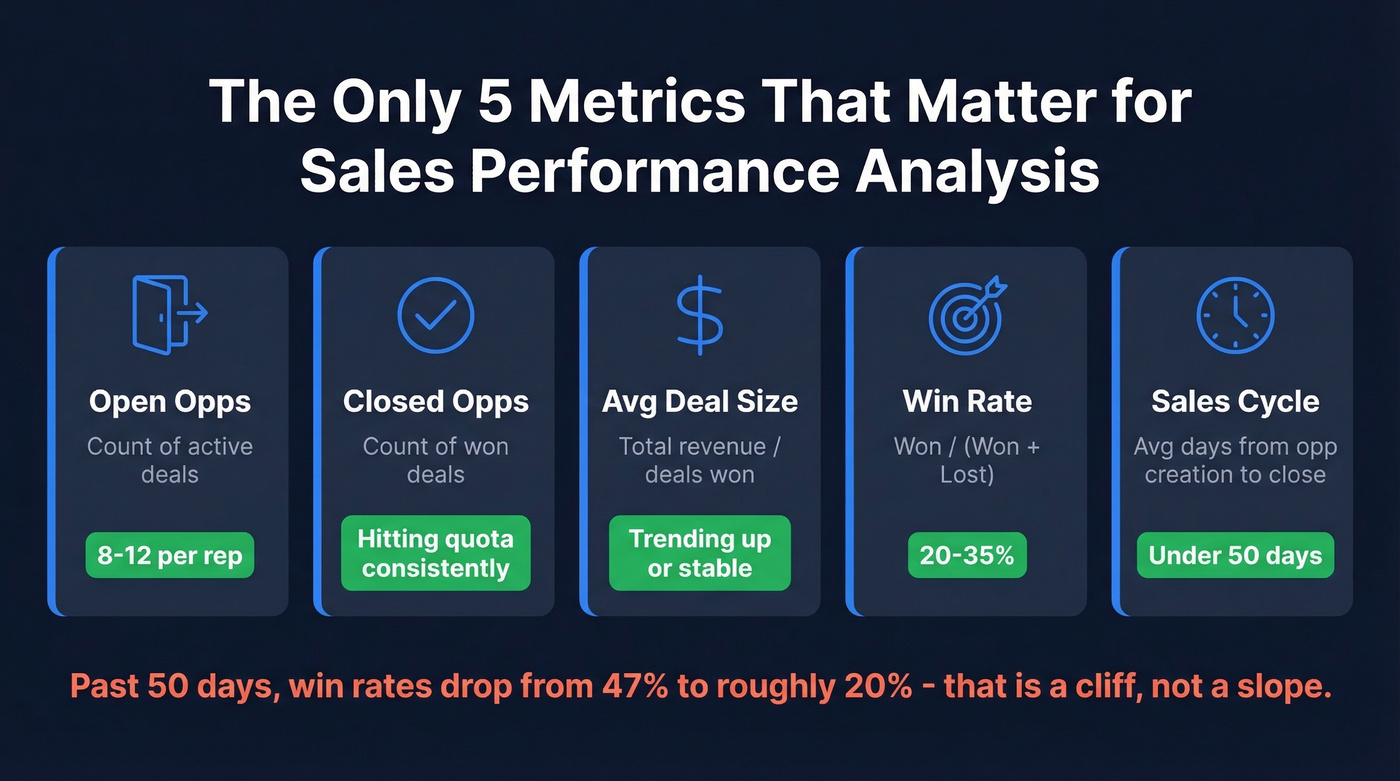
| Metric | Formula | Good Benchmark | What Bad Looks Like |
|---|---|---|---|
| Open Opps | Count of active deals | 8-12 per rep | <50% of quota coverage |
| Closed Opps | Count of won deals | Hitting quota consistently | Closing 2 deals/quarter |
| Avg Deal Size | Total revenue / deals won | Trending up or stable | Shrinking QoQ |
| Win Rate | Won / (Won + Lost) | 20-35% (segment-dependent) | Under 15% |
| Sales Cycle | Avg days from opp creation to close | Under 50 days (see below) | 90+ days with no movement |
The win rate and cycle length numbers deserve special attention. Outreach's data shows opportunities closed within 50 days carry a 47% win rate. Push past that threshold and win rates drop to roughly 20% or lower. That's not a gradual decline. It's a cliff.
You don't need 30 metrics. You need these five, measured consistently, with clean underlying data. The teams that outperform aren't tracking more - they're tracking better.
Benchmarks: What Good Looks Like
Numbers without context are useless. Here are actual benchmarks you can compare against.
Funnel Stage Conversion
| Stage | Benchmark Range |
|---|---|
| Lead to MQL | 35-45% |
| MQL to SQL | ~15% (biggest drop-off) |
| SQL to Opportunity | 25-30% |
| Opp to Closed-Won | 6-9% |
| Overall Lead to Customer | 1.5-2.5% |
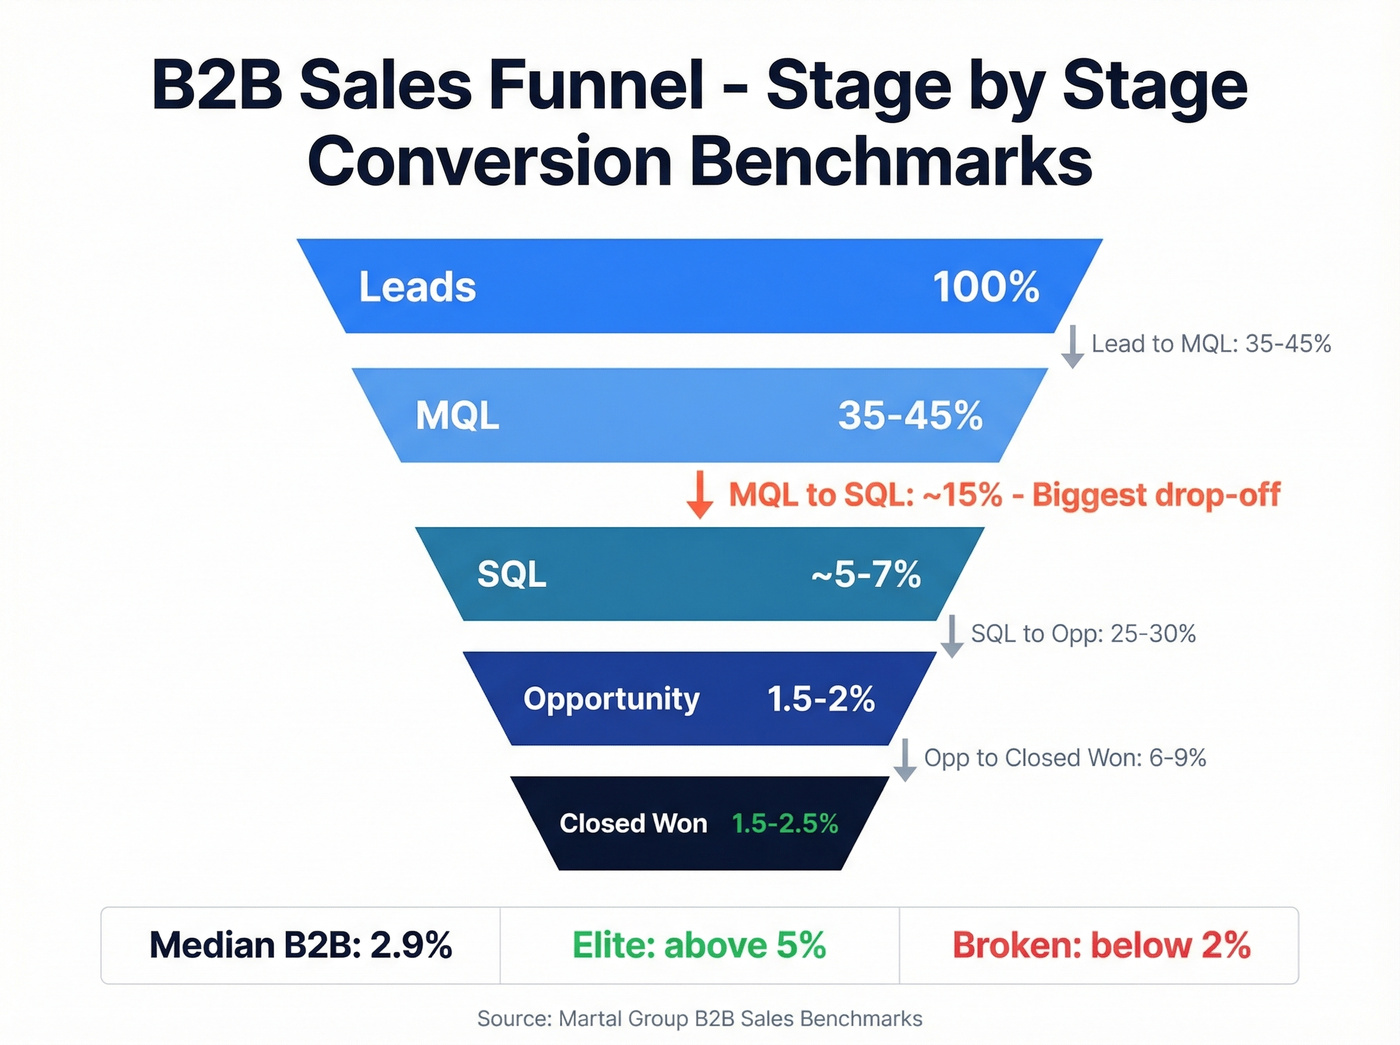
The median B2B conversion rate was 2.9%, with a typical range of 2.0-5.0%. Legal services leads at 7.4%; B2B e-commerce trails at 1.8%. Above 5% is elite territory. Below 2% means something structural is broken - not just underperformance, but a fundamental gap in targeting, messaging, or data quality that no amount of coaching will fix.
Win Rate and Cycle Length by Segment
| Segment | Win Rate Range | Typical Cycle Length |
|---|---|---|
| SMB | 25-35% | 2-8 weeks |
| Mid-Market | 15-25% | 2-4 months |
| Enterprise | 10-20% | 6-12+ months |
Pipeline Coverage
Most healthy orgs run 3x pipeline coverage - $3 in pipeline for every $1 in quota. SaaS companies often need 4-5x because deal slippage is higher. Enterprise teams with longer cycles can get away with 2-2.5x if win rates are strong.
Here's the thing: if your average deal is under $15K, you probably don't need 4x coverage. You need faster cycles and cleaner data. Most teams over-index on pipeline volume when their real problem is pipeline quality - half their "opportunities" are contacts who changed jobs six months ago.
Every metric in your sales performance analysis sits on top of contact data. If 30% of your emails bounce, your win rates, cycle lengths, and pipeline coverage are all fiction. Prospeo's 98% email accuracy and 7-day data refresh cycle mean the numbers you analyze actually reflect reality - not six-month-old CRM records.
Fix the data layer before you trust a single dashboard metric.
How to Run a Sales Performance Analysis
Five steps. No fluff.
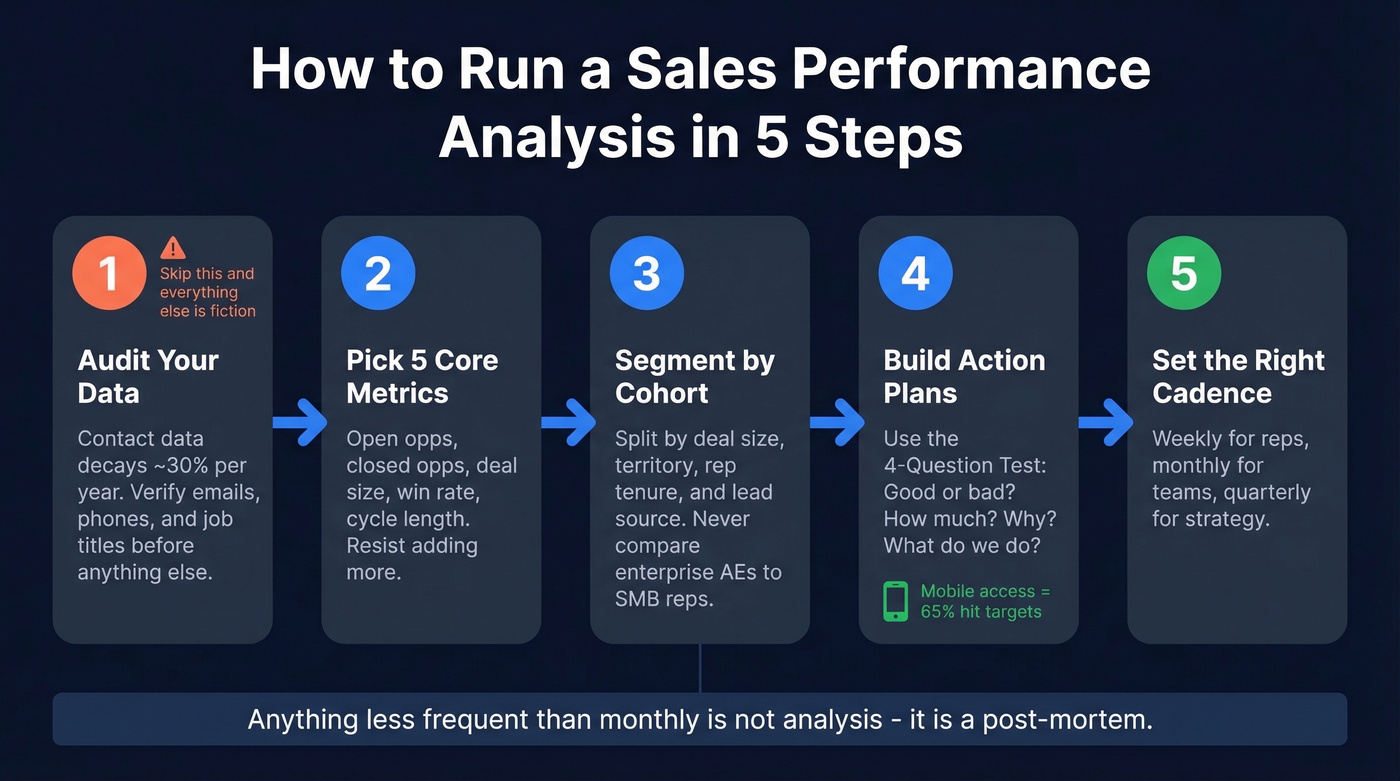
Step 1: Audit Your Data
This is the step everyone skips, and it's the one that invalidates everything that follows. Contact data decays fast - often around 30% per year. Before you evaluate performance at any level, verify the contacts in your pipeline are real, reachable humans who still work at the company your CRM says they do. Prospeo handles this at scale with 98% email accuracy and a 7-day refresh cycle, but whatever tool you use, do this first.
Step 2: Pick Your Core Metrics
Open opportunities, closed opportunities, deal size, win rate, sales cycle length. That's it. Resist the urge to add more. Every additional metric dilutes focus and creates noise that makes the signal harder to find.
Step 3: Segment by Cohort and Role
Don't compare your enterprise AE closing $200K deals against your SMB rep running $5K transactions. Segment by deal size, product line, territory, rep tenure, and lead source. Cohort-level analysis - grouping deals by the month they entered pipeline - reveals trends that aggregate numbers hide completely. For multi-touch deals, layer in attribution modeling; time-decay or position-based models work well for B2B cycles averaging 14+ touchpoints.
Step 4: Build an Action Plan
A dashboard that doesn't drive action is just a screensaver. We use the 4-Question Insight Test from Zebra BI as a design principle: every view should answer (1) good or bad? (2) how good or bad? (3) why? (4) what should we do? If your dashboard can't answer all four, it's decoration.
Make sure it works on phones, too. Organizations using mobile CRM access are 65% likely to hit sales targets versus just 22% without.
Step 5: Set the Right Cadence
Weekly for rep-level metrics - pipeline movement, activity outcomes, deal progression. Monthly for team-level trends - win rate shifts, cycle length changes, quota attainment. Quarterly for strategic reviews covering forecast accuracy, territory performance, and headcount planning.
Anything less frequent than monthly isn't analysis. It's a post-mortem.
5 Mistakes That Break Your Analysis
Mistake 1: Tracking 30 metrics instead of 5. More data isn't better data. We've seen RevOps teams build 40-metric dashboards that nobody opens. Pick five. Measure them well.
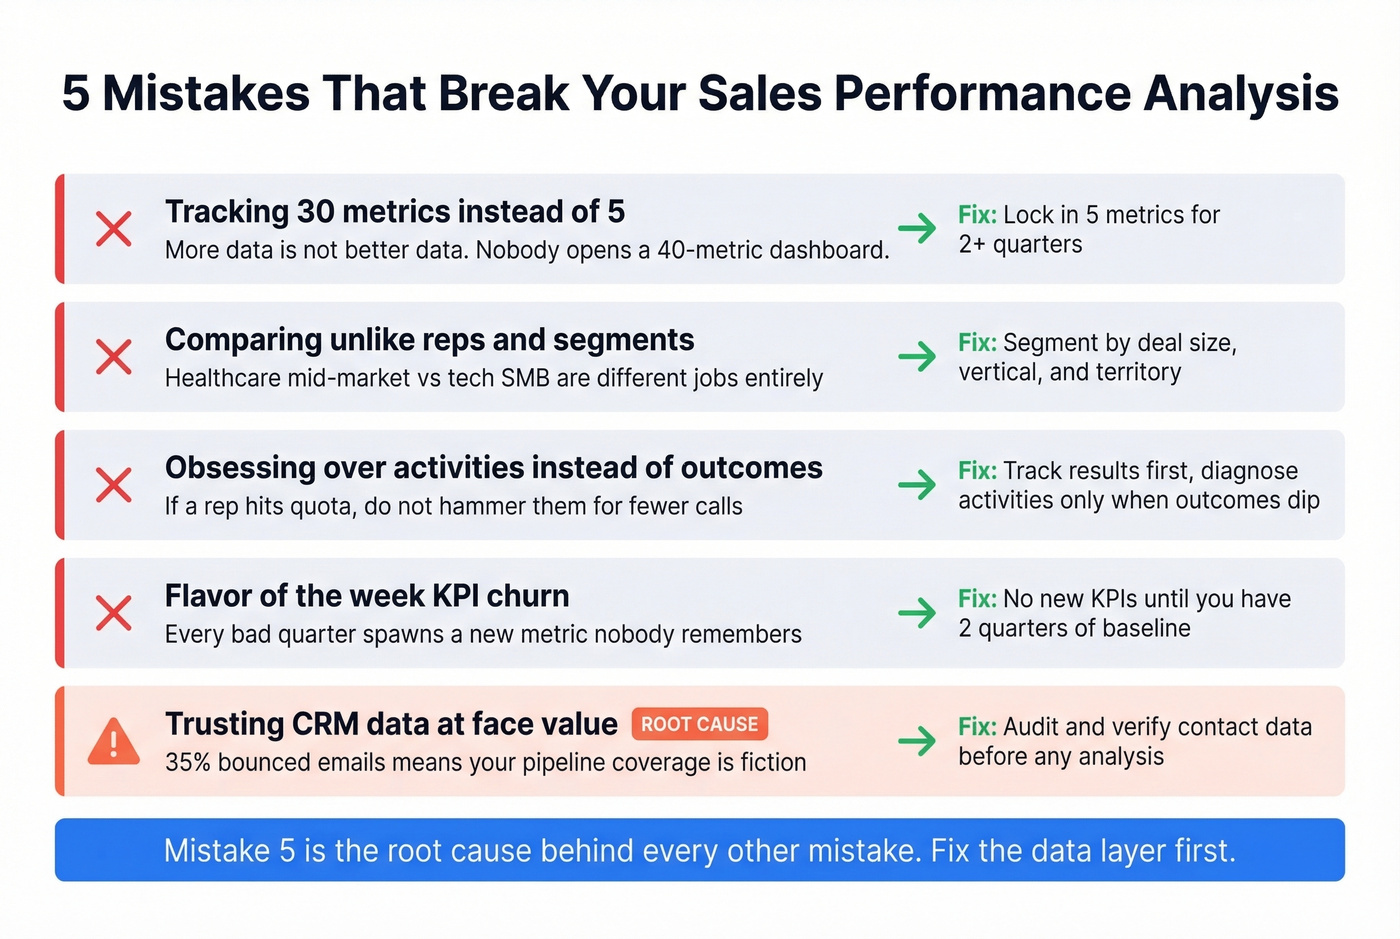
Mistake 2: Comparing unlike reps and segments. A rep selling into healthcare mid-market and a rep selling into tech SMB aren't doing the same job. Comparing their win rates without segmentation produces meaningless conclusions and demoralizes your best people.
Mistake 3: Obsessing over activities instead of outcomes. If a rep is hitting quota, don't hammer them for making fewer calls. Track results first. Only diagnose activity levels when outcomes are underperforming. Let the numbers guide coaching conversations, not micromanage dials per hour.
Mistake 4: "Flavor of the week" KPI churn. Every bad quarter spawns a new metric. By Q3 you're tracking "email response time" alongside win rate, and nobody remembers which ones matter. Lock your metrics for at least two quarters before adding new ones.
Mistake 5: Trusting CRM data at face value. This is the root cause behind every other mistake. If 35% of the emails in your pipeline bounce, your win rate is calculated against phantom opportunities. Your pipeline coverage is inflated. Your forecast is fiction.
Tools That Move the Needle
You don't need a $100K tech stack. Here's what actually matters.
| Category | Tool | Starting Price | Best For |
|---|---|---|---|
| CRM Analytics | Salesforce | $25/user/mo | Enterprise reporting |
| CRM Analytics | HubSpot | Free / from ~$20/user/mo | SMB + mid-market |
| CRM Analytics | Pipedrive | $14/user/mo | Small sales teams |
| BI / Dashboards | Tableau | $15/user/mo | Custom visualization |
| BI / Dashboards | Power BI | Free / $10/user/mo | Microsoft shops |
| BI / Dashboards | Looker Studio | Free | Budget-friendly BI |
| Rev Intelligence | Gong | ~$100-150/user/mo | Call + deal analytics |
| Rev Intelligence | Clari | ~$25-50K/year | Forecasting |

If you're budget-constrained, start with your existing CRM, Looker Studio for dashboards, and a data quality tool for verification. That combination covers 80% of what you need on free tiers alone. Revenue intelligence tools like Gong and Clari add real value, but they're a second-phase investment once your data foundation is solid. Skip them until you trust the numbers underneath.
If you want to go deeper on the data layer, compare data enrichment options and pick a verifier that matches your volume and risk tolerance (see email bounce rate benchmarks).
You just read that contact data decays ~30% per year. Prospeo refreshes every 7 days - not the 6-week industry average - so your reps prospect real buyers at real companies. At $0.01 per verified email, cleaning your entire pipeline costs less than one lost deal.
Stop analyzing pipeline built on dead contacts. Start with verified data.
FAQ
What's the difference between sales performance analysis and sales analytics?
Sales analytics is the broader discipline of collecting and visualizing sales data. Performance analysis is the diagnostic layer - evaluating rep, team, or org results against benchmarks to identify what's working and what to change. Analytics is infrastructure; performance analysis is the checkup.
How often should you review performance metrics?
Weekly for rep-level pipeline movement, monthly for team-level win rate and cycle length trends, quarterly for strategic reviews covering forecast accuracy and territory planning. Anything less frequent than monthly means you're running post-mortems, not steering.
What's the fastest way to improve sales performance metrics?
Audit your CRM data first. If 30%+ of your emails bounce, your conversion rates and pipeline coverage are fiction. Teams that clean contact data typically see immediate metric improvements because they're finally measuring real prospects, not ghosts in the pipeline. From there, coach reps on specific deal-stage bottlenecks rather than generic activity targets - that's where the real gains live.