How to Run a Sales QBR That Doesn't Waste Everyone's Time
A sales rep was supposed to present 13 slides in 45 minutes. He ran 95 minutes. Then the next rep did the same. What was scheduled as a 9-to-1 session for six reps turned into a 5-hour marathon that left everyone resentful and nothing resolved. The practitioner standard is clear: there's zero reason you can't get 13 slides done in 30 minutes or less.
If your sales QBR feels like that marathon, the problem isn't the format. It's the execution.
What a Sales QBR Actually Is
A quarterly business review is a structured, data-driven evaluation of your team's performance over the past quarter. It's not a status update, not a pipeline call, and not a product demo dressed up in a slide deck. The QBR meaning in sales comes down to strategic recalibration - what worked, what didn't, and what changes for next quarter.
Gartner projects that 65% of B2B sales orgs will let data guide their decisions rather than intuition by 2026. A well-run review is where that data actually becomes decisions.
Internal vs. Customer QBR
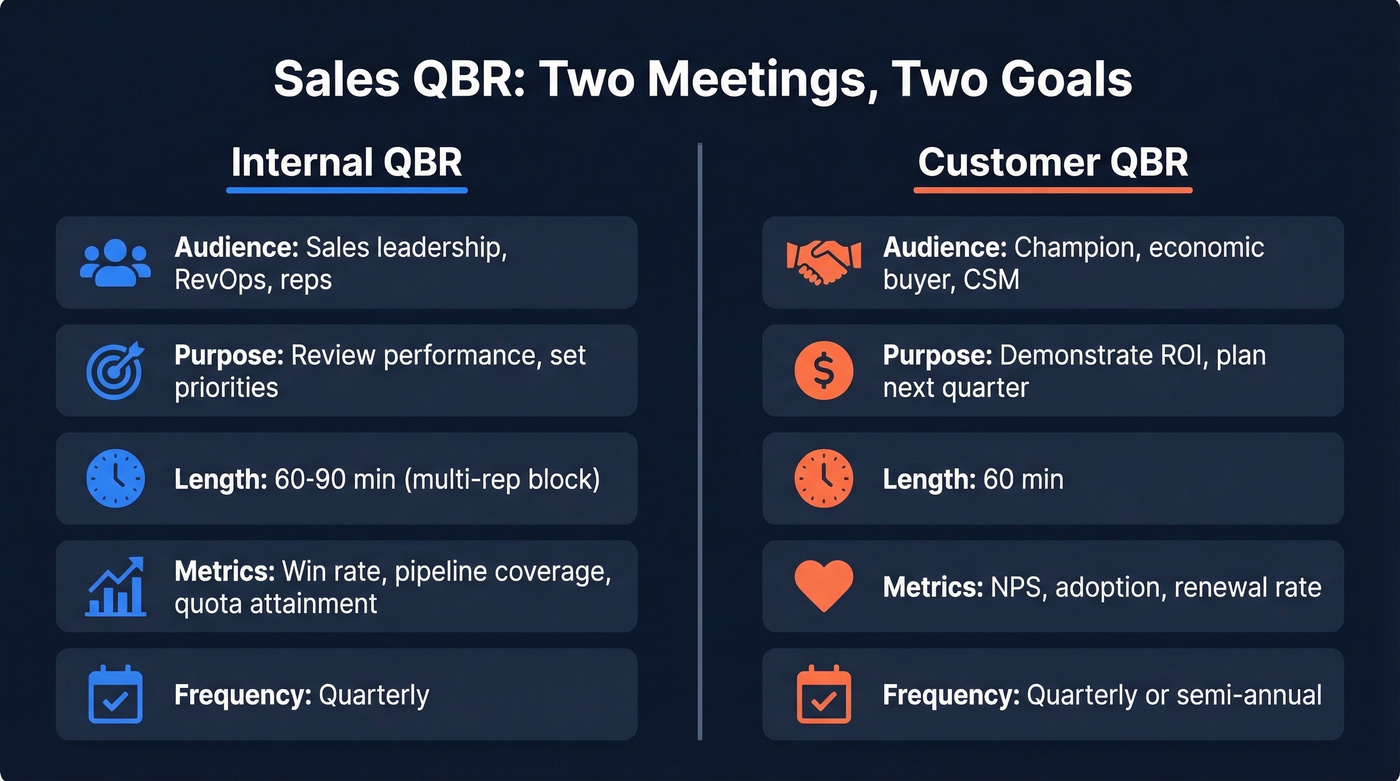
The biggest confusion here is conflating two completely different meetings. An internal review is your team evaluating its own performance. A customer QBR is you presenting value to a client. Mix up the format, metrics, or attendees and you end up with a meeting that serves nobody.
| Internal QBR | Customer QBR | |
|---|---|---|
| Audience | Sales leadership, RevOps, reps | Champion, economic buyer, CSM |
| Purpose | Review performance, set priorities | Demonstrate ROI, plan next quarter |
| Frequency | Quarterly | Quarterly or semi-annual |
| Key Metrics | Win rate, pipeline coverage, quota attainment | NPS, adoption, renewal rate |
| Common Length | 60-90 min (multi-rep block) | 60 min |
Internal reviews are where the honest numbers live. Customer-facing sessions are where you prove value and protect the renewal.
Why Quarterly Reviews Matter
A common objection on r/sales is that QBRs rehash numbers already visible in dashboards and covered in weekly 1:1s. Fair point - if your review is just a dashboard readout, it is redundant. Kill it or fix it.
Here's the fix: reframe it as a decision-making session. Dashboards show you what happened. A quarterly review answers why it happened and what changes. B2B customers with strong executive engagement are 2.5x more likely to renew, per McKinsey research, and cross-functional collaboration has been shown to increase sales by 27%. We've found that the reviews that actually change behavior are the ones where someone walks out with a decision they didn't have walking in - and that only happens when you protect the time for strategic discussion instead of burning it on slide readouts.
Who Should Be in the Room
Wrong attendees turn a strategic meeting into a tactical one. When marketing, CS, and RevOps are all present, nobody can deflect blame without getting called on it. That's the point.
| Role | Internal QBR | Customer QBR |
|---|---|---|
| VP Sales / CRO | ✓ Required | ✓ Exec sponsor |
| RevOps | ✓ Required | Optional |
| Marketing lead | ✓ Recommended | - |
| CS lead | ✓ Recommended | ✓ CSM required |
| Individual reps | ✓ Presenting | - |
| Champion | - | ✓ Required |
| Economic buyer | - | ✓ Critical |
For customer-facing reviews, getting the economic buyer in the room is the whole game. A session with only your champion stays tactical. A session with their VP becomes strategic - and that's where renewals and expansions get decided.
Key Metrics to Review
Don't dump every Salesforce report into your deck. Organize metrics by category and include benchmark ranges so the numbers mean something.
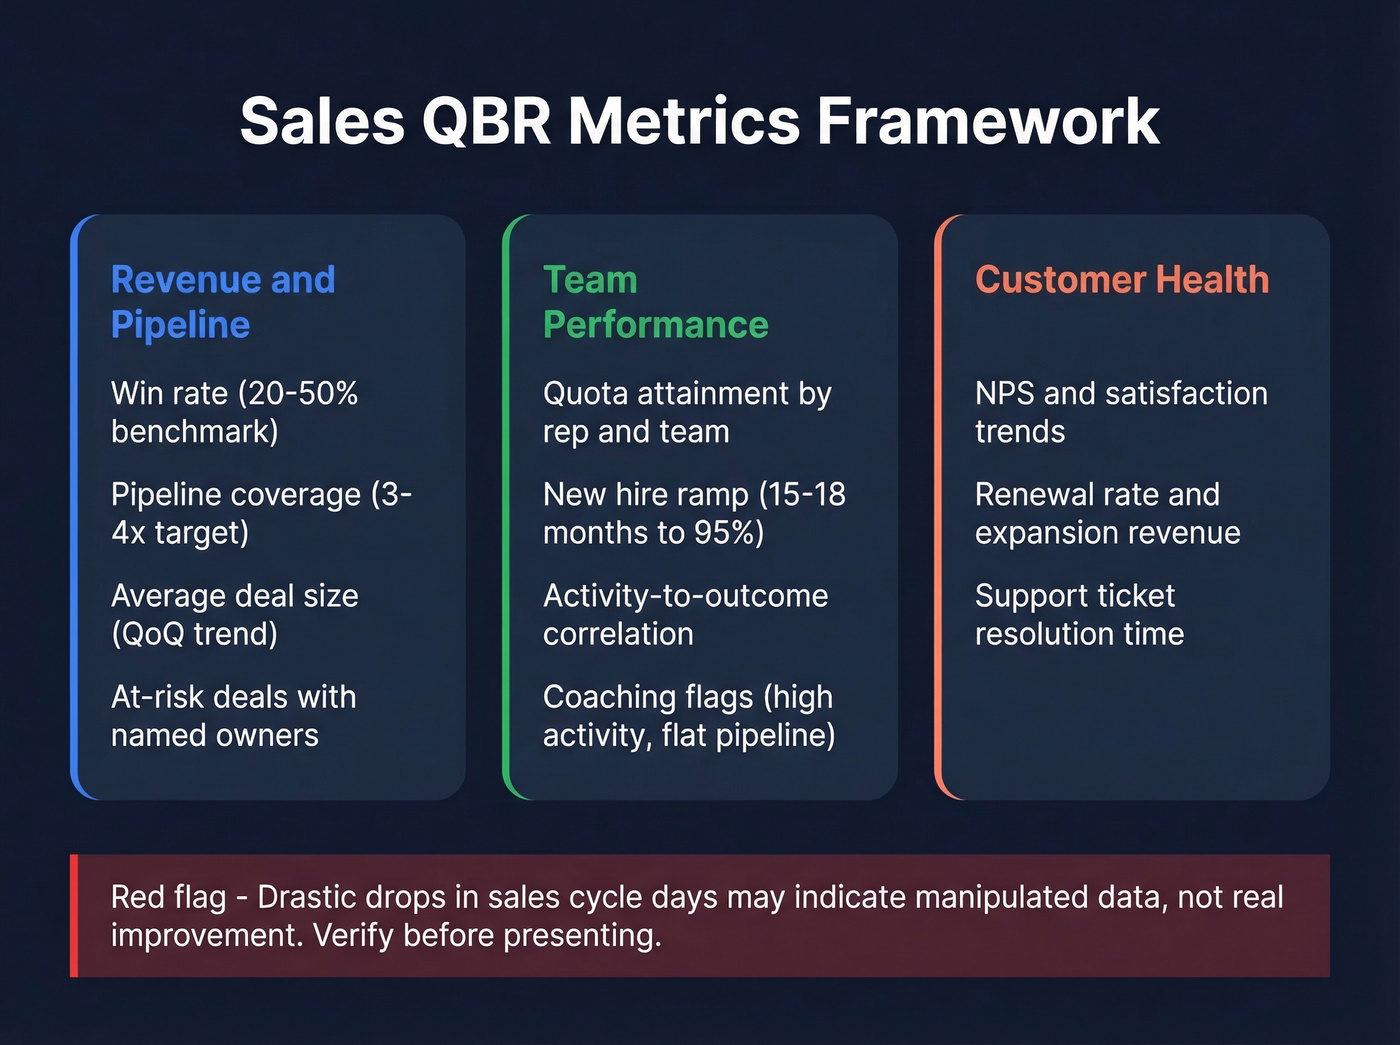
Revenue & Pipeline - Win rate (20-50% depending on segment), pipeline coverage (3x target minimum, 4x if you're conservative), and average deal size tracked quarter-over-quarter. Also review at-risk deals explicitly: any opportunity that's slipped stage or gone silent deserves a named owner and a recovery plan.
Team Performance - Quota attainment by rep and by team. New hire ramp: expect 10-20% of quota in the first few months, with 15-18 months to reach roughly 95% efficiency. Activity metrics that correlate to outcomes, not vanity dials. If a rep's call volume is up 40% but pipeline is flat, that's a coaching conversation, not a celebration.
Customer Health (for customer QBRs) - NPS and satisfaction trends, renewal rate and expansion revenue, support ticket resolution time.
One data-integrity red flag worth watching: drastic decreases in sales cycle days sometimes indicate manipulated data, not genuine improvement. Call it out before leadership draws the wrong conclusions.
Your QBR pipeline coverage metric is meaningless if half your contacts bounce. Prospeo delivers 98% email accuracy with a 7-day refresh cycle - so the numbers you present in your quarterly review actually reflect reality, not stale data.
Stop presenting pipeline built on bad data. Start your next QBR with contacts you can trust.
Sales QBR Agenda Templates
Most reviews fail because there's no timed agenda. People wing it, reps ramble, and a 90-minute meeting becomes three hours. We've tested all three formats below - the key to each is enforcing the clock.
Internal Review (95 Minutes)
| Section | Time | Owner | Purpose |
|---|---|---|---|
| Kickoff | 5 min | VP Sales | Set context, state goals |
| Pipeline Health | 20 min | RevOps | Coverage, velocity, gaps |
| KPI Recap | 15 min | Each rep | Win rate, quota, deal size |
| What Worked / Didn't | 10 min | Team | Honest retrospective |
| Forecasting & Goals | 20 min | VP Sales | Next-quarter targets |
| Strategic Adjustments | 15 min | All | Resource shifts, process changes |
| Action Items | 10 min | VP Sales | Owners, deadlines, follow-ups |
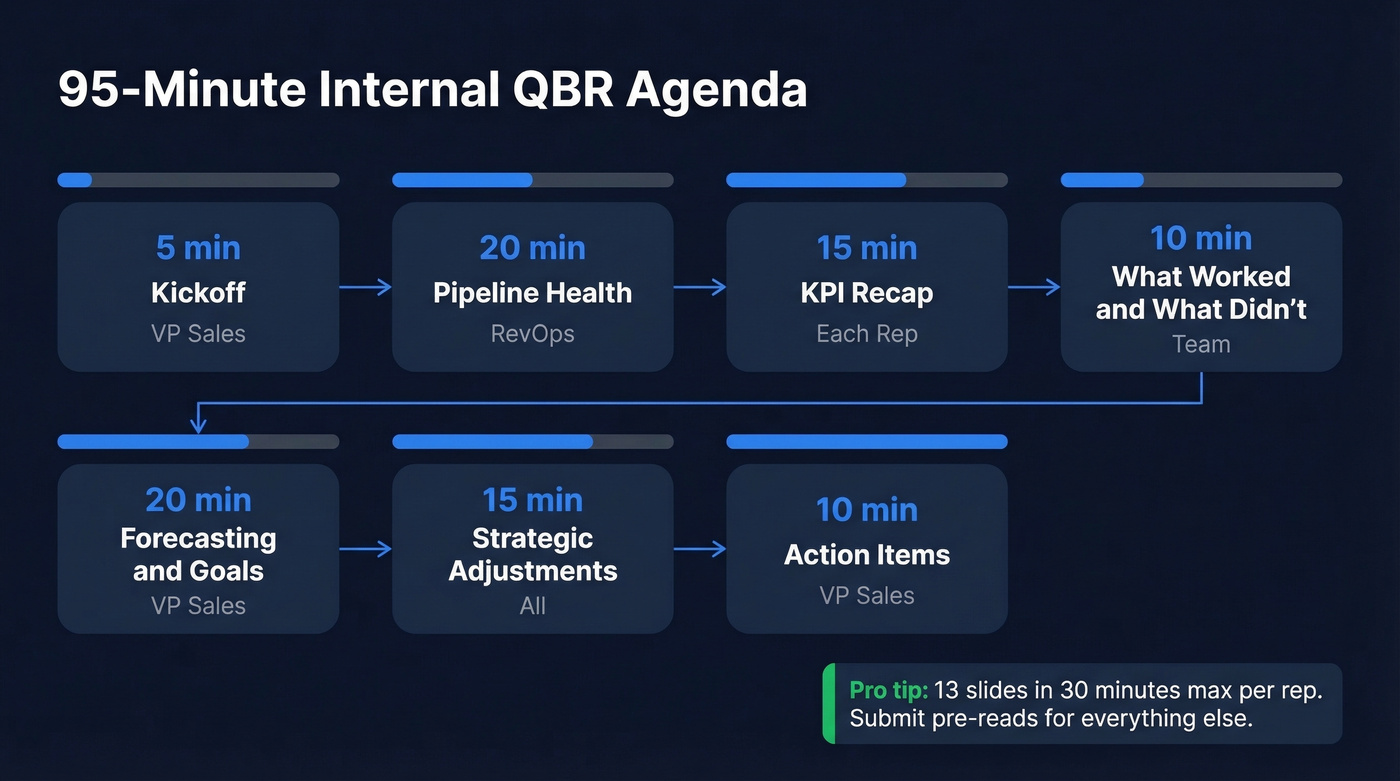
The 13-slides-in-30-minutes standard applies inside this structure. If you've got six reps, split across two meetings or have reps submit pre-reads and only present exceptions.
Want a ready-made deck? Smartsheet offers free QBR templates in PowerPoint and Excel.
Customer Review (60 Minutes)
Your champion just asked you to present a QBR to their VP next week. You've got 60 minutes and 10 slides.
| Section | Time | Owner | Purpose |
|---|---|---|---|
| Objectives | 5 min | CSM | Align on meeting goals |
| Performance Review | 15 min | CSM | Key metrics, adoption trends |
| ROI Story | 10 min | CSM | Value delivered in dollars |
| Feedback & Concerns | 10 min | Customer | Open floor for issues |
| Joint Planning | 15 min | Both | Next-quarter priorities |
| Next Steps | 5 min | CSM | Actions, owners, deadlines |
The ROI story is the slide that earns your renewal. Don't skip it, and don't make it vague. "We saved your team 14 hours per week on manual reporting" beats "we improved efficiency" every single time.
Executive Review (45 Minutes)
For board-level or C-suite audiences, cut everything that isn't a decision or an insight.
| Section | Time | Owner | Purpose |
|---|---|---|---|
| Executive Summary | 5 min | CRO | One slide, three numbers |
| Scorecard | 10 min | RevOps | RAG status on 5-7 KPIs |
| 3 Key Insights | 10 min | CRO | What changed and why |
| Decisions Needed | 10 min | CRO | Budget, headcount, strategy |
| Action Plan | 10 min | All | Commitments and owners |
How to Structure Your Deck
A solid QBR deck follows a six-part format: Executive Summary, KPI Scorecard with RAG indicators, Wins and Challenges, Financial Overview, Next-Quarter Priorities (three to five objectives max), and Action Items with owners and deadlines.
For slide counts: client-facing account reviews run 10-15 slides. Executive reviews run 8-10. If you're over 15, you're presenting too much data and not enough insight.
Steal this executive summary example: "Q4 exceeded target by 12% (£2.4M vs £2.1M goal). Recommend doubling referral budget in Q1. Need approval for £50K incremental spend." Three sentences. One slide. Every executive in the room knows exactly what you're asking for.
Mistakes That Kill Credibility
We've seen all of these destroy otherwise solid reviews. Seven come up more than any others.
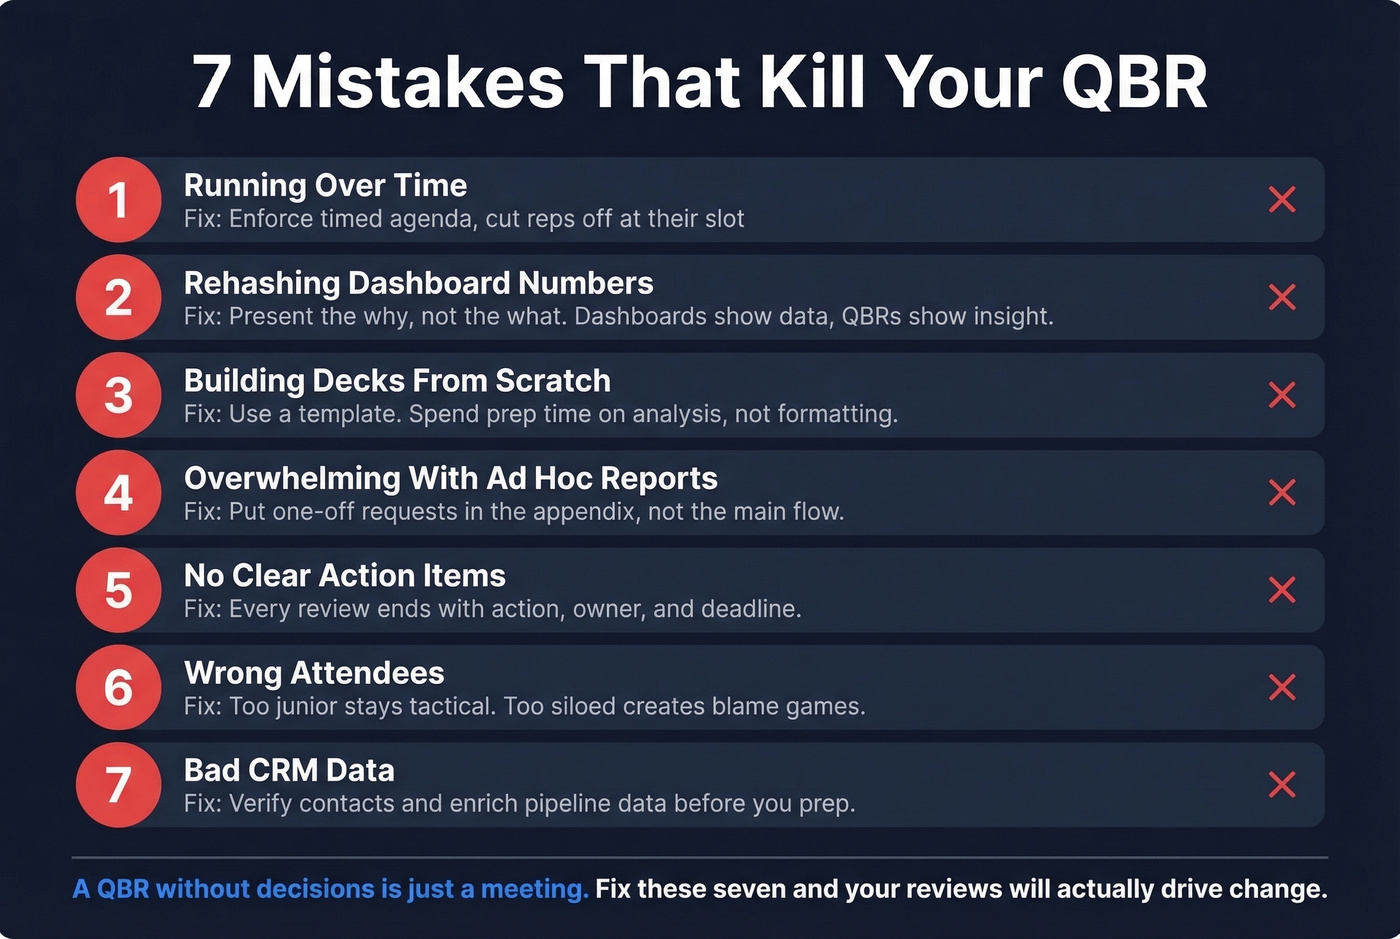
Running over time. The 95-minute rep on a 45-minute slot isn't just annoying - it signals you can't prioritize. If you can't manage a clock, why would leadership trust you to manage a territory?
Rehashing dashboard numbers. "Win rate dropped 8%" is a dashboard. "Win rate dropped 8% because we lost three enterprise deals to a new competitor's pricing" is a QBR.
Building decks from scratch every quarter. Use a template. Update the numbers. Spend your prep time on analysis, not formatting.
Overwhelming with ad hoc reports. If someone requests a one-off analysis, put it in an appendix. Don't let it hijack the main flow.
No clear action items. Every review should end with a list: action, owner, deadline. Without that, you just had a conversation, not a review.
Wrong attendees. Too junior and it stays tactical. Too siloed and you get finger-pointing instead of alignment.
Bad CRM data. This is the silent killer. When half your pipeline contacts are unverified, leaders spend the meeting fact-checking instead of strategizing. Run your pipeline through an enrichment tool before prep - verified contact data means your numbers actually reflect reality. Our team uses Prospeo's CRM enrichment for this, which returns 50+ data points per contact on a 7-day refresh cycle, but whatever you use, fix the data before you walk in.
Trends Shaping QBRs in 2026
Three shifts worth watching. First, predictive analytics in prep: teams are using intent signals and pipeline scoring models to walk into reviews with forward-looking data, not just rearview metrics. Second, segmented formats by account tier - strategic accounts get the full 60-minute live review, growth accounts get a lighter 30-minute version, and at-risk accounts get a dedicated rescue-plan format.
Third, async reviews are becoming standard for mid-tier accounts. Let's talk about that.
The Async QBR
Not every account justifies a live meeting. For mid-tier customers, an async review - emailing the deck with an offer to discuss - scales without sacrificing the relationship.
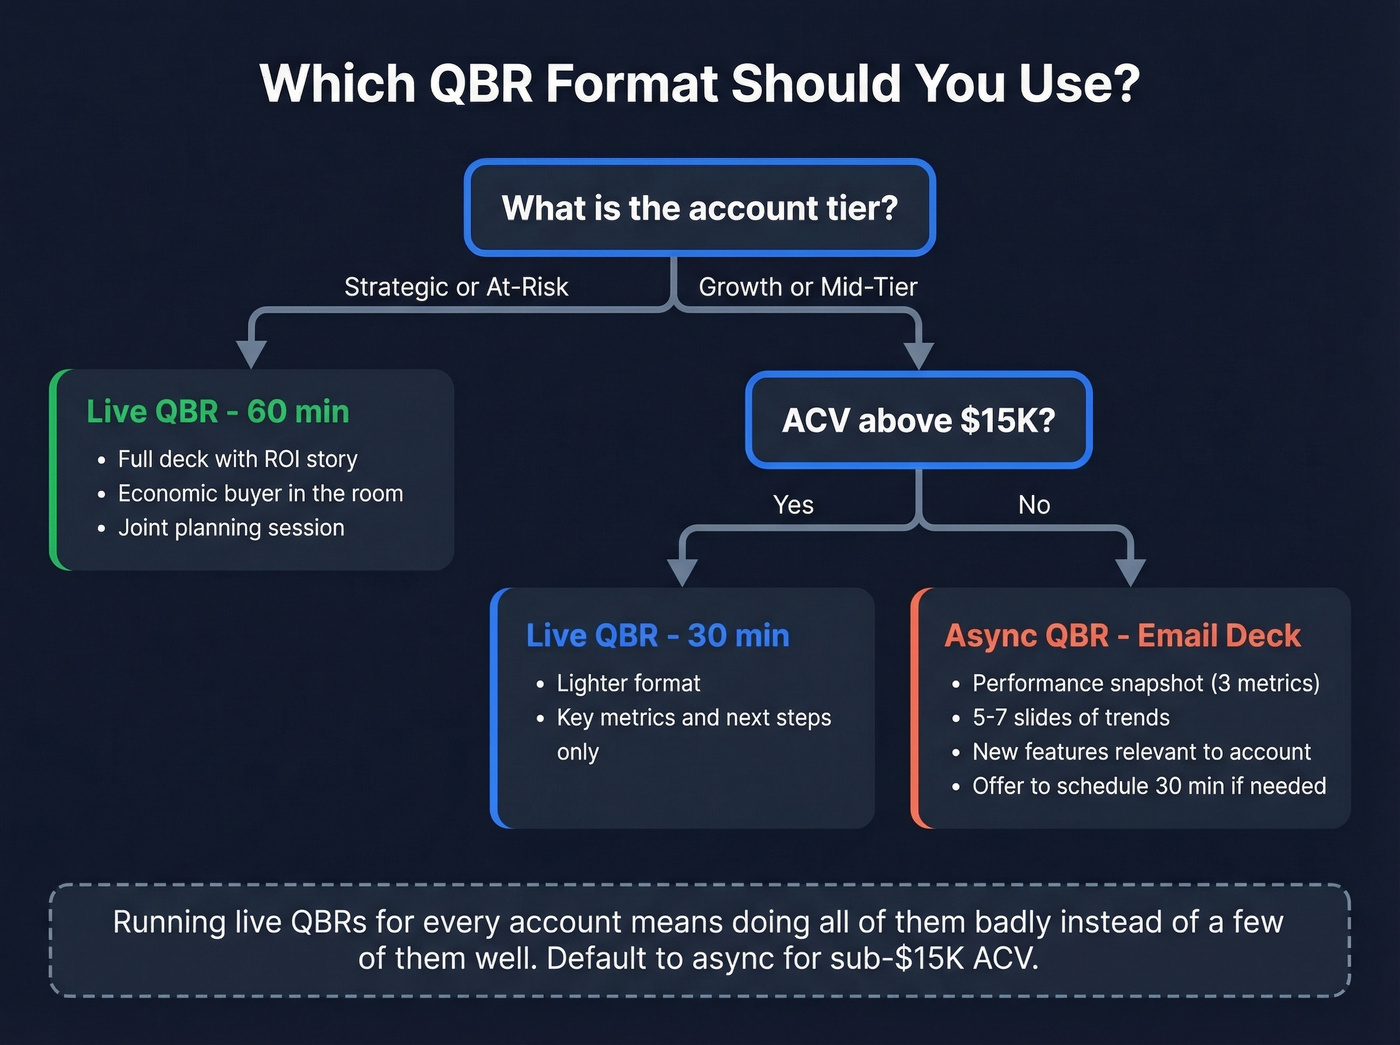
The structure: Performance Snapshot with three key metrics, Insights covering five to seven slides of trends and recommendations, New Features relevant to that account, and Next Steps with a clear ask. Include a line like "Happy to walk through any of this live - reply to schedule 30 minutes." Most won't take you up on it, but the ones who do are the ones who need the conversation.
Look, if your ACV is under $15K, the async format should be your default. Running live quarterly reviews for every account is a luxury most teams can't afford, and the ones who try end up doing all of them badly instead of a few of them well.
Tools to Streamline Prep
The manual workflow is painful: export Salesforce data to spreadsheets, screenshot dashboards, paste into slides, realize the numbers are wrong, start over. QBR software automates this by pulling CRM data directly into templates and dashboards.
The tool categories that matter: CRM dashboards like Salesforce and HubSpot native reporting handle the visualization layer. Presentation automation tools like Gainsight for CS reviews and DemandFarm for account-level reviews handle the deck-building (expect enterprise pricing in the $1,000-5,000+/mo range for these). Data enrichment fixes the upstream problem - because the best dashboard in the world is useless if the underlying contact data is stale.
That last category matters more than most teams realize. When your VP asks why a $200K deal went dark, and the answer is that the contact left the company three weeks ago, that's a data freshness problem, not a sales problem.
If you're rebuilding your process, start with pipeline health and work backward to the inputs.
Win rate trending down? Before you restructure territories or retrain reps, check your data. Teams using Prospeo book 26% more meetings than ZoomInfo users - because 98% accurate emails and 125M+ verified mobiles mean reps actually reach decision-makers.
Make next quarter's QBR the one where every metric moves in the right direction.
FAQ
How long should a sales QBR be?
Ninety minutes for an internal review with multiple reps, capping each at 30 minutes for a 13-slide readout. Sixty minutes for a customer-facing session. Forty-five for an executive review. If it's running longer, move extras to an appendix and reclaim the time for strategy.
What does QBR mean in sales?
QBR stands for Quarterly Business Review - a structured meeting held every quarter to evaluate performance against targets, diagnose pipeline health, and align the team on strategic priorities for the next 90 days. It's distinct from weekly pipeline calls because the focus is on patterns and decisions, not deal-by-deal updates.
What's the difference between a QBR and an EBR?
A QBR reviews quarterly performance and sets next-quarter priorities. An EBR (Executive Business Review) is higher-level, typically semi-annual or annual, and focuses on strategic ROI and long-term alignment. EBRs roll up QBR insights for C-suite audiences.
How do you handle a QBR when results are bad?
Lead with honesty - present the numbers, explain root causes, and focus 70% of the meeting on the corrective plan. Executives respect transparency and a clear path forward more than spin. Distinguish whether pipeline gaps stem from bad contact data versus genuine demand issues - that distinction changes the corrective action entirely.
What tools help with QBR data accuracy?
CRM-native dashboards in Salesforce and HubSpot handle reporting. Enrichment platforms fix the underlying data. The key metric to watch is your data refresh cycle - if contacts aren't being re-verified at least monthly, you're presenting numbers built on a shaky foundation.