Seasonal Sales Forecasting: A Practitioner's Guide (2026)
Your Q4 forecast looks solid - until you realize last November's sales were suppressed by a two-week stockout on your top SKU. Your model thinks November is a weak month. It's not. It's a data problem masquerading as a demand signal, and it's about to cascade into under-ordering, more stockouts, and an even worse forecast next year. That's the shortage vicious circle, and it kills more seasonal forecasts than any model choice ever will.
What You Need (Quick Version)
Seasonal forecasting fails because of dirty data, not bad models. Before you touch Prophet or Holt-Winters, do three things: correct stockout history so you're forecasting unconstrained demand, normalize promotional spikes so your model sees true seasonality instead of marketing noise, and pick a method that matches your data maturity. The method table below breaks this down.
What "Forecast Seasonality" Actually Means
Every time series has four things fighting for attention: trend, seasonality, holidays, and noise. Your job is to separate them. If you don't, your model confuses a Black Friday promo with a genuine November demand pattern - and your next order quantity is wrong before you even submit it.
Prophet makes this decomposition explicit with y(t) = g(t) + s(t) + h(t) + ε. Understanding the structure matters because each component needs different treatment. Trend captures your growth trajectory, seasonality captures the repeating calendar pattern, holidays capture the one-off spikes, and noise is everything left over that you shouldn't try to model.
This applies beyond retail. B2B pipelines follow their own seasonal rhythms - Q4 budget flush, fiscal year-end procurement surges, Q1 slowdowns. The decomposition logic is the same even when the calendar drivers differ.
Why Most Seasonal Forecasts Fail
The biggest culprit isn't the model. It's the data going into it.
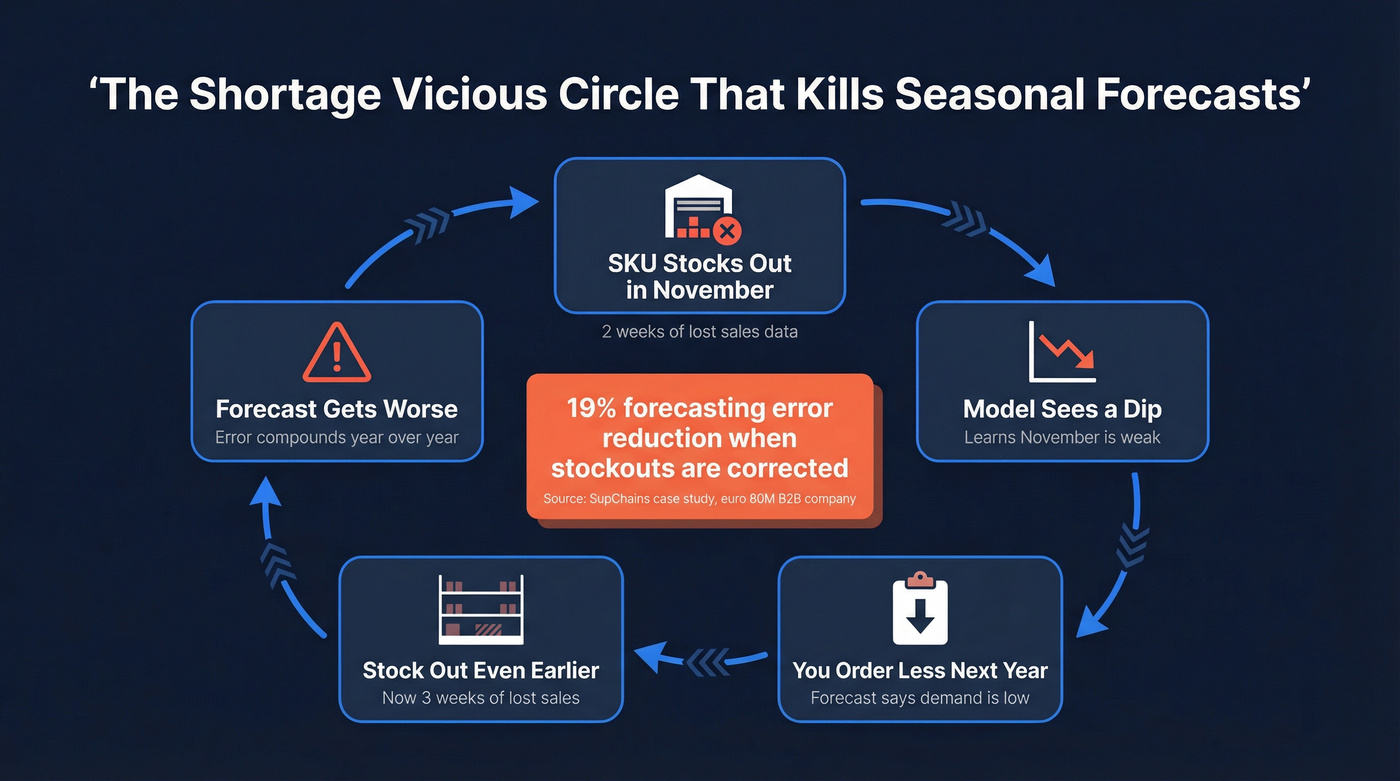
The shortage vicious circle is the most insidious failure mode. Your top SKU stocks out for two weeks in November. Sales data shows a dip. The model learns "November is weak." You order less next year. You stock out earlier. The cycle repeats. A case study from SupChains working with an €80M B2B company showed that correcting for stockout periods reduced forecasting error by 19%.
Promo distortion is the second killer. Without future promotion data, your model assumes you don't promote - producing systematically low forecasts for promotional periods.
Static seasonal calendars fail. February 2025 saw the coldest temperatures since 2022. In March 2025, temperatures swung to the warmest since 2016. If your model assumes "February = winter demand" every year, you're building on sand.
We've seen teams spend 80% of their forecasting project on data prep and 20% on model selection - and that's the right ratio. A practitioner on r/InventoryManagement put it bluntly: the frustration isn't with the math, it's with getting clean data into the math.
The Data Prep Checklist
Here's the thing: no model can rescue garbage inputs. Run through this list before you open a single notebook.
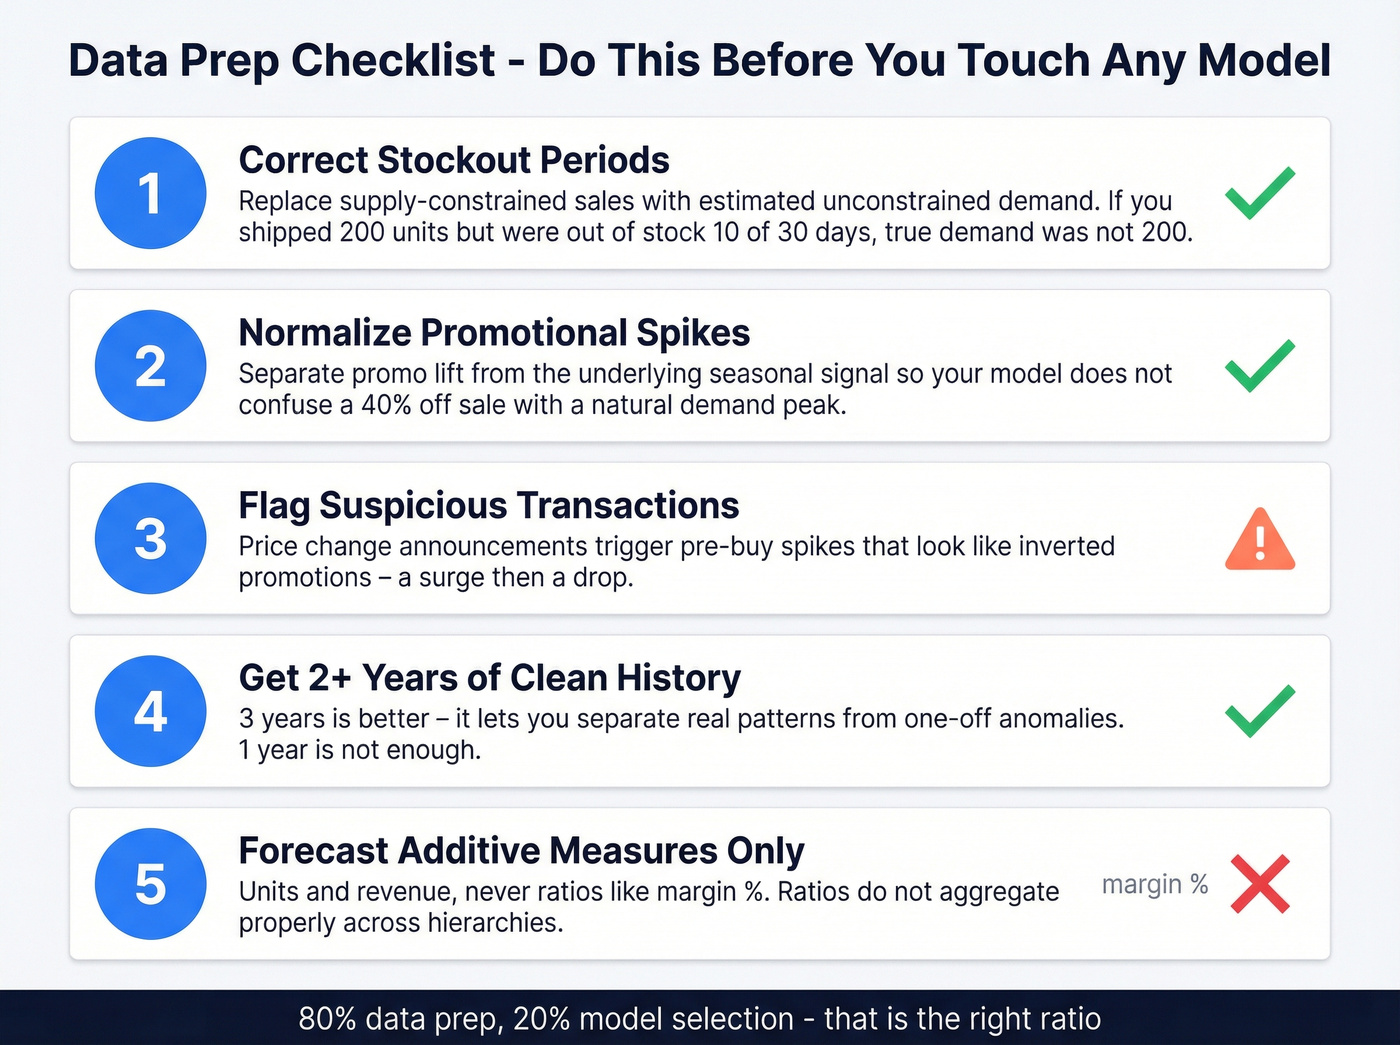
- Correct stockout periods. Replace supply-constrained sales with estimated unconstrained demand. If you shipped 200 units but were out of stock for 10 of 30 days, your true demand wasn't 200.
- Normalize promotional spikes. Separate promo lift from the underlying seasonal signal so your model doesn't confuse "we ran a 40% off sale" with "demand naturally peaks in week 38."
- Flag suspicious transactions. Price change announcements trigger pre-buy spikes that behave like inverted promotions - a surge followed by a drop.
- Ensure at least two years of clean history. Three years is better; it lets you distinguish real patterns from one-off anomalies.
- Forecast additive measures - units, revenue - never ratios like margin %. Ratios don't aggregate properly across hierarchies.
Garbage in, garbage out applies to your pipeline too. If your CRM contacts are stale, your Q4 forecast is built on the same rotten foundation as a stockout-distorted demand signal. Prospeo refreshes 300M+ profiles every 7 days - not the 6-week industry average - so your pipeline data reflects reality, not last quarter's org chart.
Stop forecasting pipeline revenue against contacts who changed jobs two months ago.
Choosing a Forecasting Method
| Method | Best When | Watch Out For |
|---|---|---|
| Holt-Winters | 2+ yrs clean data, stable seasonality | No external regressors |
| SARIMA | Strong autocorrelation, stationary data | Manual tuning; brittle with gaps |
| Prophet | Holiday/event modeling, CFO-facing reports | Often less accurate than well-tuned ML on large, feature-rich datasets |
| LightGBM / XGBoost | Large dataset, many features, max accuracy | Feature engineering; low explainability |
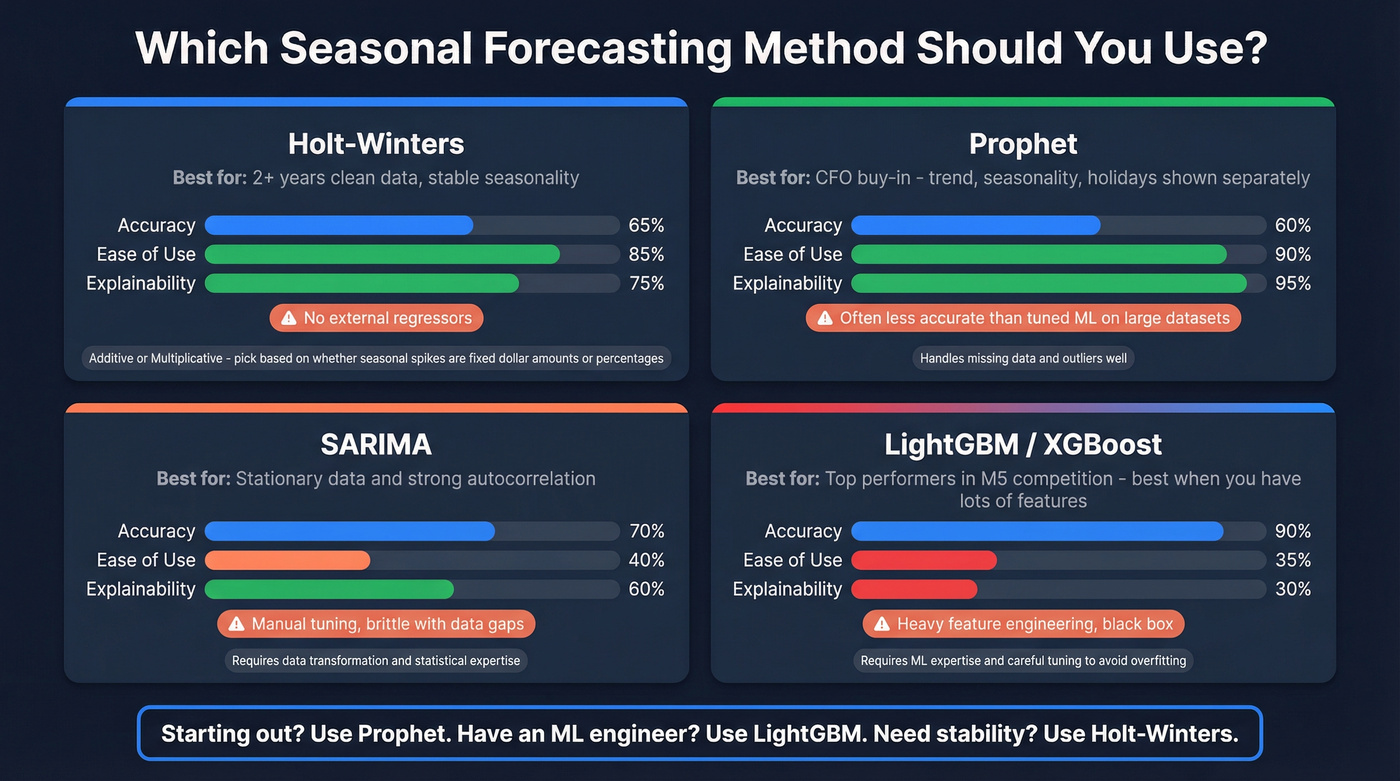
Holt-Winters comes in two flavors: additive and multiplicative. If your December spike is always roughly $50K above baseline regardless of growth, use additive. If it's always about 30% above baseline, use multiplicative.
In our experience, Prophet's interpretability wins more CFO buy-in than any accuracy improvement from gradient boosting. Leadership can see the trend, seasonality, and holiday components separately - no black box. That transparency is worth a lot when you're asking for budget based on a forecast.
Gradient boosting models were among the top-performing approaches in the M5 competition and consistently outperform classical methods on large datasets with rich features. The tradeoff is engineering effort.
Let's be honest about foundation models. TimeGPT and Chronos get a lot of hype, but for most teams in 2026, they're a distraction. One Reddit user couldn't replicate TimeGPT's results because they weren't comfortable with PyTorch. If you don't have an ML engineer on staff, Prophet with clean data will outperform a poorly implemented foundation model every time. Skip these until your team has the infrastructure to support them.
Holidays, Events, and Weather
Moving Holidays and Event Windows
Easter, Ramadan, Chinese New Year - these shift dates every year. Getting your holiday forecast right means encoding these moving targets properly. The M5 competition popularized event-window encoding: create a feature running from -15 to +15 days around the event, with 0 on event day. This captures the build-up and decay that a simple binary holiday flag misses entirely.
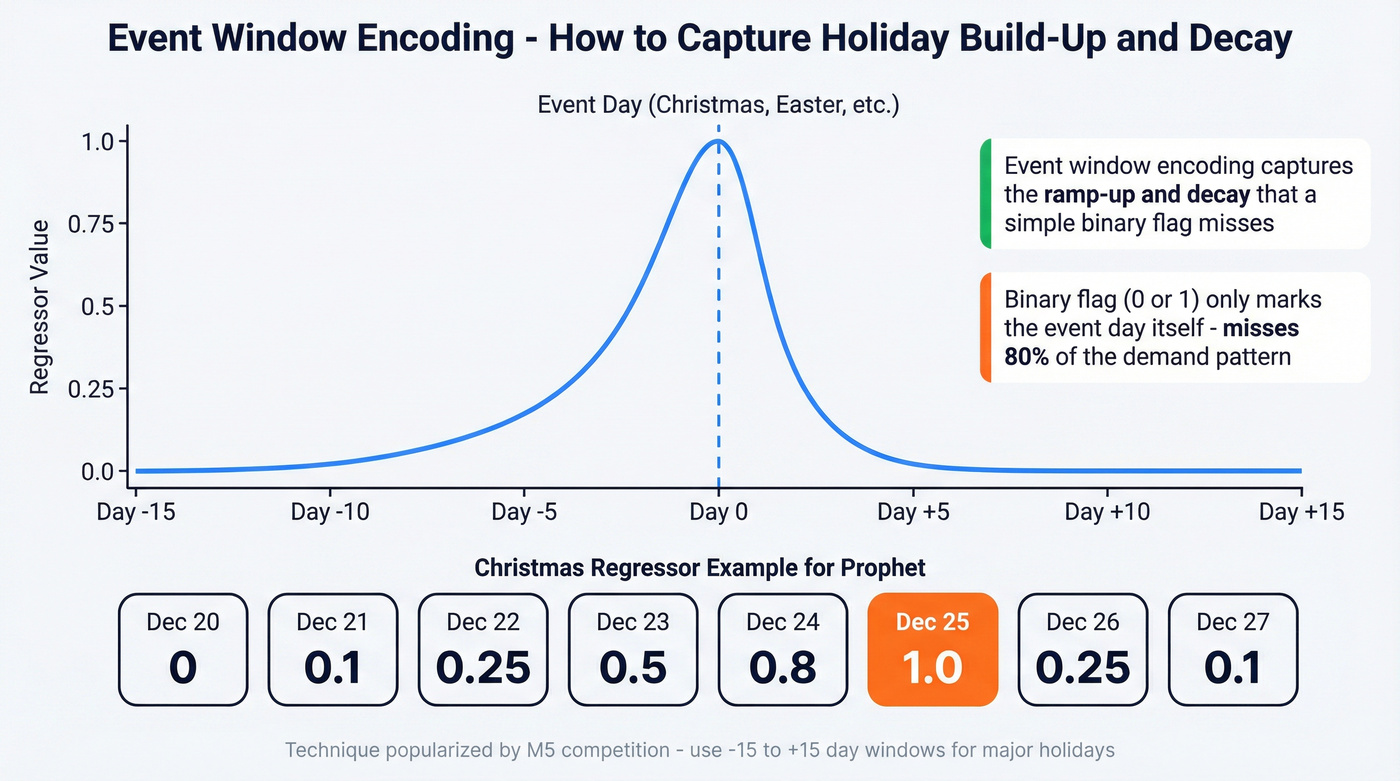
For Prophet, custom regressor shapes model this explicitly. A practical example for December 20-27: values of (0, 0.1, 0.25, 0.5, 0.8, 1, 0.25, 0.1) capture the ramp into Christmas and the sharp post-holiday drop. Build these regressors so they can be re-modeled dynamically - you don't want to hand-tune them every year.
Weather as a Demand Driver
Weather isn't a nice-to-have. It's a material demand signal.
NRF/Planalytics data makes this concrete: air conditioner demand ran 13% above normal in Kansas City while dropping 17% in NYC during the same period. Pool chemical sales fell 10% during sustained rainfall, then surged 14% in Indianapolis when heat arrived. The US saw 18 named storms in 2024 alone, and 2025 shaped up to be one of the most active severe weather years in recent memory - each major system capable of spiking generator and bottled water demand with almost no lead time.
Static seasonal calendars are a relic.
Measuring Forecast Quality
Use WMAPE, not MAPE. MAPE becomes unstable when actual values are small - dividing by near-zero inflates the percentage absurdly. WMAPE weights errors by volume, so your top sellers drive the score. Always track forecast bias alongside accuracy; a model that's consistently 10% high is more useful and fixable than one that's randomly 20% off in both directions.
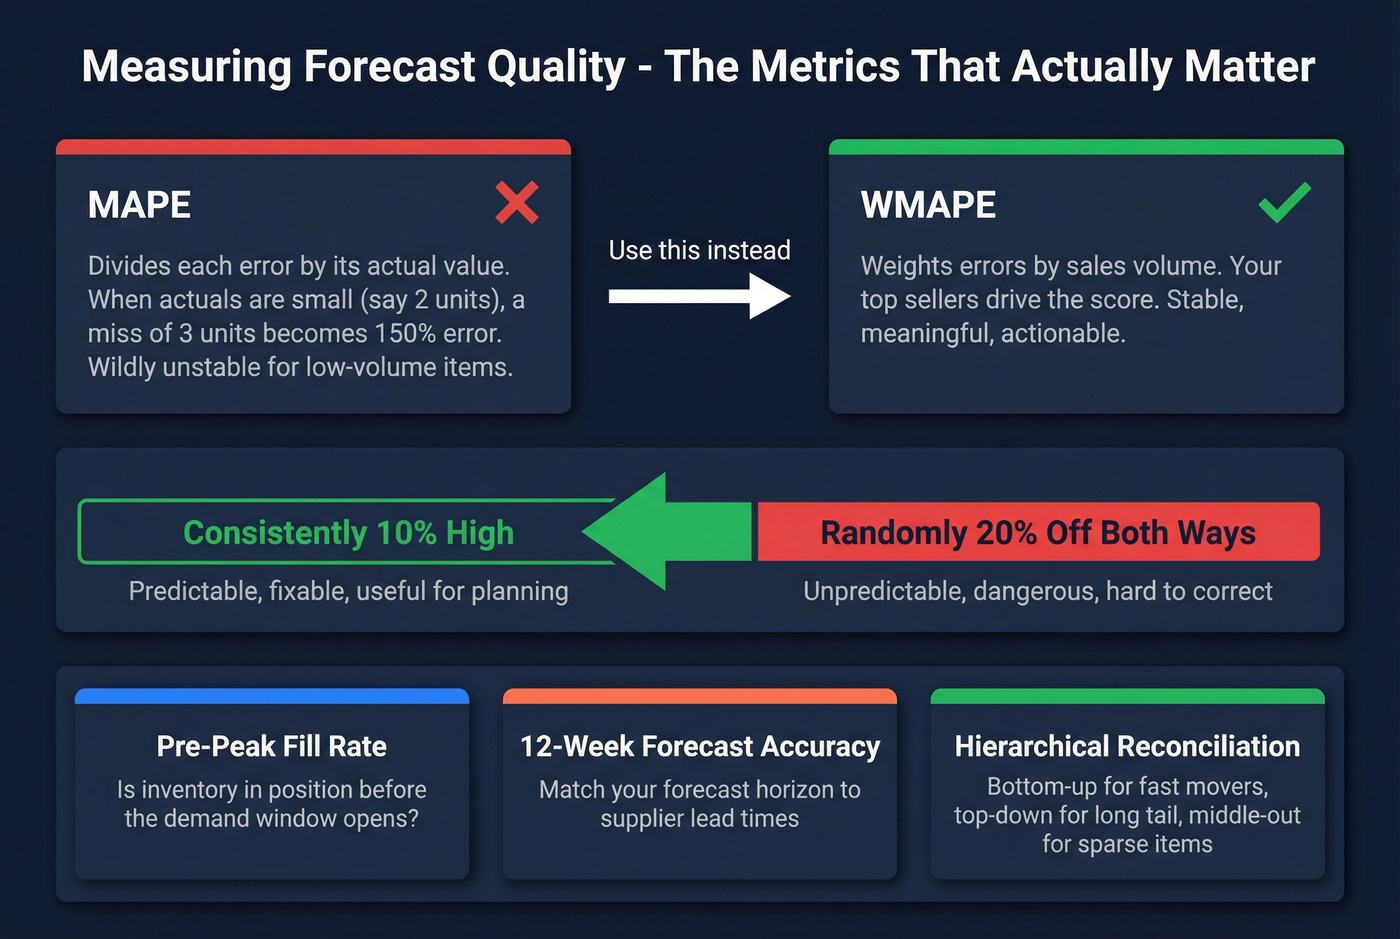
Track pre-peak fill rate - the percentage of seasonal inventory in position before the demand window opens - as your execution readiness metric. This is the number that tells you whether your forecast actually translated into action in time.
Connect forecast horizons to supplier lead times. If your lead time is 12 weeks, your 12-week forecast accuracy is the number that determines fill rates. For hierarchical reconciliation, use bottom-up for fast movers, top-down for the long tail, and middle-out for sparse or new items.
Seasonal Patterns Beyond Inventory
Sales pipelines are seasonal too - Q4 budget flush, Q1 slowdowns, summer lulls. When you're ramping outbound for a peak season, bad contact data compounds the problem. Bounced emails during a narrow seasonal window waste the exact weeks you can't afford to waste.
We've watched teams lose entire peak windows because 30% of their prospect list bounced. Tools like Prospeo, with its 7-day data refresh cycle and 98% email accuracy, exist specifically so your outbound campaigns during peak seasons don't lose momentum to stale contacts. If you're planning a seasonal push, verify your list first.
Seasonal spikes in B2B - budget flush, fiscal year-end surges, Q1 slowdowns - only convert if you're reaching the right buyers at the right time. Prospeo's intent data tracks 15,000 topics so you can layer in-market signals on top of your seasonal forecast and prioritize accounts that are actually ready to buy.
Pair your seasonal forecast with real-time buyer intent for 26% more meetings.
Seasonal Sales Forecasting FAQ
What's the difference between seasonal and cyclical demand?
Seasonal patterns repeat on a fixed calendar - holidays, weather, back-to-school. Cyclical patterns follow irregular economic cycles with no fixed period. Your forecasting model handles the first; scenario planning handles the second.
How many years of data do I need?
Two full years minimum to establish a repeatable pattern. Three is better because it separates genuine seasonal signals from one-off anomalies. With only one year, you can't tell if a December spike is structural or a fluke.
Is MAPE a good accuracy metric?
Use WMAPE instead. MAPE becomes wildly unstable when actual values are small, inflating error percentages to meaningless levels. WMAPE weights errors by sales volume, so your highest-selling items drive the score. Always track directional bias alongside it.
Can I use AI for seasonal demand forecasting?
LightGBM and XGBoost consistently outperform classical methods on large, feature-rich datasets. Foundation models like TimeGPT show promise but require ML engineering skill to implement well. For most teams in 2026, Prophet or Holt-Winters with clean data is the sensible baseline - and it'll beat a poorly tuned neural net.
How do seasonal patterns affect B2B sales pipelines?
B2B buying follows its own calendar - fiscal year-end procurement, Q4 budget flush, summer decision-maker vacations. Timing outbound campaigns to these windows matters as much as the message itself. The worst thing you can do is nail the timing but send to a stale list.