TAM Analysis: The Operator's Guide to Market Sizing That Survives Due Diligence
A co-founder drops "$50B TAM" on slide 7 - and just like that, the conversation is over. The partner across the table doesn't nod. She writes "fuzzy math" in her notes and moves on. The frustrating part? The company might've had a real market. They just couldn't prove it.
Market sizing doesn't have to be fiction. But most of the time, it is. A blunt r/startups thread puts it this way: TAM slides often devolve into "random assumptions" polished for investor comfort. Let's build something that actually holds up.
The Short Version
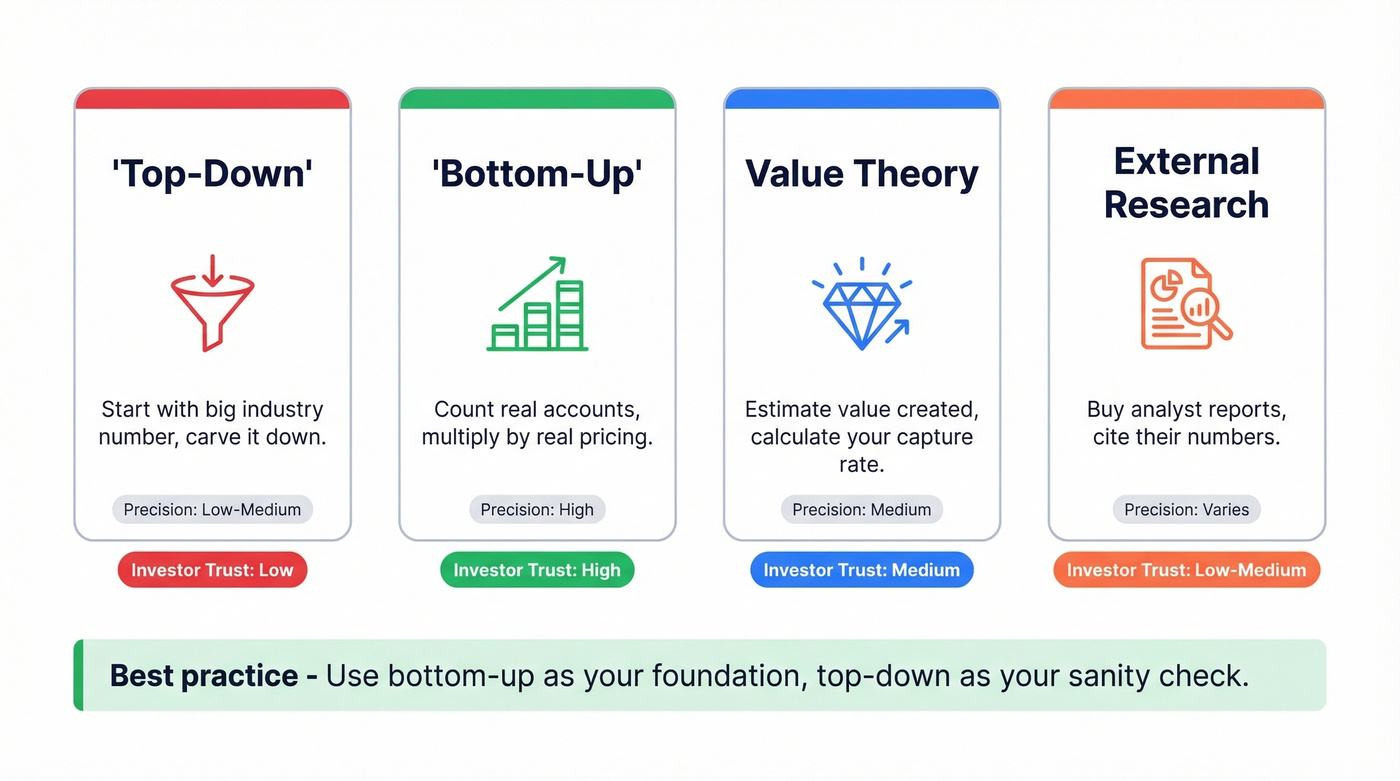
Use bottom-up methodology. Count real accounts, multiply by real pricing. Top-down is a sanity check, not a strategy.
Source your inputs from free government datasets like Census, BLS, and County Business Patterns, then use B2B data platforms for company-level counts. The data exists - most founders just don't know where to look.
Present TAM as an argument backed by assumptions and sources, not a single impressive number on a slide. Investors fund logic, not magnitude.
What Is TAM Analysis?
TAM analysis is the process of quantifying the total revenue opportunity for a product or service if you captured 100% of the market. It's the ceiling.
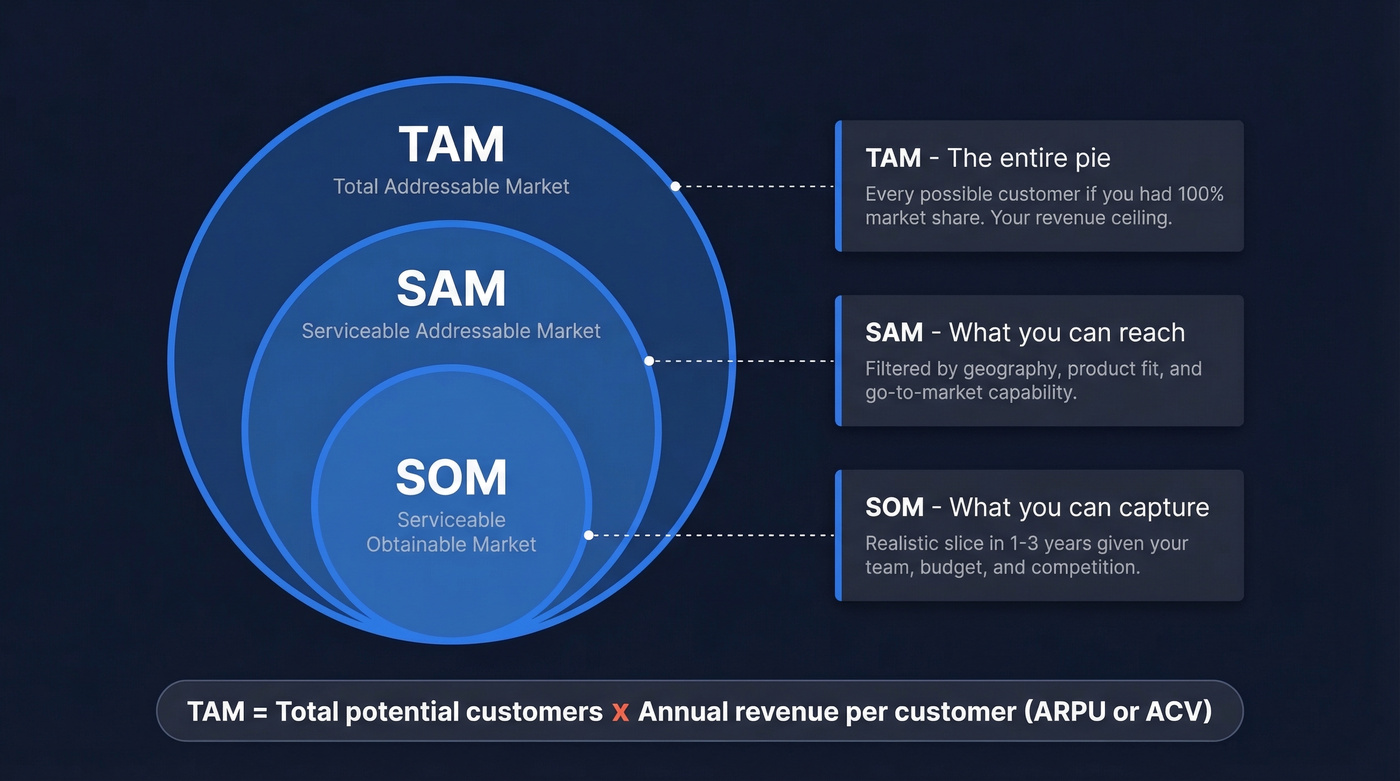
Think of it as three nested layers. TAM (Total Addressable Market) is the entire pie. SAM (Serviceable Addressable Market) narrows to the segment you can actually reach - filtered by geography, product fit, and go-to-market capability. SOM (Serviceable Obtainable Market) is the realistic slice you can capture in one to three years given your current resources and competition. SOM also accounts for supply-side constraints: your onboarding bandwidth, support team size, or production capacity can cap what you can actually deliver.
The foundational formula is simple: TAM = Total potential customers x Annual revenue per customer (ARPU or ACV). Everything else is about making those two inputs defensible.
Why Market Sizing Matters
TAM serves two audiences, and they care about different things.
For investors, TAM is a filter. Venture-scale outcomes typically require a market north of $20B to plausibly reach $1B in annual revenue - a common SaaS investing heuristic. A path to $100M revenue in roughly 10 years usually implies a TAM of at least $5B. Below that, the fund math doesn't work: VCs targeting 3x fund returns need power-law outcomes, and a small TAM caps the upside.
We've reviewed dozens of TAM slides, and the ones that survive always show bottom-up logic. The ROI math investors run in their heads goes something like this: your TAM is $2B, your SAM is $100M, and you project $5M SOM in two years. At a 25% EBITDA margin and an 8x exit multiple, an early investor putting in $250K for 20% gets roughly an 8x return. That's the napkin math that keeps a conversation going.
For operators, total addressable market analysis drives territory sizing, hiring plans, and quota setting. If your TAM for a specific segment is $20M and you need $5M in new ARR, you need 25% market penetration - which tells you whether your sales team is sized correctly or you're setting people up to fail.
Four Methods for Calculating TAM
| Method | Starting Point | Data Sources | Precision | Investor Credibility |
|---|---|---|---|---|
| Top-Down | Industry reports | Gartner, IDC, OECD | Low-Medium | Low (easy to inflate) |
| Bottom-Up | Customer counts | Census, BLS, B2B databases | High | High |
| Value Theory | Value created | Customer interviews, ROI models | Medium | Medium (new categories) |
| External Research | Analyst estimates | Published reports, benchmarks | Varies | Low-Medium |
Top-Down
Start with a broad industry number from an analyst report, then carve it down by geography, segment, and product relevance. It's fast, but it's also how you end up with a "$50B TAM" that means nothing. Investors see through it because the assumptions are hidden inside someone else's report.
Bottom-Up
Count the actual companies or people who could buy your product, then multiply by what they'd pay. This is the approach that survives due diligence because it forces you to define your ICP, justify your pricing, and show your work. Every serious investor prefers it.
Value Theory
Useful when you're creating a new category and there's no existing market to measure. Estimate the value your product creates for customers, then calculate what percentage you can capture as revenue. A classic value-theory wedge is luxury buyers willing to pay $80K+ for a differentiated first version of a product, before the category expands downmarket.
External Research
Buy an off-the-shelf report from Gartner or IDC and cite their number. It's better than nothing, but it's someone else's analysis with someone else's assumptions. Use it as a cross-check, not a foundation.
Here's the thing: most startups don't need a $50B TAM. If your deal sizes are under $10K and you're selling to a niche vertical, a $500M bottom-up TAM with a clear path to 5% penetration is more fundable than a hand-wavy $10B number. Investors don't fund big markets - they fund founders who understand their market deeply enough to capture it.
Bottom-up TAM analysis lives or dies on your account count. Prospeo's B2B database gives you 30+ filters - industry, headcount, revenue, technographics, and buyer intent - across 300M+ profiles so you can size your addressable market with company-level precision, not analyst guesswork.
Turn your ICP definition into a defensible account count in minutes.
Bottom-Up TAM Analysis: Step by Step
Every guide tells you to multiply ARPU by total customers. The hard part is finding that total customer number. Let's walk through it.
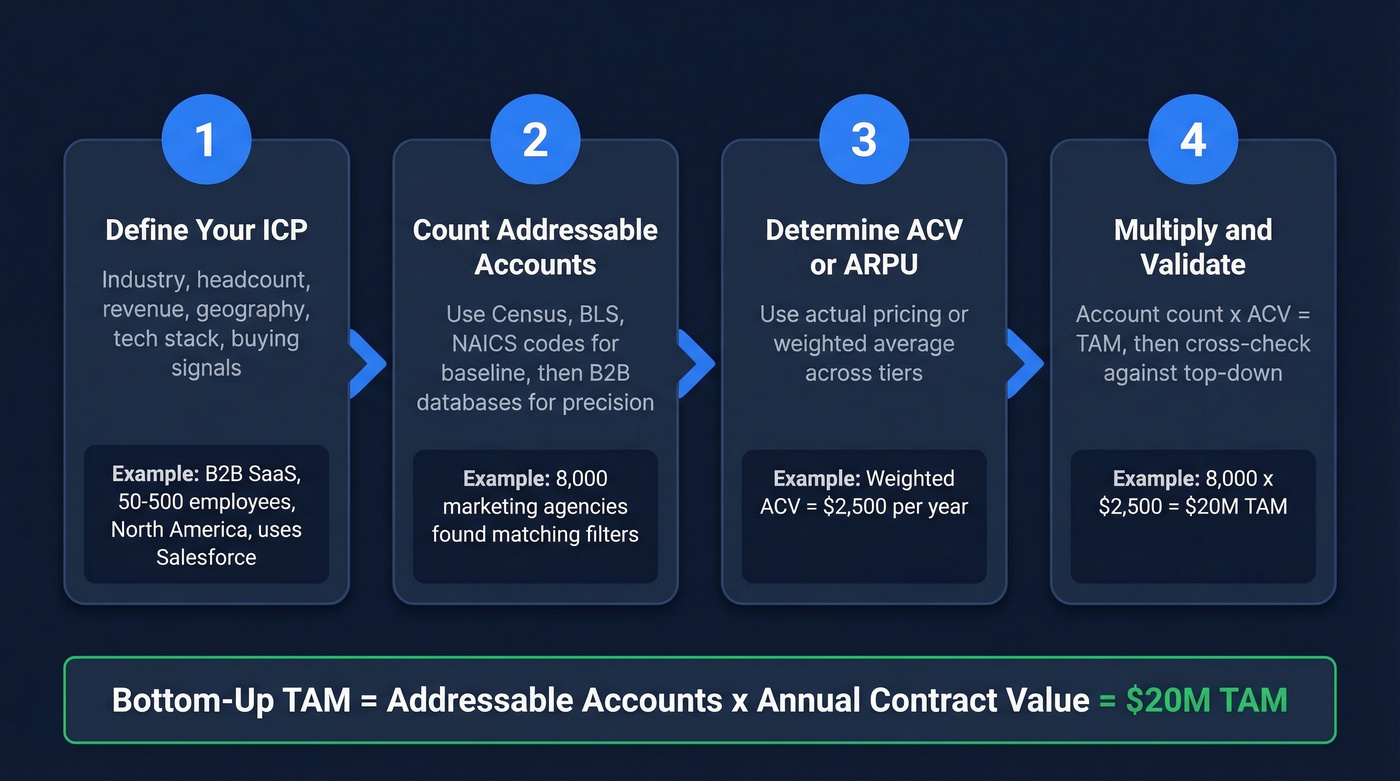
Define Your ICP
Get specific. Industry vertical, company size (headcount and revenue), geography, tech stack, and buying signals. "Mid-market SaaS companies" isn't an ICP. "B2B SaaS companies with 50-500 employees in North America using Salesforce and actively hiring SDRs" is an ICP.
Count Addressable Accounts
This is where most founders get stuck. Government datasets give you industry-level counts, but you need company-level precision. A B2B data platform makes this step take minutes instead of weeks - Prospeo's database, for example, covers 300M+ professional profiles with 30+ search filters, so you can filter by industry, headcount, revenue, and technographics to get your account count quickly.

You've sized the market - now reach it. Prospeo turns your TAM account list into verified contact data: 98% accurate emails at $0.01 each, 125M+ direct dials, and intent signals across 15,000 topics. Go from market sizing to pipeline in the same platform.
Move from TAM slide to booked meetings without switching tools.
Determine ACV or ARPU
Use your actual pricing if you have customers. If you're pre-revenue, use a weighted average across planned tiers. For seat-based SaaS, the formula becomes: TAM = customers x seats per customer x price per seat.
Multiply and Validate
Multiply your account count by your ACV. Then gut-check the result against a top-down estimate. If your bottom-up TAM is $20M but the top-down industry report says $500M, either your ICP is too narrow or the report is too broad. Both are useful signals.
Worked example: You sell to marketing agencies in North America with 10-50 employees. A B2B database search reveals 8,000 matching agencies. Your weighted ACV across tiers is $2,500. That's 8,000 x $2,500 = $20M TAM for that ICP slice.
A simple spreadsheet with four columns - ICP segment, account count, ACV, and segment TAM - is all you need to present this cleanly. Free TAM/SAM/SOM templates for Google Sheets and Excel are widely available; grab one and customize it to your segments.
Where to Get Data
| Source | What It Gives You | Cost | Best For |
|---|---|---|---|
| US Census Bureau | Business counts by industry/size/state | Free | US market baseline |
| Bureau of Labor Statistics | Employment by role/industry | Free | Seat-based TAM |
| County Business Patterns | County-level establishment counts | Free | Geo-specific sizing |
| OECD Data | International macro indicators | Free | Global TAM |
| SEC Filings | Financial/operational data | Free | Public company analysis |
| NAICS Codes | Industry classification backbone | Free | Segmentation structure |
| Prospeo | 300M+ profiles, 30+ filters | Free tier; ~$0.01/email | Company-level account counting |
| Gartner / IDC | Market forecasts, competitive landscape | ~$2K-$15K/report | Top-down validation |
| IBISWorld | Industry reports mapped to NAICS | ~$1K-$3K/report | Sector deep-dives |
| PitchBook | Company/funding data | ~$20K-$50K+/year | VC-grade company data |
| Crunchbase | Startup/company profiles | Free-$49/mo Pro | Early-stage company counts |
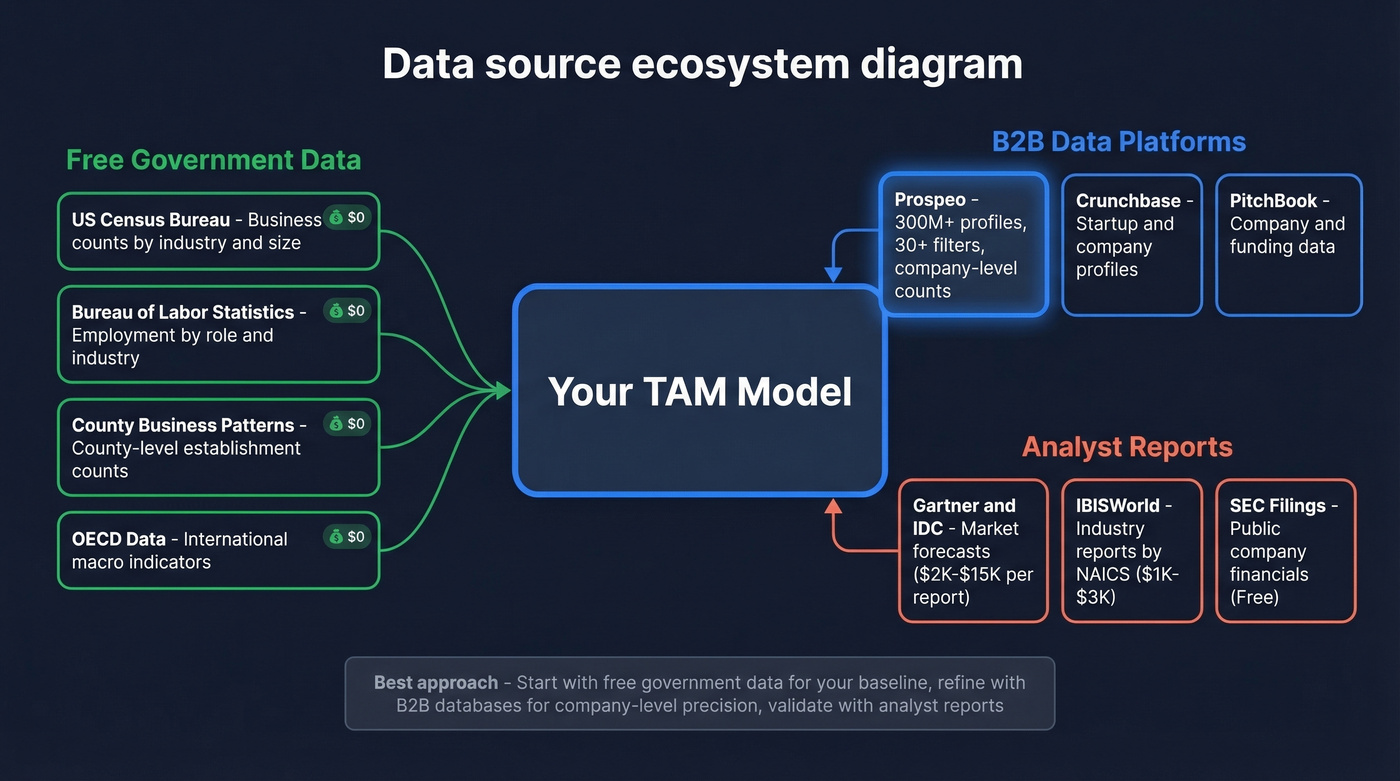
NAICS codes are the structural backbone of any US-focused TAM. Every business gets a code, and you can use them to group relevant industries and pull counts from Census or CBP data. Go to data.census.gov, filter by NAICS code and employee size, and export establishment counts by state. That gives you your denominator for any US-focused bottom-up calculation.
From there, refine with a B2B database for company-level granularity - matching on technographics, growth signals, or funding stage that Census data can't capture. Combining public datasets with commercial databases is what separates rigorous market sizing from back-of-napkin guesswork.
Worked Examples
Small Market: Hospital Software in Australia
$1.35M. That's the entire TAM for medical records software sold to Australian hospitals. There are 1,352 hospitals in Australia, and a $1,000/year license gives you a ceiling that's too low for venture capital but potentially a solid bootstrapped business. The number isn't good or bad - it's honest. And honesty is what separates a defensible TAM from a fantasy.
Mid-Complexity: B2B SaaS ($3.76B)
You sell a collaboration tool to businesses globally. Your research identifies 1,000,000 potential businesses. Average deployment is 20 seats at $188/seat/year.
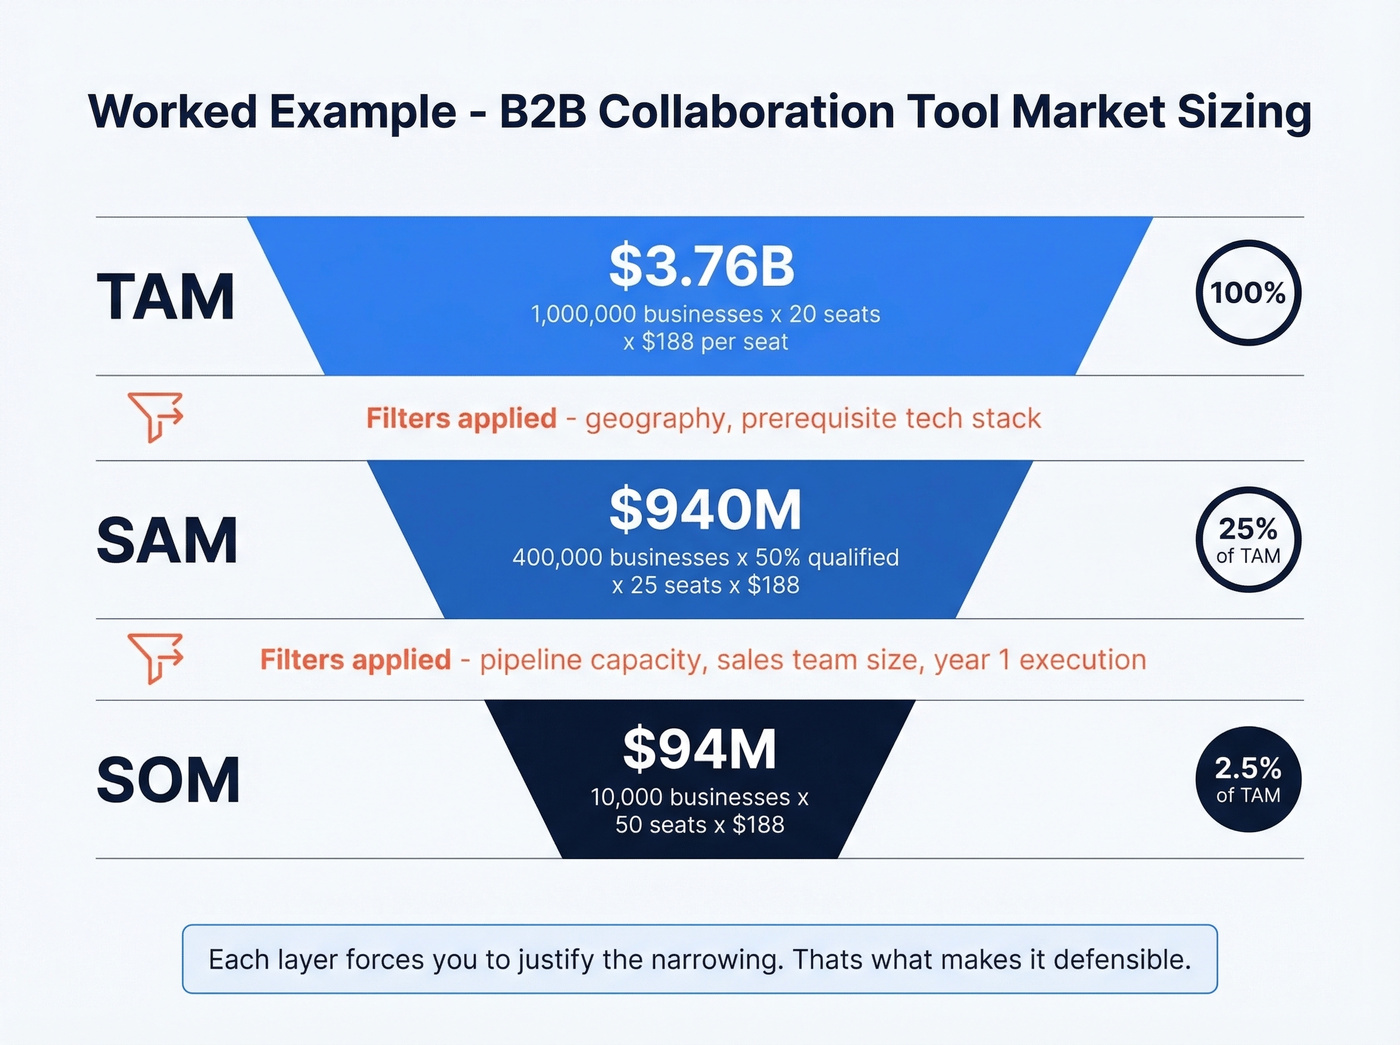
TAM = 1,000,000 x 20 x $188 = $3.76B
Now narrow it. Only 400,000 businesses are in your serviceable geographies, and 50% have the prerequisite software stack. Average seats jump to 25 for qualified accounts.
SAM = 400,000 x 0.50 x 25 x $188 = $940M
Your realistic capture in year one, based on pipeline and sales capacity: 10,000 businesses at 50 users each.
SOM = 10,000 x 50 x $188 = $94M
Enterprise Scale: WeWork
Toptal's analysis of WeWork shows how enterprise-scale market sizing works when you break it down honestly.
| Layer | Value | % of TAM | Key Constraints |
|---|---|---|---|
| TAM | $1.35T | 100% | Global commercial real estate |
| SAM | $168B | 12.4% | Geographic, cultural, regulatory filters |
| SOM | $33.8B | 2.6% | Competitive forces, execution capacity |
Those percentages are what matter. SAM at 12.4% and SOM at 2.6% tell investors you've thought about constraints, not just opportunity. Any time your SOM exceeds 5% of TAM without a clear explanation, expect pushback.
Airbnb's Sub-Bucket Approach
Airbnb didn't pitch "the global hospitality market." They broke TAM into sub-buckets: short-term rentals, mid-term stays, and experiences. Each bucket had its own customer count and ACV. This sub-bucket approach is worth stealing - it shows investors you understand which segments drive revenue and which are aspirational.
How Investors Evaluate Your TAM
Investors use TAM/SAM/SOM as a three-layer filter. TAM is the ambition ceiling - could this be a billion-dollar outcome if everything breaks right? SAM is where you win today. SOM is execution realism, grounded in acquisition data, CAC, and pipeline conversion.
"We only need 1% of the market" is the fastest way to lose credibility in a pitch. It signals you haven't thought about how you'll actually acquire customers. It's not reassurance - it's a tell.
A review of 50 pitch decks found that market sizing slides built on fuzzy math with no sourcing were among the most common "dead weight." If you want to see how modern startups present TAM, there are public swipe files with 100+ funded pitch decks from recent rounds - study the patterns.
Stop obsessing over your TAM number. Obsess over your TAM logic.
TAM isn't static, either. Uber's initial TAM was estimated at $100B based on taxi and limo revenue. By 2022, gross bookings exceeded $26.4B per quarter - the market expanded because the product changed behavior. Zoom's pre-COVID TAM was $43B for corporate video conferencing; annual revenue blew past $4B by 2021 as remote work redefined the category. The best companies don't just capture TAM - they expand it.
Mistakes That Kill Credibility
Relying solely on top-down. Citing a Gartner number without showing how you derived your slice is lazy. Always validate with bottom-up.
"We only need 1%." In our experience, this line kills more pitches than bad financials. Replace it with a bottoms-up SOM based on pipeline math.
Ignoring competition. A $10B TAM with three entrenched incumbents holding 80% share means your realistic opportunity is far smaller. Account for competitive dynamics.
Using stale data. Census data is typically a couple years behind. Analyst reports age fast. Cross-reference multiple sources and note publication dates.
Conflating TAM with SAM. Your TAM isn't your market. If you sell in English to US mid-market companies, don't cite the global enterprise number.
No sourcing on slides. Every number on your TAM slide needs a footnote. "Internal analysis based on Census Bureau data + B2B database account counts" is far more credible than a naked $5B.
Treating TAM as static. Markets expand and contract. Build in a "TAM expansion" narrative if your product creates new demand - but back it with analogies and logic, not wishful thinking.
FAQ
What's the difference between TAM, SAM, and SOM?
TAM is the total revenue opportunity at 100% market share. SAM narrows to the segment you can serve based on geography, product fit, and go-to-market reach. SOM is the realistic share you can capture in one to three years given sales capacity and competitive pressure. Most investor decks need all three layers with clear filtering logic between each.
Which TAM method do investors prefer?
Bottom-up, because it forces you to define your ICP, count real accounts, and justify pricing - all signals of deep market understanding. Top-down is useful only as a sanity check. In our experience, decks that lead with bottom-up numbers get two to three times more follow-up questions about execution rather than skepticism about the market.
How do you count addressable accounts?
Start with government datasets like Census and BLS for industry-level counts, then refine with a B2B data platform to filter by headcount, revenue, technographics, and buyer intent for company-level precision. This gives you a defensible, auditable account count rather than a guess.
How often should you update your TAM?
Revisit your TAM analysis at least annually - markets shift as competitors enter, regulations change, and adjacent categories emerge. If you've launched a new product line or expanded geographically, update immediately. Stale numbers erode investor confidence faster than small ones.
What's a good TAM for a startup?
Venture-backed startups typically need $5B+ to justify fund math, while bootstrapped businesses can thrive under $100M with strong unit economics. The "right" TAM isn't about size - it's about whether the number is defensible and the path to capturing your SOM is clear and grounded in pipeline data. Skip the vanity number and focus on showing investors you know exactly who your customers are and how you'll reach them.