TAM in Sales: The Metric Everyone Calculates and Nobody Uses Right
Your CEO walks into the Monday standup and asks how big the market is. You've got 48 hours to put a number on a slide. So you Google "SaaS market size," find a Gartner figure, slap it into a deck, and move on.
That number has almost nothing to do with how your reps should spend their Tuesday morning.
TAM in sales isn't a pitch-deck exercise. It's the foundation of territory plans, quotas, and pipeline targets - and most teams get the definition right while getting the execution completely wrong. Let's break down what actually matters.
What Does TAM Mean?
TAM - total addressable market - is the total revenue you'd generate if every possible customer bought your product. It's the ceiling, not the forecast. The formula is straightforward:
Total Addressable Accounts x Average Contract Value = TAM
Say you sell HR analytics software to mid-market tech companies. If 45,000 of those companies exist and your average deal is $25,000/year, your TAM is $1.125 billion. That sounds massive. It's supposed to - the total addressable market is the theoretical maximum, not a sales target.
For context, the global SaaS market was $317.55 billion in 2024 and is projected to hit $1.23 trillion by 2032. Your slice of that pie is what matters, and defining that slice is where most teams fall apart.
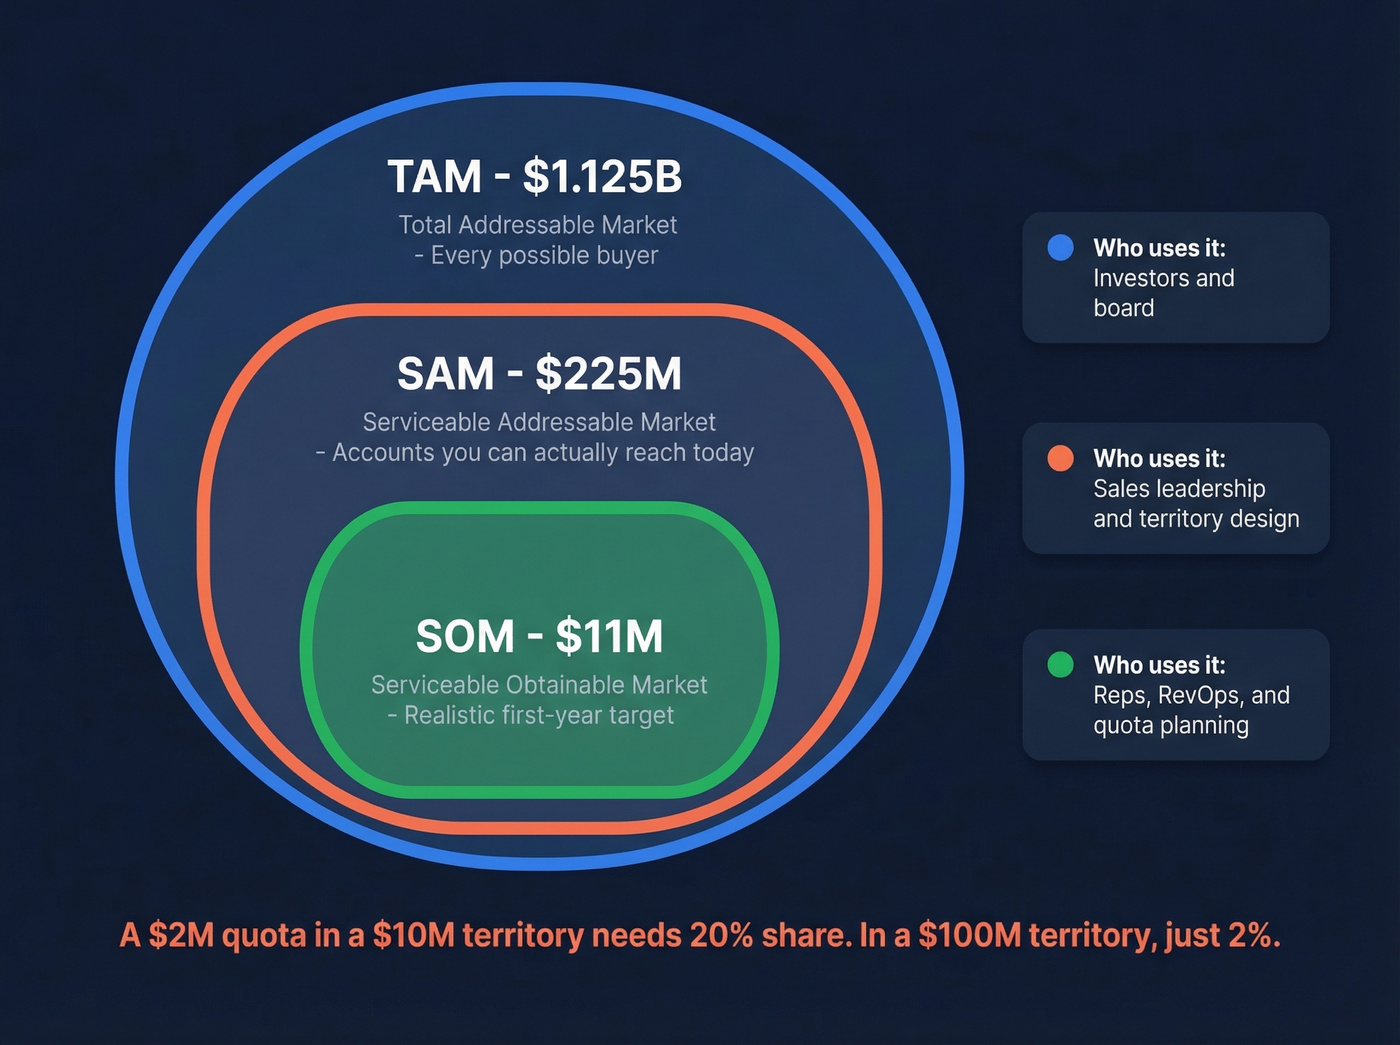
TAM vs SAM vs SOM
Three acronyms, three levels of reality:
| Metric | What It Means | Who Uses It | Sales Example |
|---|---|---|---|
| TAM | Total market at 100% share | Investors, execs | $1.125B (all mid-market tech) |
| SAM | Segment you can serve today | Sales leadership | $225M (US, 1K-5K employees) |
| SOM | Share you'll realistically win | Reps, RevOps | $11M (first-year target) |
The distinction isn't academic. A $2M quota in a $10M territory requires 20% market share. That same $2M quota in a $100M territory requires 2%. Same rep, same effort, wildly different odds. 42% of startups fail because they misjudge market demand, and sales teams make the same mistake when they set quotas against TAM instead of SOM.
Here's the essential takeaway: TAM sets the ceiling and tells the board how big the opportunity could get. SAM tells you where to deploy reps. SOM tells you whether your plan is sane.
How to Calculate Your Total Addressable Market
Three methods exist. Only one matters for sales planning.
Top-Down Method
Start with an analyst report - Gartner, Forrester, IDC - that sizes your market. Take the total number, carve out your segment, and call it done. It's fast, it looks credible on slides, and it's almost useless for sales execution because these reports aren't built around your exact ICP and they define markets differently than you do. Fine for investor decks. Don't build territories on it.
Bottom-Up Method
This is the only method that matters for sales planning:
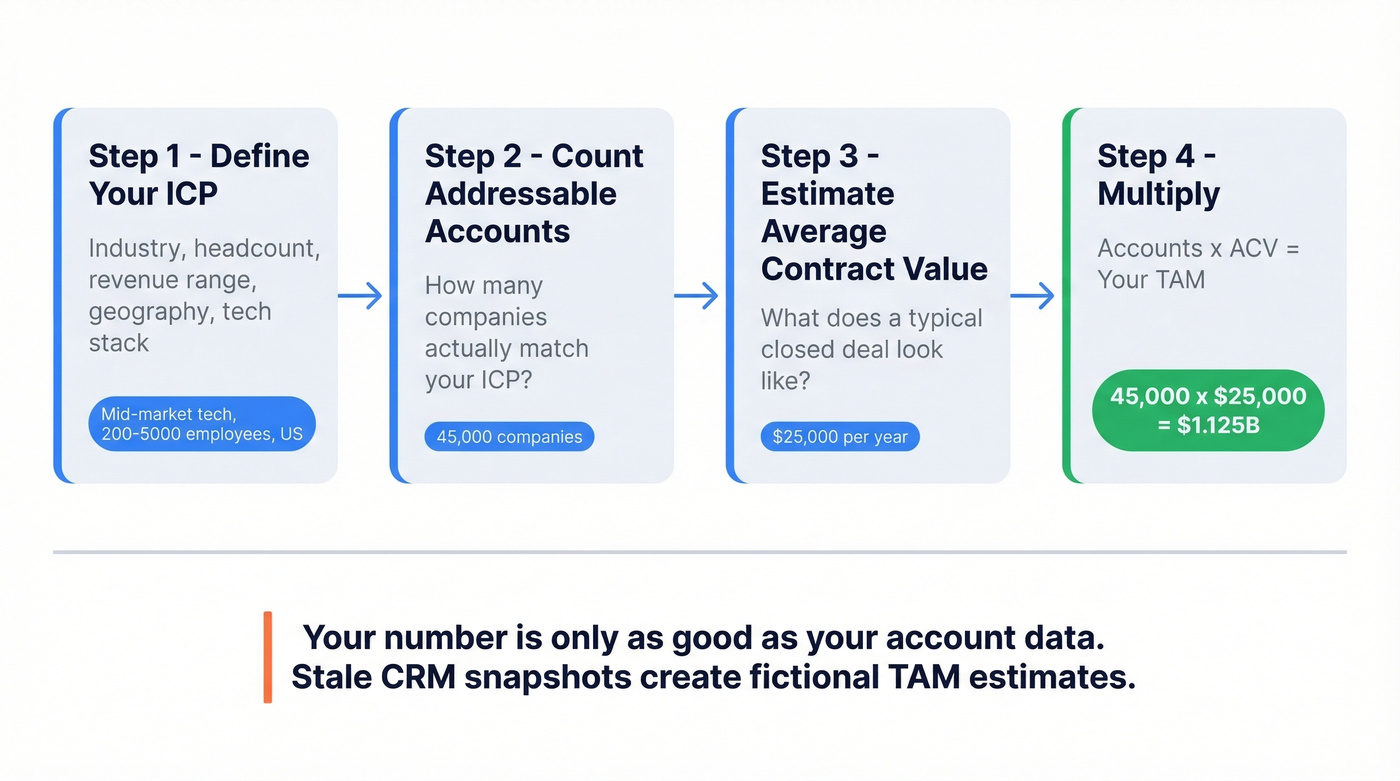
- Define your ICP - industry, headcount, revenue range, geography, tech stack
- Count addressable accounts - how many companies actually match?
- Estimate ACV - what does a typical deal look like?
- Multiply - accounts x ACV = TAM
The worked example: 45,000 mid-sized tech companies x $25,000 ACV = $1.125B. A Reddit practitioner put it even more simply: 10,000 target users x $100 x 12 months = $12M. Bottom-up forces you to prove every assumption with real data, and that's what makes the calculation reliable rather than aspirational.
Your bottom-up number is only as accurate as your account data. We've found that using Prospeo's 30+ filters - industry, headcount, revenue, geography, technographics, funding stage - on a 7-day refresh cycle gives you account counts that reflect current reality, not a six-month-old CRM snapshot.

Value Theory Method
When you're creating a new category and no existing market data exists, estimate the total value your product creates for customers, then assume you'll capture 10-20% of that value. It's the least precise method, but for genuinely novel products it's sometimes the only option. Use it as a sanity check, not a planning tool.
Your bottom-up TAM calculation depends on accurate account counts - not six-month-old CRM snapshots. Prospeo's 300M+ profiles with 30+ filters (industry, headcount, revenue, technographics, funding) refresh every 7 days, so your market sizing reflects reality. Count your addressable accounts for ~$0.01 per verified contact.
Build your TAM on real data, not guesswork.
Territory design and quota math fall apart when your account list is incomplete or outdated. Prospeo gives you the full picture: 300M+ profiles, 143M+ verified emails at 98% accuracy, and 125M+ mobile numbers - all on a 7-day refresh cycle. Stop setting quotas against stale data.
Turn your TAM into territories your reps can actually win.
How to Use TAM in Sales Planning
Calculating the number is step one. Connecting it to daily execution is where most organizations stall.
Territory Design
TAM and SAM are primary inputs to territory design. You can't assign accounts fairly if you don't know how much opportunity exists in each geography, vertical, or segment. Companies with optimized territories see roughly 15% higher revenue, and territory design alone can drive a 2-7% sales lift. Yet only 46% of second-line sales managers describe their operating model as predictable or scalable.
We've watched reps burn entire quarters on territories that were broken from day one. The gap between "we calculated the market" and "we used it to design territories" is where most of that unpredictability lives. Udemy cut annual territory planning time by 80% by shifting to in-year adjustments - proof that market-driven territory design isn't a one-and-done exercise.
Quota Setting
Look, your top rep missed quota three quarters in a row, and it's not her fault. If her territory's SAM is $5M and her quota is $1.5M, you're asking for 30% market share. That's unrealistic in almost any B2B segment.
Run the "market share required" test on every territory before finalizing quotas:
Rep Quota / Territory SAM = Required Market Share
If any territory requires more than 15-20% share to hit plan, redesign the territory or adjust the number. The 10.8x sales velocity gap between top and average performers is real, but territory design is a controllable variable that most leaders ignore.
If your average deal size is under five figures and you're spending weeks modeling market size with analyst reports, you're over-engineering the problem. Spend that time building a clean account list bottom-up and start dialing. The math matters, but only if it changes what reps do on Monday morning.
Pipeline Coverage Math
Your total addressable market flows into a chain that ends at daily activity targets:
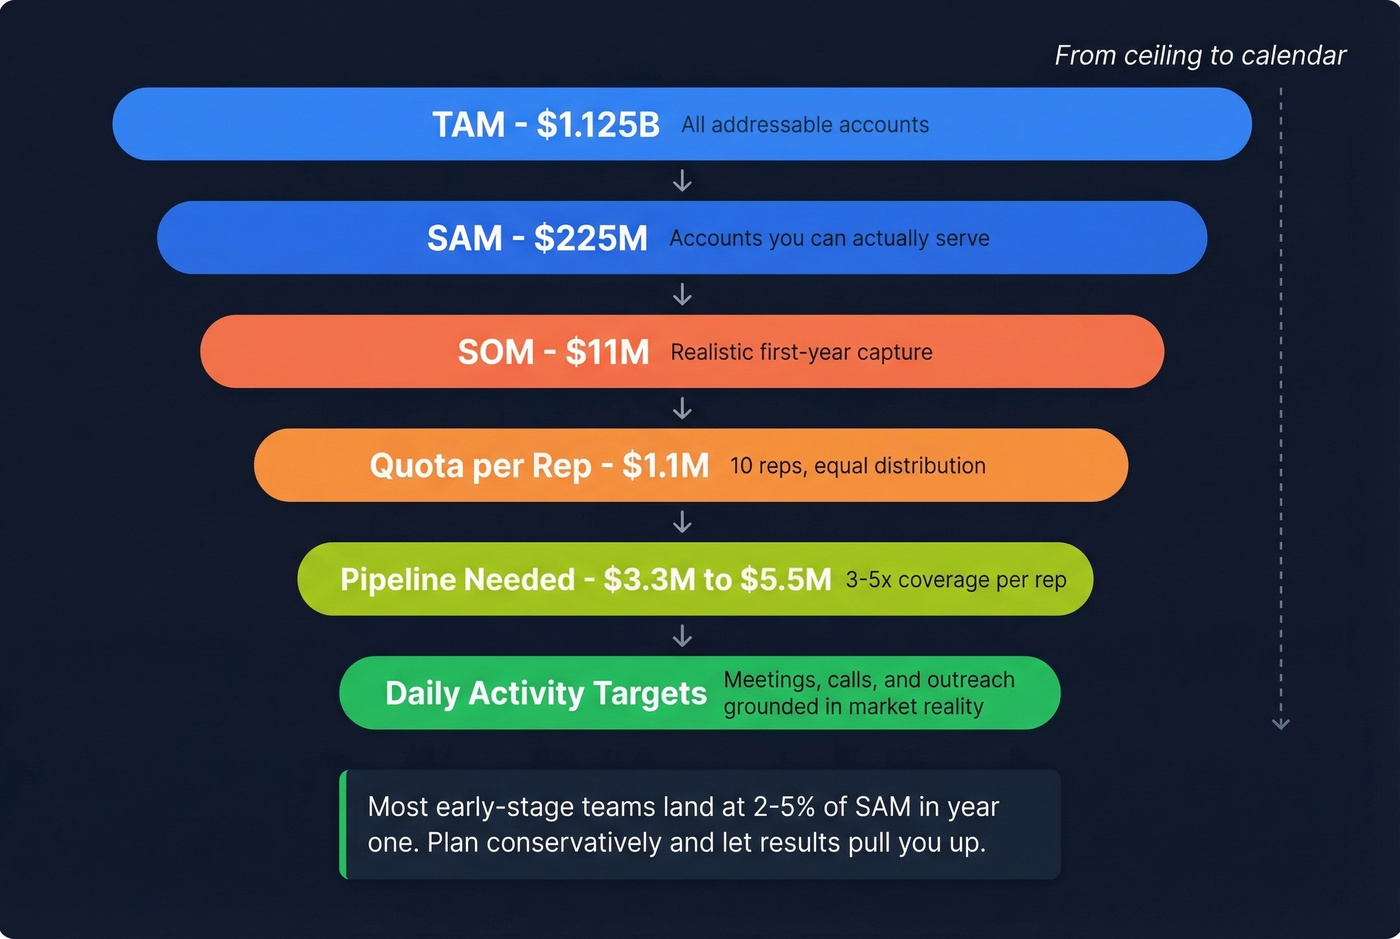
- TAM: $1.125B (all addressable accounts)
- SAM: $225M (accounts you can actually serve)
- SOM: $11M (realistic first-year capture)
- Quota per rep (10 reps): $1.1M each
- Pipeline needed (3-5x coverage): $3.3M-$5.5M per rep
That means each rep needs several multiples of their quota in qualified pipeline, and that pipeline has to come from real, contactable accounts in their territory. Work backward from pipeline to meetings to outreach volume, and you've got daily activity targets grounded in market reality rather than wishful thinking.
A note on SOM: 10% of SAM is aggressive for a first-year target. Most early-stage teams land in the 2-5% range. Mature players in narrow segments can reach 10-30% over time, but plan conservatively and let results pull you upward.
When TAM Is the Wrong Metric
CXL frames it well: TAM is useful for sizing, not for targeting. A $10B market means nothing if you can't tell your reps which 500 accounts to call this quarter. ICP definition and account tiering matter infinitely more for daily execution than the total market number.
The "1% fallacy" is the classic example. Claiming "we just need 1% of a $50B market" is a credibility killer with investors and a planning disaster for sales. It sounds conservative but proves nothing - you haven't demonstrated you can acquire even a single customer in that market. If your sales plan starts with a top-line number and works backward, you're doing it wrong. Start with accounts, work forward.
Mistakes That Kill Sales Plans
Five anti-patterns we've seen repeatedly:
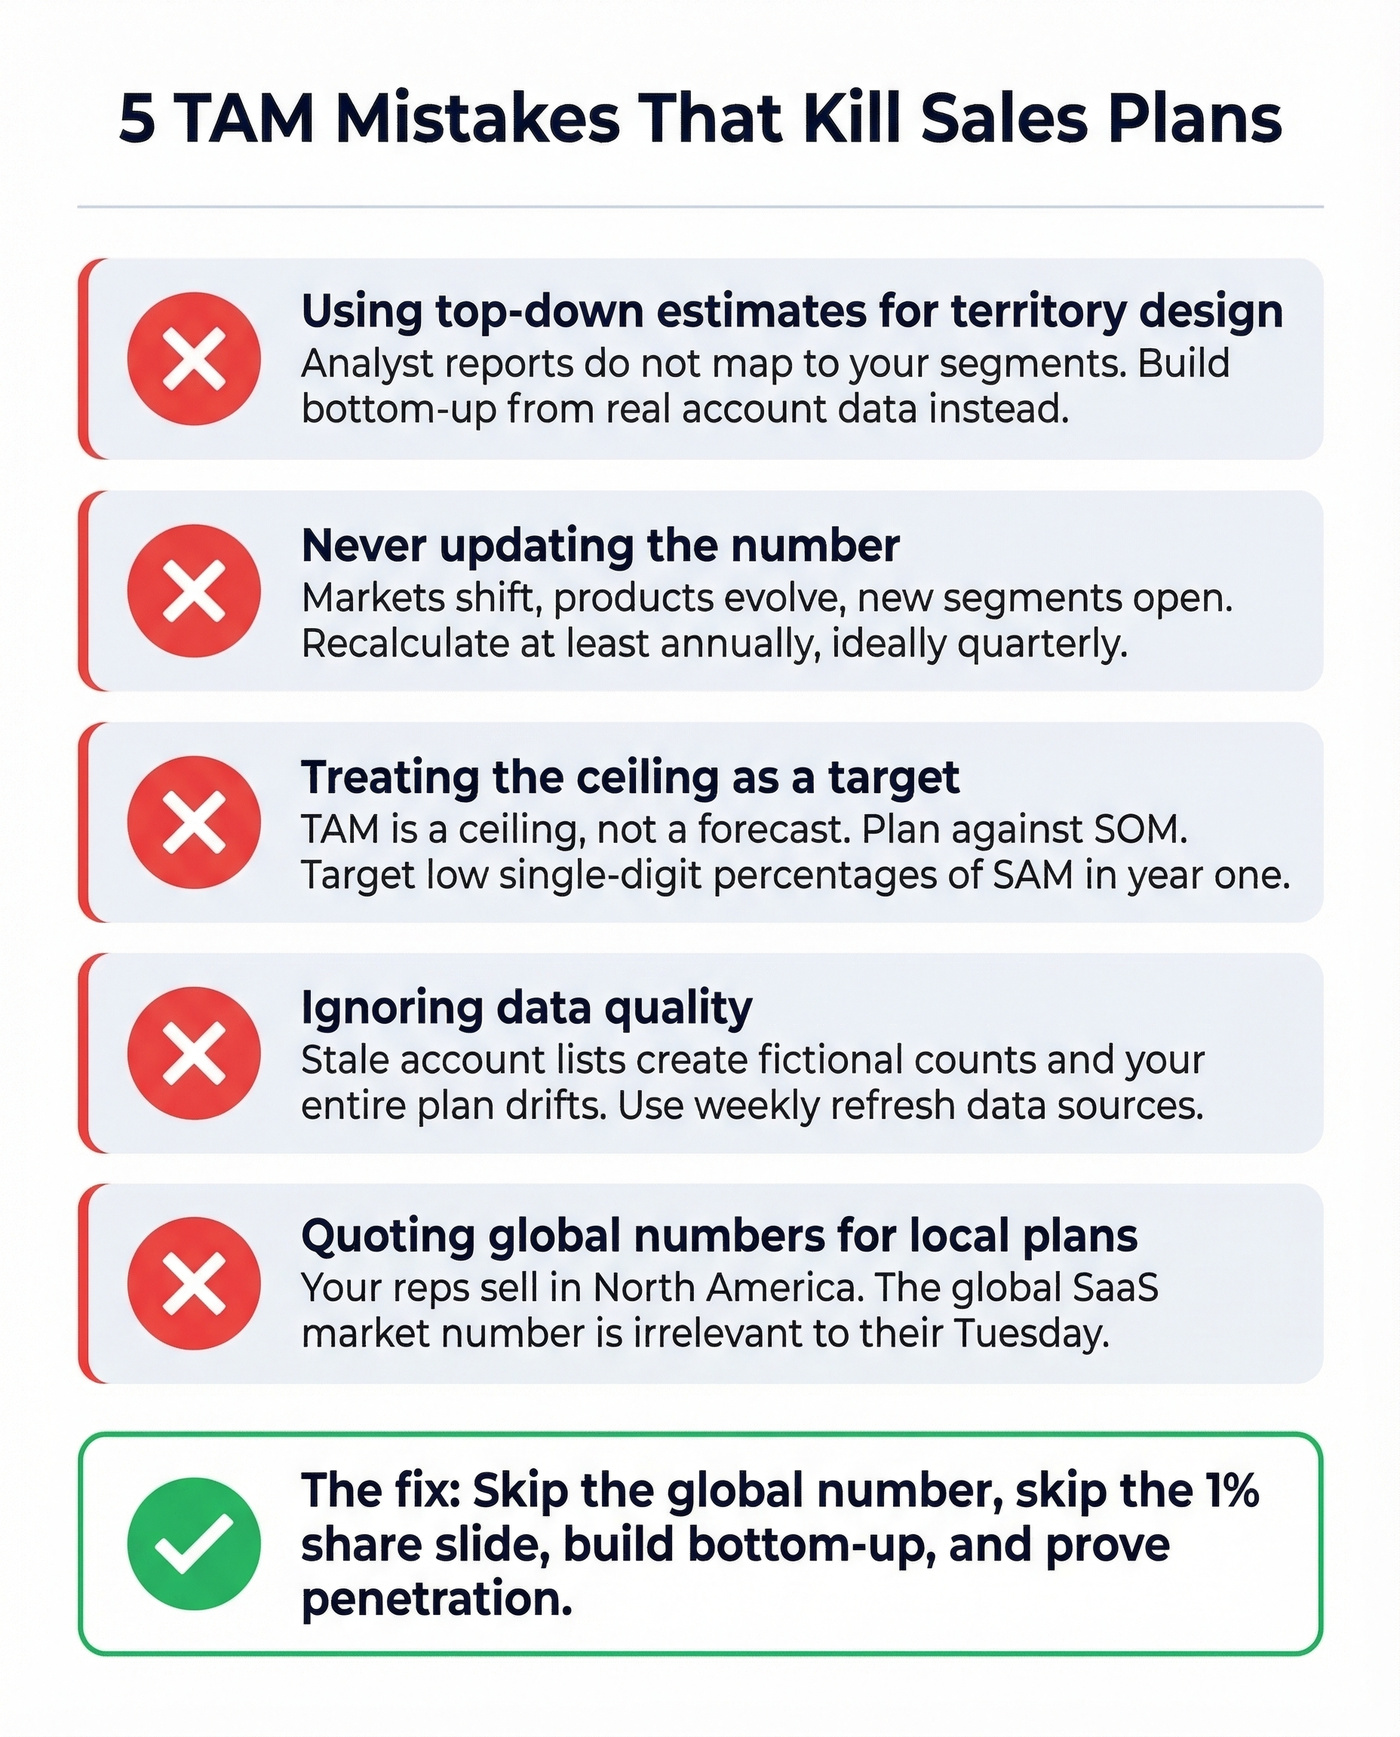
Using top-down estimates for territory design. Analyst reports don't map to your segments. Build bottom-up from CRM and prospecting data instead.
Never updating the number. Markets shift, your product evolves, new segments open. Reevaluate at least annually, if not quarterly.
Treating the ceiling as a target. TAM is a ceiling, not a forecast. Plan against SOM. Early-stage teams should target low-single-digit percentages of SAM in year one.
Ignoring data quality. Stale account lists create fictional account counts, and your entire plan drifts. Use data sources with weekly refresh cycles so your addressable market stays accurate.
Quoting global numbers to justify local plans. Your reps sell in North America. The global SaaS market is irrelevant to their Tuesday. Segment by the geographies and verticals you actually cover.
The consensus on r/startups echoes this: skip the global market number, skip the "1% share" slide, build bottom-up, and prove penetration.
FAQ
What's the difference between TAM and SAM?
TAM is total market revenue at 100% share - every possible buyer of your category. SAM narrows to the segment you can actually serve with your current product, pricing, and geography. Sales teams work with SAM daily; TAM sets the long-term ceiling for the board.
How often should you recalculate TAM?
Annually at minimum, timed to your planning cycle. Recalculate when you launch a new product, enter a new vertical, or see major market shifts. In our experience, teams that recalculate SAM quarterly consistently outperform those that treat it as a once-a-year exercise.
What tools help with bottom-up TAM calculations?
B2B data platforms like Prospeo, ZoomInfo, and Crunchbase help you identify and segment accounts by industry, company size, and geography. Government databases (Census Bureau, BLS) supplement with industry-level data. The key differentiator is data freshness - stale counts produce fictional market estimates, so look for platforms that refresh weekly rather than monthly.