Top-Down Forecasting: How to Do It Without Getting Burned
Your CFO just handed down a $50M revenue target for next year. It's a round number. It showed up in a board deck. And now your entire planning cycle revolves around making reality fit that number.
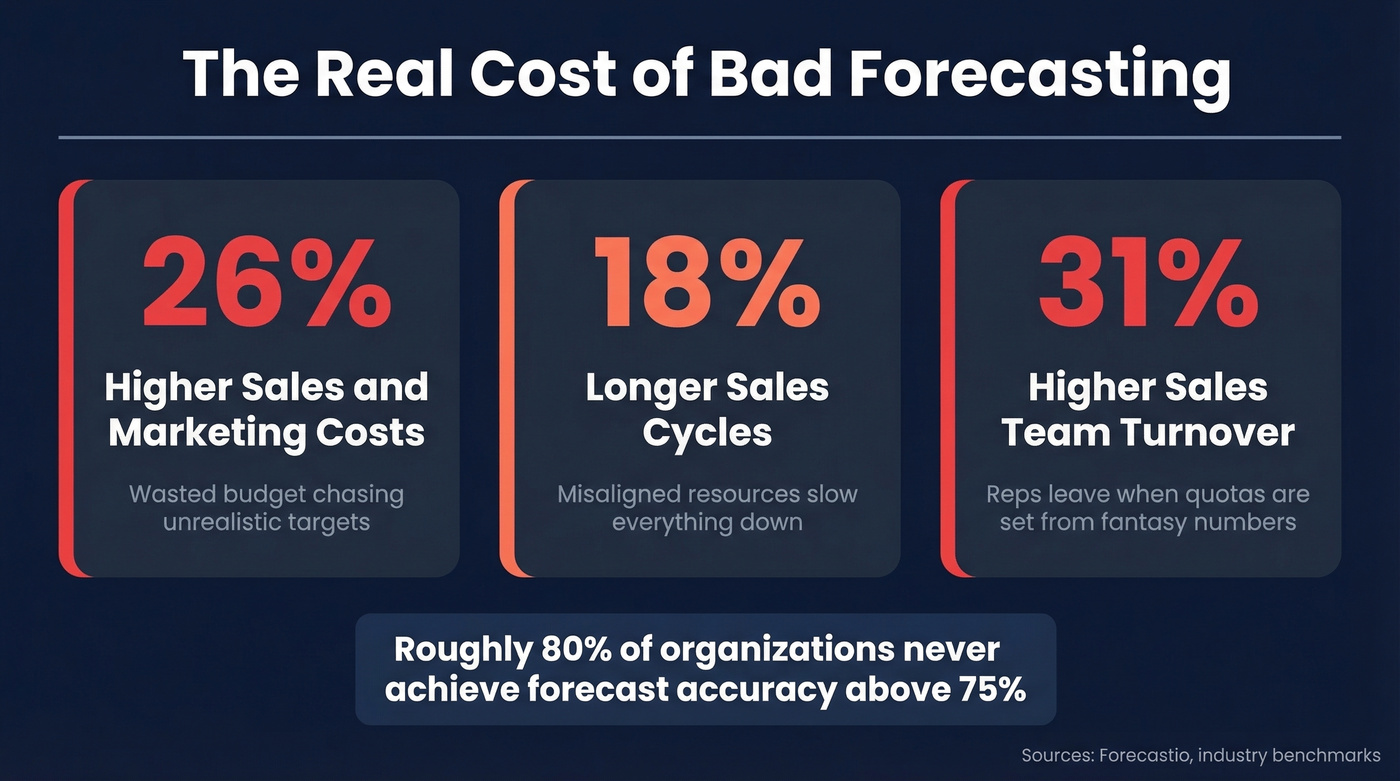
This is top down forecasting at its most common - and most dangerous. Roughly 80% of organizations don't achieve sales forecast accuracy above 75%, and a big reason is that the number came from a slide, not from the market.
What You Need (Quick Version)
Top down forecasting boils down to a simple equation: TAM x market share = revenue estimate. It's fast, strategic, and useful for setting direction. But it's a hypothesis, not a plan. Three things to remember:
- Run top-down and bottom-up forecasts independently, then reconcile them.
- If the two methods diverge by more than 15%, at least one set of assumptions is wrong.
- Your forecast is only as accurate as your pipeline data - garbage contacts in, garbage forecast out.
What Is Top Down Forecasting?
This approach - sometimes called macro-level or aggregate forecasting - starts with the broadest possible view of your market and narrows it down to a revenue number. The core formula:
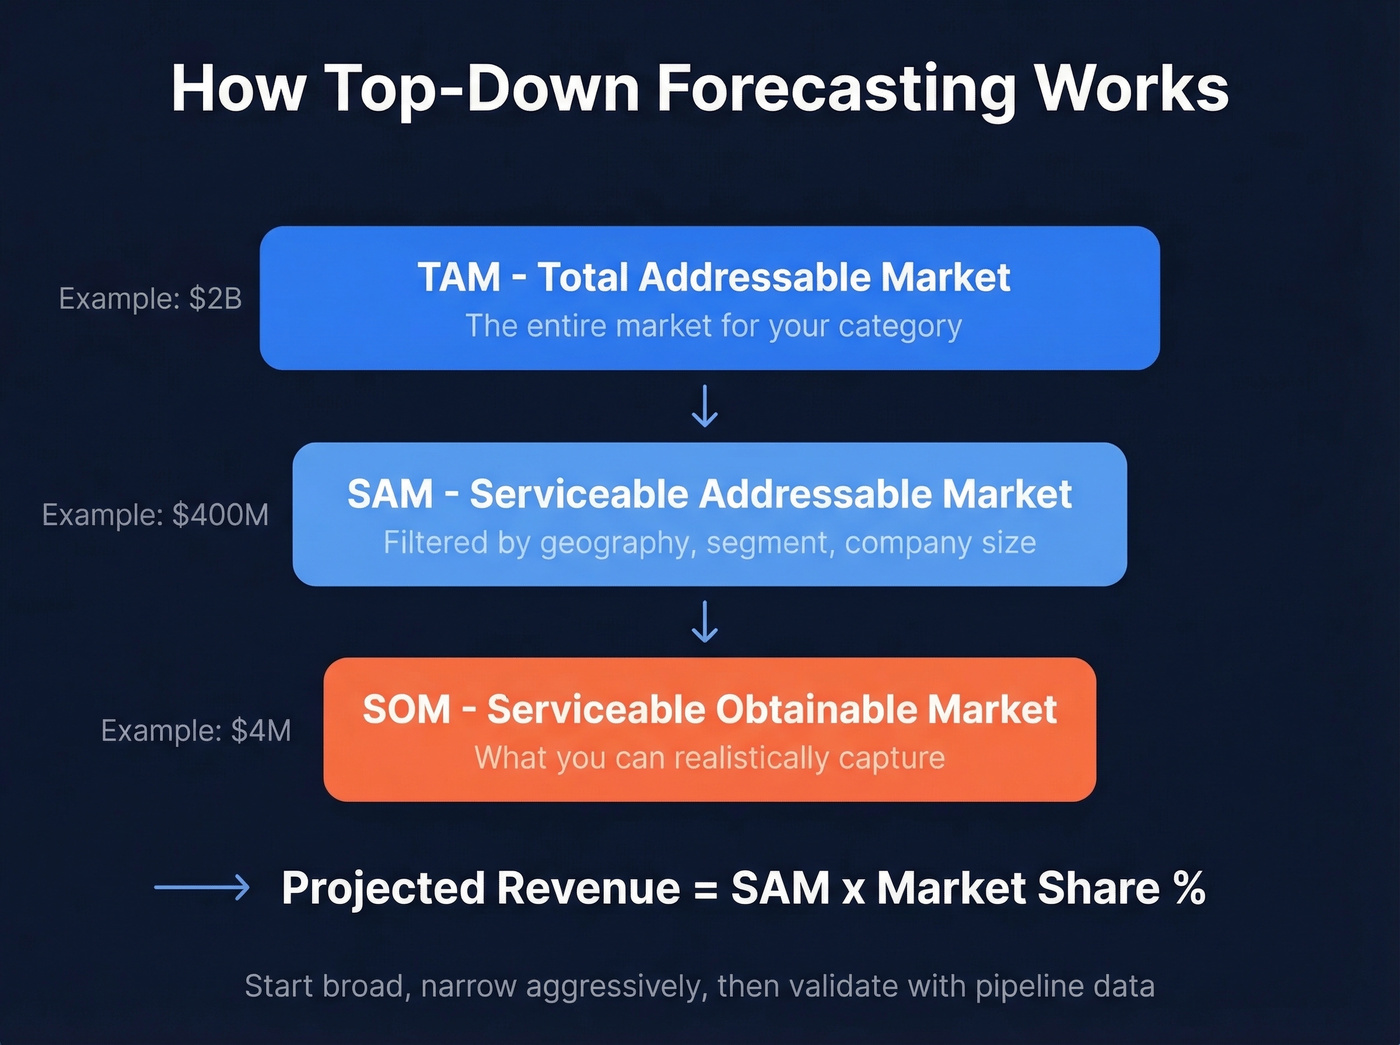
Revenue = TAM x Estimated Market Share
You begin with total addressable market data, apply filters for geography, segment, and product fit, then estimate the slice you can realistically capture. Some models start even higher, at GDP or total industry spending, and narrow from there, though TAM is the most common starting point for B2B companies. It's the opposite of bottom-up forecasting, which builds revenue projections from individual deals, conversion rates, and rep capacity.
The appeal is speed. You can produce a top-down sales forecast in an afternoon with a few industry reports and a spreadsheet. The risk is that speed comes at the cost of operational grounding - a number derived from market data and assumptions can look perfectly reasonable in a slide deck while being completely disconnected from what your sales team can actually close.
How It Works (Step by Step)
Step 1: Estimate Your TAM
Total addressable market is the revenue ceiling - the maximum possible if you captured every customer in your category. For most B2B companies, you're pulling this from industry research: eMarketer, Statista, Gartner, IBISWorld, or sector-specific analysts. Government data from the Census Bureau or BLS works for some verticals.
The key is picking the right granularity. "The global SaaS market" is a TAM, but it's useless if you sell HR compliance software to mid-market companies in North America. Start broad, but know you're about to cut aggressively.
Step 2: Define Your SAM
Your serviceable addressable market is TAM minus everything you can't or won't serve. Filter by geography, company size, vertical, and product capability. If you only sell in North America to companies with 200-2,000 employees in tech and financial services, say so and cut everything else.
This is where most top-down forecasts go wrong. Teams leave SAM too wide because narrowing it makes the revenue projection less impressive. Resist that temptation. A realistic SAM is the difference between a forecast and a fantasy.
Step 3: Calculate SOM and Project Revenue
Serviceable obtainable market is the portion of SAM you can realistically win given your current go-to-market motion, competitive position, brand awareness, and sales capacity. For established companies, SOM is typically 2-5% of SAM. For startups, it's often under 1%.
Here's a nuance the textbooks skip: don't apply a single market share number across your entire SAM. Sophisticated models break SAM into segments - by product line, customer tier, or vertical - and assign different share assumptions to each. Your share in enterprise financial services will look nothing like your share in mid-market tech. Blending them into one number hides more than it reveals.
Multiply SAM by your estimated market share to get projected revenue. Then validate: if your top-down and bottom-up estimates align within 15%, your assumptions are solid. If they don't, something needs re-examination - usually the market share assumption or the SAM definition.
Worked Example: B2B SaaS Revenue Forecast
Let's make this concrete. Imagine you're a B2B SaaS company selling sales engagement software in North America.
Your TAM - the total North American sales engagement software market - is $2 billion, sourced from an industry analyst report. You only sell to mid-market companies with 200-2,000 employees in tech and financial services, which cuts your SAM to roughly $400 million. Now the question: what share can you realistically capture?
| Scenario | TAM | SAM | Market Share | Projected Revenue |
|---|---|---|---|---|
| Downside | $2B | $400M | 0.5% | $2M |
| Base | $2B | $400M | 1.0% | $4M |
| Upside | $2B | $400M | 1.5% | $6M |
The spread between downside and upside is $4M - a 3x difference driven entirely by a one-percentage-point swing in market share. That's the fragility of a top-down sales forecast in a single table.
A more rigorous version would vary SAM by segment and apply different share assumptions to each. You capture 1.5% in mid-market tech but only 0.3% in financial services where incumbents dominate. The aggregate number changes meaningfully. Either way, these are hypotheses. They need bottom-up validation from pipeline data, conversion rates, and rep capacity before anyone should build a hiring plan around them.
A top-down forecast without reliable pipeline data is just a guess. Prospeo gives you 300M+ verified profiles with 98% email accuracy and 30+ filters - by segment, company size, and vertical - so your bottom-up validation actually holds up against the macro number.
Stop reconciling forecasts against garbage pipeline data.
Top-Down vs. Bottom-Up vs. Hybrid
| Method | Speed | Near-Term Accuracy | Data Needed | Best For |
|---|---|---|---|---|
| Top-Down | Fast | Low | Market reports | Strategic planning, new markets |
| Bottom-Up | Slow | High | Pipeline + CRM | Quarterly targets, hiring plans |
| Hybrid | Medium | Highest | Both | Revenue planning (the right default) |
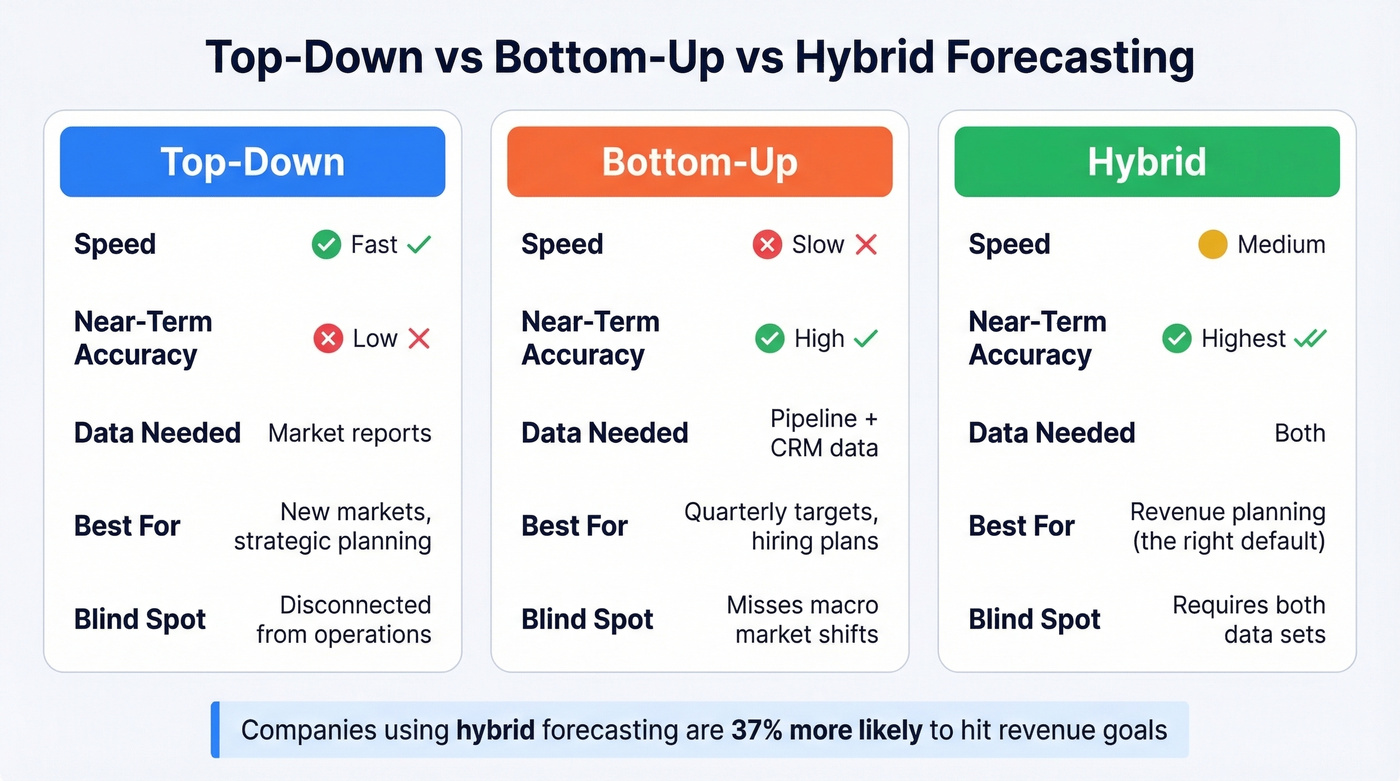
Bottom-up wins on near-term accuracy because it's built from actual pipeline data. The macro approach wins on speed and strategic framing. But the real answer is hybrid - and it isn't close. Companies using a hybrid forecasting model are 37% more likely to consistently hit revenue goals than those relying on a single method.
The key limitation of starting from TAM is its disconnect from operations. Bottom-up's blind spot is macro shifts - it can't see a market contraction coming because it's staring at the pipeline. Hybrid catches both.
There's also a "middle-out" approach, forecasting at the segment or product-line level and rolling up, that splits the difference. For most teams, though, running both methods independently and then reconciling the gap is the most practical path.
When to Use Top-Down Sales Planning
Not every situation calls for the same method. A quick decision framework:
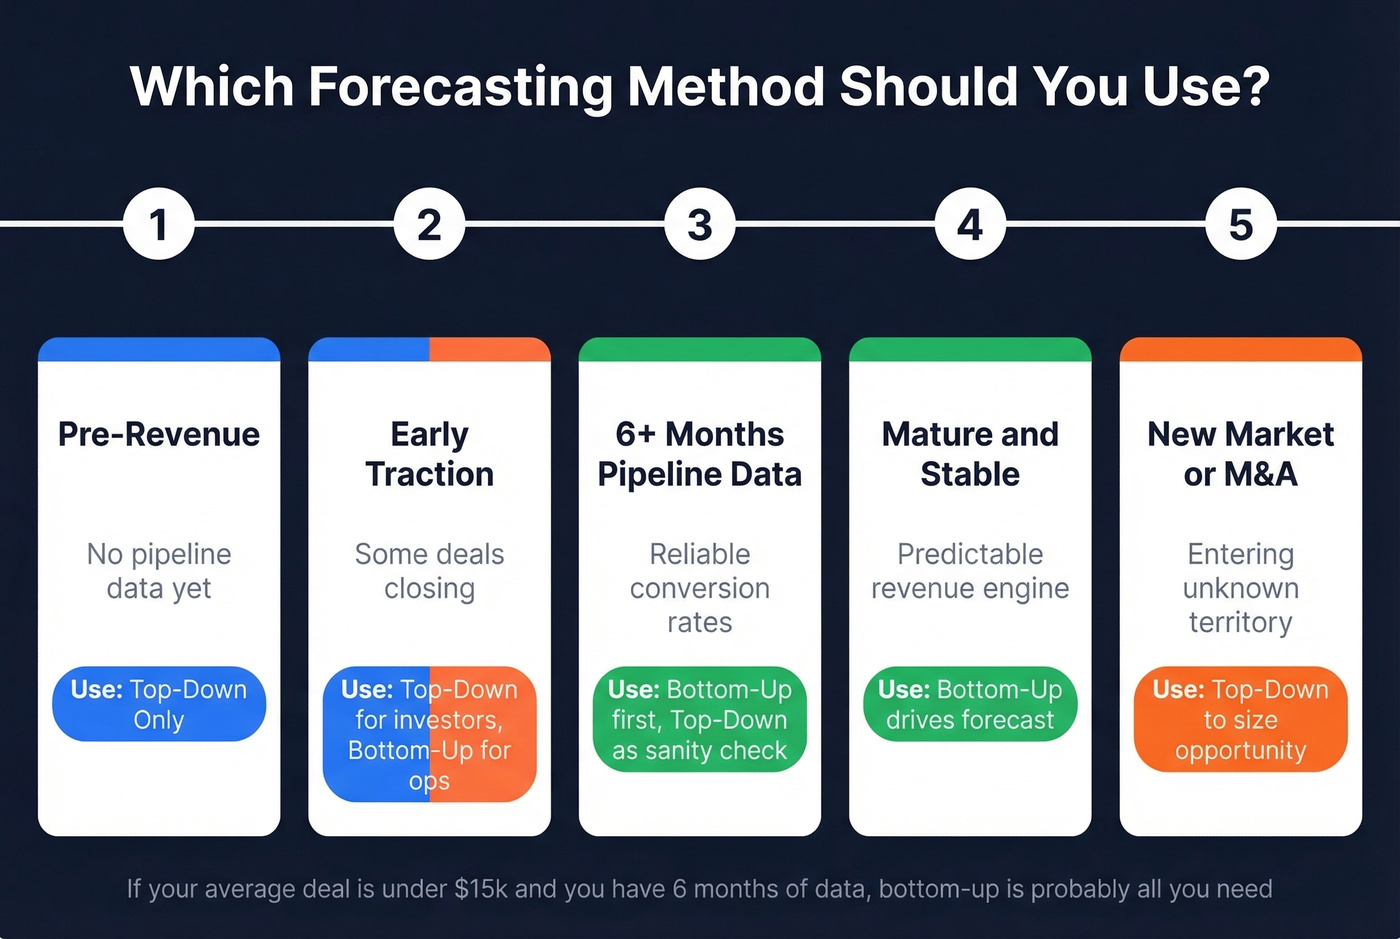
- Pre-revenue or pre-product-market fit: Top-down is your only option. You don't have pipeline data yet.
- Early-stage with some traction: Top-down for investor context, bottom-up for operational planning.
- 6+ months of pipeline data: Start bottom-up and use top-down as a sanity check. This is the right default for most B2B companies.
- Mature company, stable market: Bottom-up drives the forecast. Top-down validates against market trends.
- New market entry or M&A planning: Top-down for sizing the opportunity. Bottom-up once you have local pipeline data.
- Long planning horizons (3-5 years): Top-down carries more weight because pipeline data doesn't extend that far.
- Fundraising or cash flow planning: Top-down frames the opportunity for investors and lenders. Just don't mistake the frame for the plan.
Here's the thing: if your average deal size is under $15k and you have six months of closed-won data, you probably don't need macro-level forecasting at all. Your conversion math will be more accurate than any TAM-slicing exercise. It becomes useful again when you're entering new segments or pitching investors - not for running the quarter.
Why Top-Down Forecasting Fails
Board Targets Without Pipeline Reality
The most common failure mode isn't methodological - it's political. A board sets a growth target based on investor expectations, and the entire organization reverse-engineers a plan to justify it. Teams scramble to make the numbers work. Morale drops. Accuracy suffers.
We've seen this pattern repeatedly. Targets cascade down without any connection to capacity, market conditions, or realistic close rates. The models rarely account for buying behavior fluctuations or market shifts. When the quarter ends 20% short, leadership blames execution. The real problem was the forecast itself.
The Sandbagging Problem
Anyone in FP&A knows this frustration. When departments realize their budgets are based on their forecasts, the incentives get perverse. The consensus on r/FPandA is clear: teams sandbag their numbers, then spend savings later to avoid losing budget next year. Discretionary expenses like travel and events are the worst offenders - they were down for years, now they're rising, and simple inflation-based uplift assumptions miss the reality entirely.
"Spreadsheet Magic" That Investors See Through
Startups are especially guilty of this. Pick a big TAM number, assume you'll capture 1-3%, and present a hockey-stick revenue chart. Investors have a name for it: spreadsheet magic. There's no connection to customer acquisition costs, conversion rates, pricing, retention, or sales capacity. Experienced investors reject these projections immediately and ask for driver-based bottom-up models instead.
Stale Data, Broken Forecasts
This is the failure mode nobody talks about. Your bottom-up validation layer - the pipeline data that's supposed to ground your top-down assumptions - is only useful if it's accurate. If a meaningful share of your prospect records are invalid, your pipeline coverage ratios and conversion assumptions are wrong before you start. Keeping contact data verified and refreshed weekly, rather than relying on records that are months old, is the single highest-leverage thing you can do for bottom-up forecast reliability.
Poor forecast accuracy leads to 26% higher sales and marketing costs, 18% longer sales cycles, and 31% higher sales team turnover. Those aren't rounding errors. They're existential for growth-stage companies.
How to Reconcile Both Methods
The goal isn't to pick one method. It's to measure and explain the gap between them, then use that gap to improve your planning.
Start with the math:
- Variance $ = Top-Down Forecast - Bottom-Up Forecast
- Variance % = (Top-Down - Bottom-Up) / Top-Down
Track convergence at regular intervals. In our experience, the gap between the two approaches is most revealing at T-60 - that's when you still have time to adjust. A practical cadence: T-90, T-60, T-30, and T-10 days before period close. Early in the quarter, you expect divergence. As pipeline matures and deals progress, the two numbers should converge.
Set acceptable variance bands by horizon:
- Current quarter (Q0): 2-3% variance or less
- Next quarter (Q+1): 5% variance or less
- Two quarters out (Q+2): wider bands are expected
If the gap exceeds 5% at T-45, that's a governance trigger - time for a cross-functional review to diagnose whether the macro assumptions or the pipeline is off.
The weighting between methods should shift by time horizon:
| Horizon | Bottom-Up Weight | Top-Down Weight |
|---|---|---|
| Q0 (current) | 70% | 30% |
| Q+1 (next) | 60% | 40% |
| Q+2 (two out) | 50% | 50% |
Near-term, bottom-up dominates because you have real pipeline data. Further out, the macro model carries more weight because pipeline coverage is thin. Back-test these weights against your actuals to find the optimal blend for your business.
Tools and Templates
You don't need enterprise software to run a solid forecast. Here's what's available across the spectrum:
| Tool | Type | Price |
|---|---|---|
| Excel / Google Sheets | Spreadsheet | Free |
| HubSpot CRM | CRM + forecast | Free (2 users), $15/user |
| Pipedrive | CRM + forecast | $14/user/mo |
| Zoho CRM | CRM + forecast | $14/user/mo |
| Anaplan | Enterprise planning | ~$30K-100K+/yr |
| Adaptive Planning | Enterprise planning | ~$25K-75K+/yr |
| Pigment | Planning platform | ~$1K-5K/mo |
For templates, Smartsheet's financial projection templates and FitSmallBusiness's sales forecast templates both offer free downloads with example data. They're general-purpose rather than TAM/SAM/SOM-specific, but they'll get you started.
Let's be honest: Excel is fine until your planning complexity genuinely demands more. What you do need, regardless of tool, is clean pipeline data feeding your bottom-up layer. Our team has found that stale CRM records are the silent killer of forecast accuracy - if your contacts haven't been verified in months, your pipeline coverage ratios are fiction. Tools like Prospeo, which refreshes B2B contact data every 7 days at 98% email accuracy, exist specifically to solve this problem. It integrates natively with HubSpot and Salesforce, and there's a free tier to test it.
Hybrid forecasting only works when your bottom-up data is clean. Teams using Prospeo see bounce rates drop below 4% and pipeline increase up to 180% - because every contact is verified on a 7-day refresh cycle, not stale data from six weeks ago.
Your forecast deserves pipeline data that's less than a week old.
FAQ
What is the top down forecasting formula?
Revenue = TAM x estimated market share. For more realistic projections, narrow TAM to SAM (serviceable addressable market filtered by geography, segment, and product fit) and then to SOM (serviceable obtainable market based on competitive position and GTM capacity). The Wall Street Prep calculator walks through the full formula.
Is top-down or bottom-up more accurate?
Bottom-up is more accurate for near-term revenue when you have solid pipeline data and conversion history. Top-down is better for long-range directional planning where pipeline data doesn't exist yet. Hybrid approaches that weight both methods by time horizon outperform either alone - companies using hybrid models are 37% more likely to hit revenue goals.
When should a startup use top down forecasting?
Only for initial market sizing and investor context. Investors reject top-down-only revenue projections as "spreadsheet magic." As soon as you have conversion data - even a few months of it - pair it with driver-based bottom-up modeling built from leads, conversion rates, pricing, and sales capacity.
How does data quality affect forecast accuracy?
Directly and significantly. If a meaningful share of your CRM contacts are invalid, your pipeline coverage ratios and conversion assumptions are built on a broken foundation. Keeping contact data verified and refreshed weekly is the single highest-leverage thing you can do for bottom-up forecast reliability.