How to Build Accurate Sales Forecasts: Benchmarks, Formulas, and a 90-Day Plan
It's the last week of the quarter. Your VP of Sales is staring at a pipeline that says $4.2M, the board deck says $3.8M, and the CFO's model says $3.1M. Somebody's wrong - probably everyone.
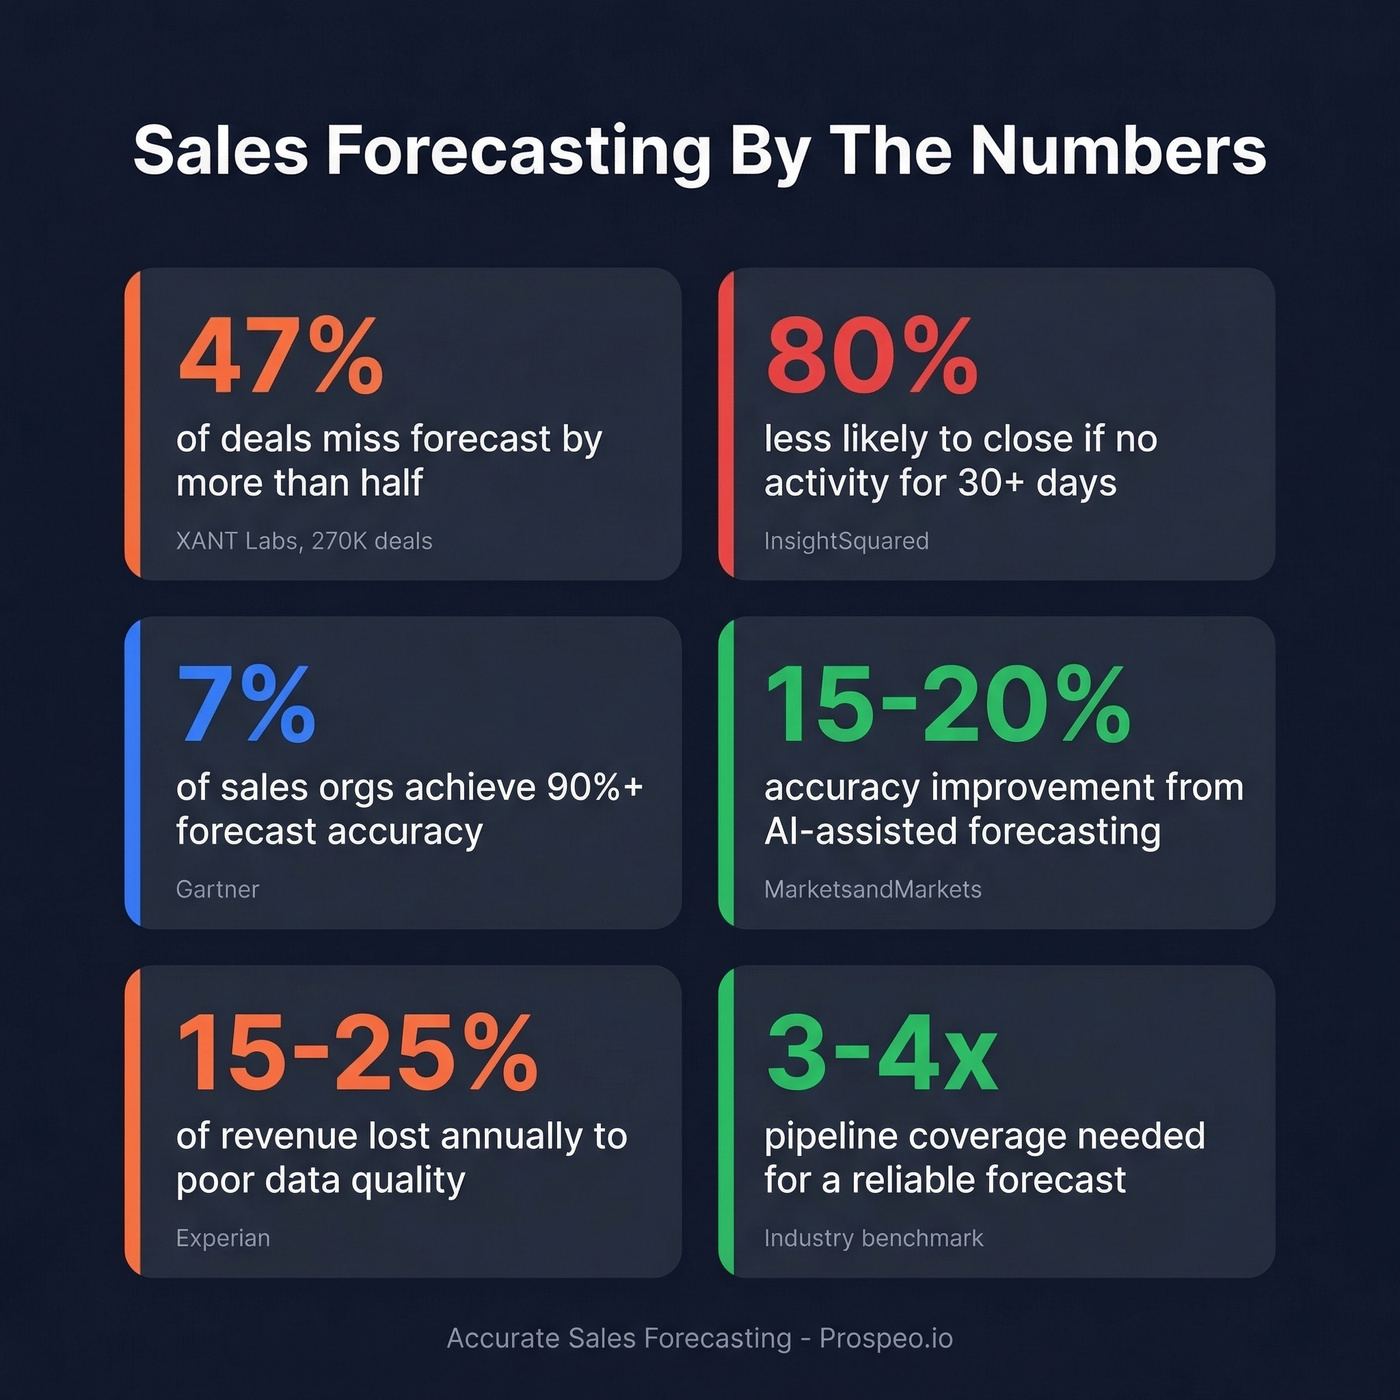
Accurate sales forecasting shouldn't be this hard, but for most teams, it is. XANT Labs analyzed 270,912 closed-won opportunities totaling $18.1B and found that 47% of deals missed their forecast by more than half. The average 90-day prediction was off by 31%+. Fewer than half of sales leaders are even confident in their own forecasts, per Gartner. A lot of teams don't even measure how wrong they are.
The Short Version
Measure with WMAPE + Bias%, not MAPE - and lock down your forecast snapshot before the period starts. MAPE distorts when deal sizes vary. WMAPE weights by revenue, which is what your board actually cares about.
Stop trusting rep roll-ups. They carry ±25-35% variance. Layer in weighted pipeline or AI/ML methods to get that down to ±8-15%.
Fix your CRM data first. Stale contacts poison every model. If your reps are "working" deals with people who've changed roles, no algorithm can save you.
What Forecast Accuracy Looks Like in 2026
The median B2B forecast accuracy sits at 70-79%. Only 7% of sales organizations achieve 90%+ consistently. The vast majority of teams miss their number by 20-30% every quarter and treat it as normal.
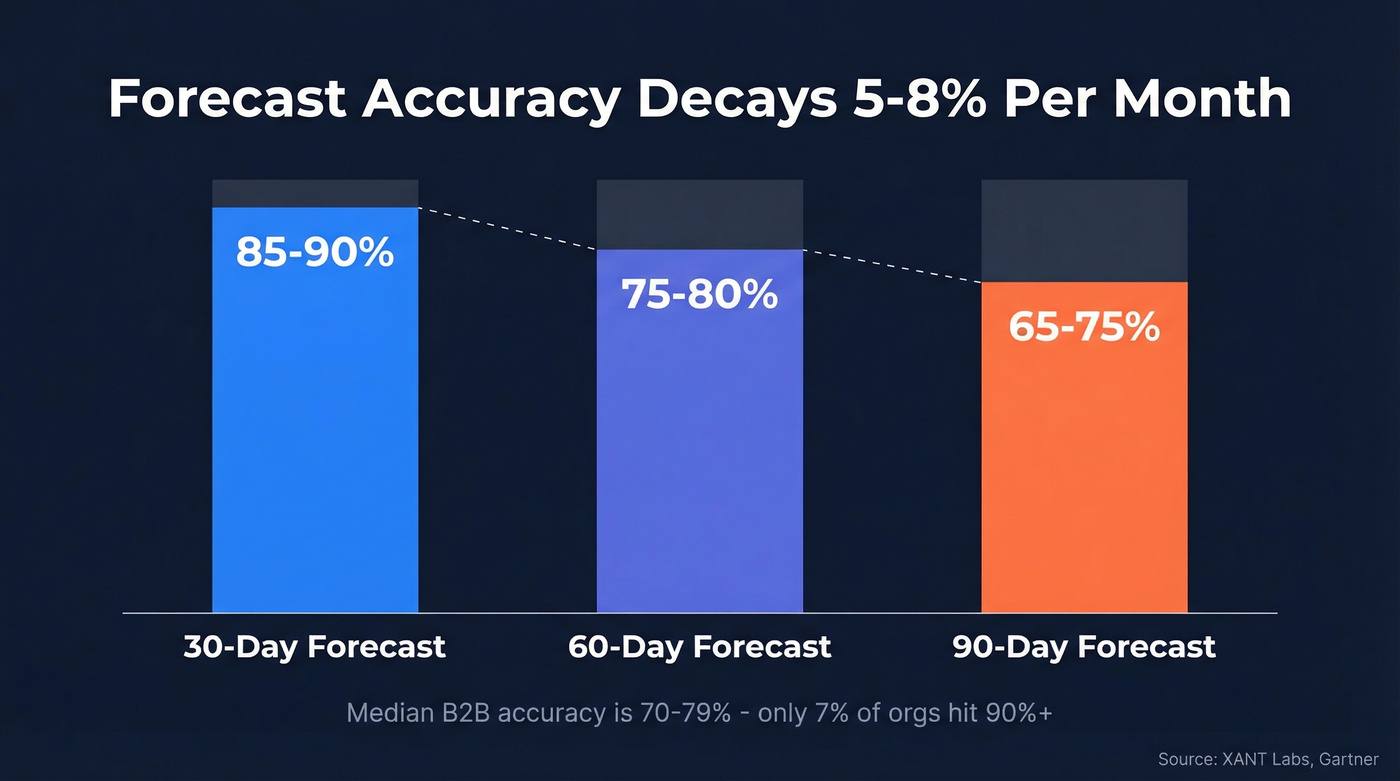
Accuracy degrades the further out you look. A 30-day forecast typically hits 85-90%. At 60 days, you're down to 75-80%. By 90 days, you're at 65-75% - a decay rate of roughly 5-8% per month.
Stop treating 90-day forecasts as commitments. The data says they're structurally 65-75% accurate at best. Make your 30-day forecast excellent and treat the quarter as directional. This isn't defeatism - it's math. Teams that obsess over 30-day precision and use 90-day numbers as guardrails consistently outperform teams that pretend quarterly forecasts are reliable.
Forecasting Methods Ranked by Accuracy
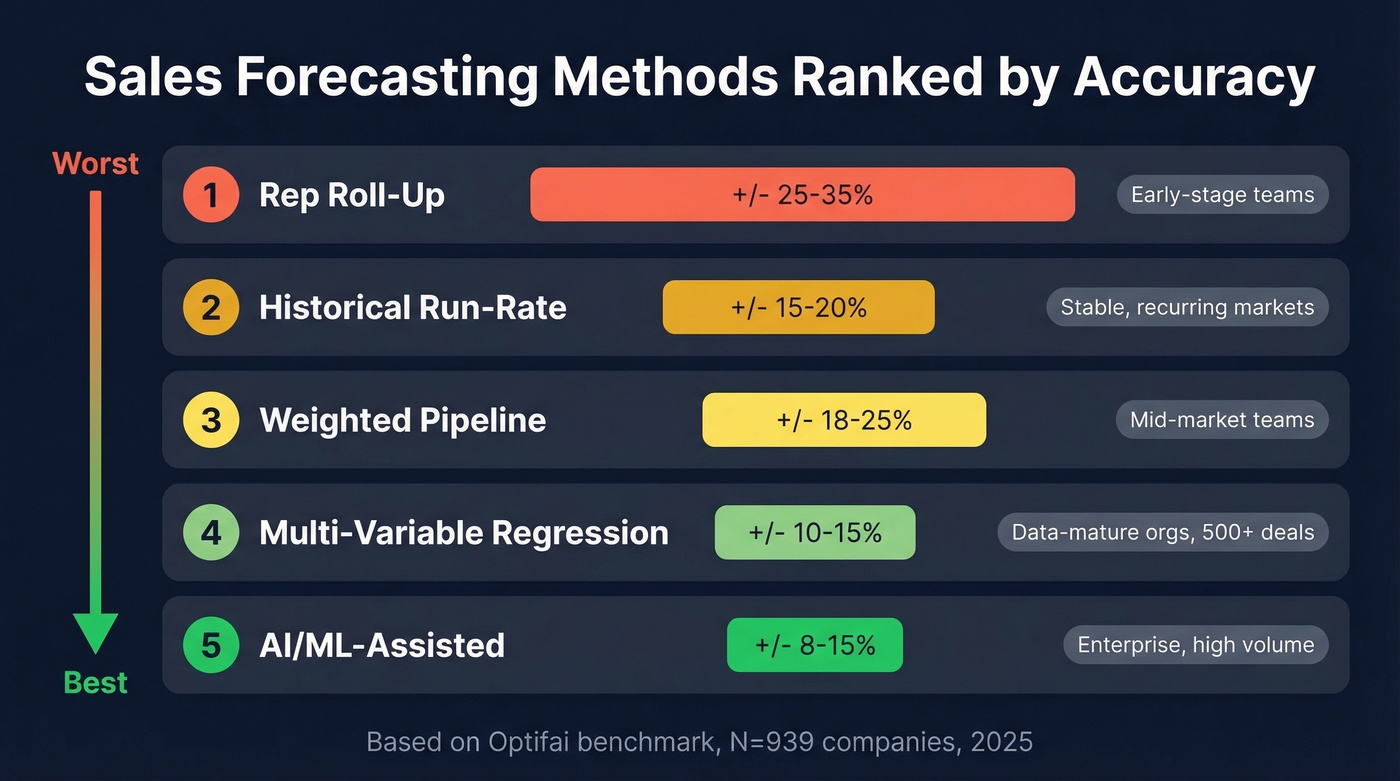
Not all methods are created equal. Here's how they stack up, ranked from worst to best by variance, based on the Optifai benchmark (N=939 companies, Q1-Q3 2025) and SalesMotion's method analysis:
| Method | Variance | Data Needed | Best For | Watch Out For |
|---|---|---|---|---|
| Rep roll-up | ±25-35% | CRM + rep input | Early-stage teams | Optimism bias, sandbagging |
| Historical run-rate | ±15-20% | 12+ months of data | Stable, recurring markets | Breaks in volatile markets |
| Weighted pipeline | ±18-25% | Calibrated stage probs | Mid-market teams | Uncalibrated probabilities |
| Multi-variable regression | ±10-15% | 500+ closed deals | Data-mature orgs | Needs consistent CRM fields |
| AI/ML-assisted | ±8-15% | All of the above + signals | Enterprise, high volume | Model drift, adoption risk |
Rep roll-up is the worst method, and most teams still use it. It's essentially asking reps to predict the future, then rolling those predictions up into a number the board sees. The variance is brutal because it compounds optimism bias at every level - the rep is optimistic, the manager rounds up, and the VP adds a buffer that goes the wrong direction.
Weighted pipeline is where most teams should start. It replaces gut feel with historical conversion rates by stage. The catch: you need calibrated probabilities, not the default 10/25/50/75/90 that Salesforce ships with. We've seen teams cut forecast error by 15+ points just by rebuilding stage probabilities from their own closed-won data.
One distinction most teams miss: forecasting whether a deal will close is different from forecasting when it will close. Timing prediction is a separate accuracy dimension, and AI models handle it better than stage-based methods. New businesses without 12+ months of data should start with comparable-company benchmarks and range-of-outcomes models before graduating to weighted pipeline.
AI/ML methods deliver real improvement - MarketsandMarkets reports 15-20% higher accuracy, 25% shorter sales cycles, and up to 30% improvement in quota attainment for AI users. But ±8-15% variance isn't magic. You still need clean data, consistent CRM hygiene, and reps who actually update their deals.
If you're evaluating platforms, start with a shortlist of sales forecasting tools and compare pricing and fit.
Stale CRM data is the silent killer of forecast accuracy. When reps chase contacts who changed jobs months ago, every model breaks. Prospeo refreshes 300M+ profiles every 7 days - not every 6 weeks - so your pipeline reflects reality, not ghosts.
Clean data in, accurate forecasts out. It starts at $0.01 per email.
How to Measure Forecast Accuracy
WMAPE - The Metric That Matters
WMAPE = Sigma|Actual - Forecast| / SigmaActual
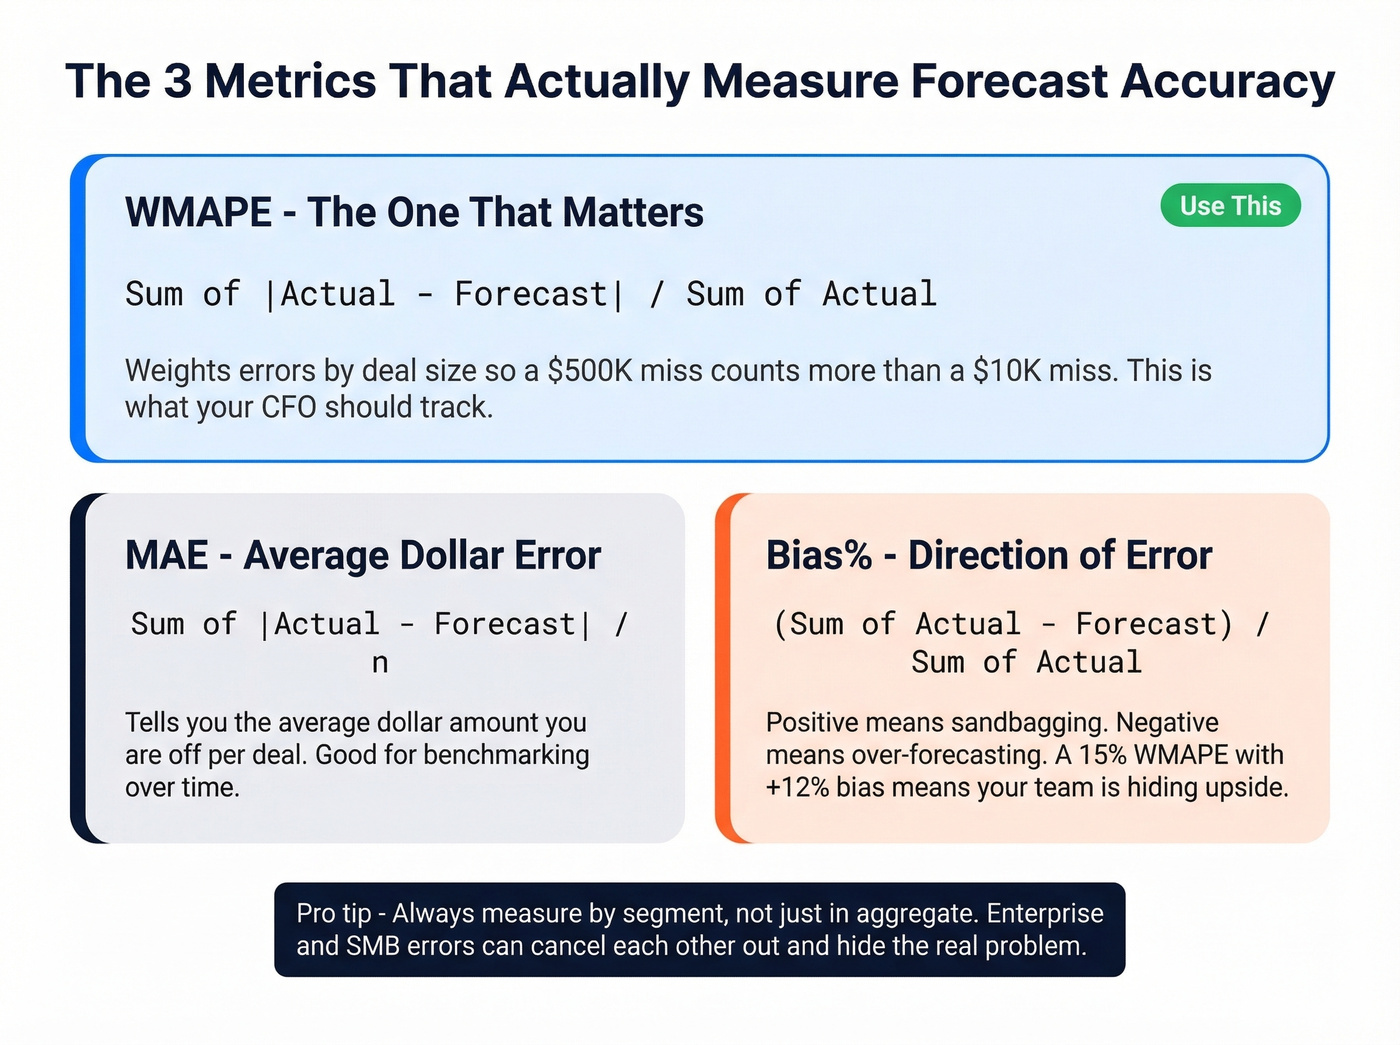
WMAPE (Weighted Mean Absolute Percentage Error) is the metric your CFO should be looking at. It weights errors by revenue, so a $500K deal that's off by 20% matters more than a $10K deal that's off by 80%. MAPE treats them equally, which distorts everything when you've got a mix of deal sizes.
If you want to align forecasting with the rest of your revenue system, track it alongside pipeline health metrics.
MAE and Bias%
MAE = (1/n) Sigma|Actual - Forecast| gives you the average dollar error across all deals.
Bias% = Sigma(Actual - Forecast) / SigmaActual reveals whether you're systematically over- or under-forecasting. A WMAPE of 15% with a Bias% of +12% tells you a very different story than a WMAPE of 15% with a Bias% of -2%. The first team is sandbagging. The second is genuinely uncertain. Terret.ai's measurement framework lays out all three formulas with worked examples.
The Lockdown Snapshot
Without freezing the forecast at the start of the period, accuracy measurement is meaningless. You're comparing a moving target to actuals. Every Monday morning "update" that adjusts the number closer to reality makes your forecast look better on paper while teaching you nothing about predictive capability.
The aggregation fallacy is equally dangerous. Your top-line forecast can show 100% accuracy while Enterprise over-forecasts by $2M and SMB under-forecasts by $2M - they cancel out. Always measure accuracy by segment, not just in aggregate.
This is also where teams confuse a sales forecast vs sales goal and end up measuring the wrong thing.
Eight Ways to Improve Forecast Precision
1. Calibrate Stage Probabilities
Use closed-won conversion rates by stage, not gut estimates. Neil Ryland at Huddle found deal estimates were off by 40% until he built stage probabilities from historical data - 10% at lead stage, ramping to 90% at procurement. Rebuilding stage probabilities from your own data is often the single biggest accuracy lever a team can pull.
If your stages are activity-based, borrow structure from proven sales process optimization frameworks.
2. Track Buyer Actions, Not Seller Actions
A "demo completed" milestone means nothing if the buyer didn't bring a second stakeholder. Define stages by what the buyer did - signed an NDA, introduced procurement, scheduled a technical review. Seller-defined stages measure activity. Buyer-defined stages measure progress. That's a critical difference.
If you need a tighter way to qualify buyer progress, consider adding MEDDIC sales qualification to your stage definitions.
3. Kill Stale Deals Ruthlessly
Deals with no activity for 30+ days are 80% less likely to close. If it's in your forecast and nobody's touched it in a month, remove it. Set an automated alert. No exceptions.
4. Use Pipeline Coverage Ratios
3x coverage for enterprise, 4x for mid-market. If you need $1M and your pipeline is $1.2M, your forecast is a prayer, not a prediction.
To sanity-check your targets, compare against current sales pipeline benchmarks.
5. Blend Rep Sentiment with Data
Add a forecast category field - Commitment, Upside, or Pipeline - alongside weighted probabilities. Reps know things the data doesn't capture. The trick is structuring that knowledge so it's additive, not overriding.
6. Shorten Your Forecast Horizon
Focus energy on 30-day accuracy (85-90% achievable) rather than pretending 90-day forecasts are reliable. Report the quarter to the board, but manage the business in 30-day windows.
7. Adopt AI/ML with Realistic Expectations
AI reduces variance from ±25-35% to ±8-15%. That's a real improvement, not a miracle. Watch for model drift - the patterns that predicted outcomes six months ago don't always hold today. And if reps don't trust the model's output, they'll ignore it and you're back to rep roll-up with extra steps. Teams that want to predict revenue reliably need models trained on their own deal history, not generic benchmarks.
If you're building internal models, it helps to ground the work in practical data science in sales patterns.
8. Fix Your CRM Data First
Here's the thing: this is the one everyone skips, and it's the one that matters most. Experian estimates poor data quality costs 15-25% of revenue annually. Your forecast model is only as accurate as the data feeding it.
If your CRM contacts haven't been verified in weeks, every probability you assign is built on assumptions about people who've changed roles or left the company entirely. Prospeo's 7-day data refresh cycle and 83% enrichment match rate mean your pipeline reflects reality, not last quarter's org chart. When a champion leaves and you don't know for 60 days, that's not a forecasting problem. It's a data problem masquerading as one.
Let's be honest: most teams spend months evaluating AI forecasting tools when the real problem is that 30% of their pipeline contacts have changed jobs since the deal was created. Fix the data layer first. You'll get more accuracy improvement from a weekly enrichment cycle than from any machine learning model running on stale records.
If you’re comparing vendors, start with a quick scan of data enrichment services and what “fresh” actually means.
You just read that deals with no real buyer activity are 80% less likely to close. But how do you know if your contact even works there anymore? Prospeo tracks job changes and verifies emails at 98% accuracy, so your forecast only counts deals with reachable buyers.
Stop forecasting against dead contacts. Verify your pipeline now.
90-Day Implementation Roadmap
Days 1-30: Baseline
Pull last three months of forecast vs. actual results and calculate WMAPE and Bias% by segment. This is your starting line. Run a CRM enrichment pass to identify stale records and backfill verified emails and direct dials across your open pipeline. Define your lockdown snapshot process: pick a date, freeze the number, and don't touch it until the period closes.
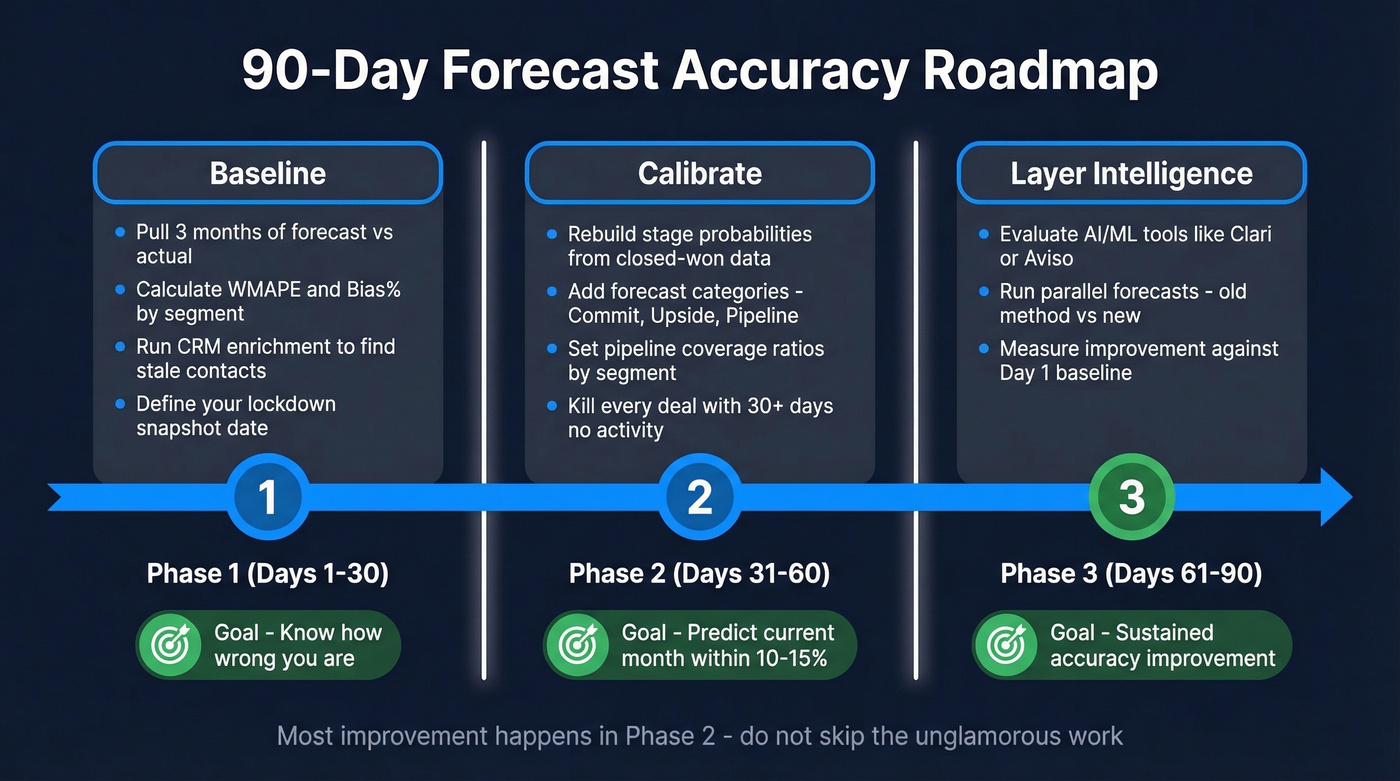
Days 31-60: Calibrate
Rebuild stage probabilities using historical closed-won data from the last 12 months. Implement forecast categories - Commitment, Upside, Pipeline - as a required field. Set pipeline coverage ratio thresholds by segment. Kill every deal with 30+ days of inactivity.
In our experience, this phase is unglamorous and it's where most of the improvement happens. By the end of Day 60, you should be able to predict the current month's revenue within a 10-15% margin.
Days 61-90: Layer Intelligence
Evaluate AI/ML forecasting tools like Clari, Aviso, or Salesforce Einstein for your data maturity level. Enterprise forecasting platforms like Clari and Aviso typically run $20K-$200K+/year depending on team size; Salesforce Einstein is bundled into higher Salesforce tiers. Skip this step if you don't have 500+ closed deals with consistent fields - go back to weighted pipeline and keep building your dataset.
Establish a weekly forecast review cadence. Day 90 checkpoint: compare your current WMAPE to the baseline you set on Day 1. A 5-10 point improvement confirms the process is working. If you're not seeing it, the problem is almost always data quality or stage definition, not methodology.
If you need a broader vendor list before you shortlist, use this roundup of sales forecasting solutions.
Real-World Examples
Siemens rolled out a forecasting transformation across 4,000+ sellers in 190 countries. The key metric wasn't accuracy - it was adoption. They pushed forecast submission rates above 70%, which sounds modest until you realize that getting thousands of reps across dozens of markets to consistently submit forecasts is a prerequisite for everything else.
Omniplex Learning took a different approach. Their CRO credits Outreach's real-time pipeline visibility with tightening forecast accuracy to within 5%. The takeaway: sometimes the tool matters less than the visibility it creates. When reps and leaders see the same pipeline data in real time, the forecast improves because the conversations improve.
On r/SalesOperations, a RevOps lead asked whether anyone actually tracks forecast accuracy formally. The consensus was telling - forecasting still isn't treated like a measured system in a lot of orgs. It's treated like a weekly opinion. We've run this playbook with multiple teams and the pattern is consistent: the act of measuring accuracy, even imperfectly, changes behavior immediately.
FAQ
What's a good sales forecast accuracy percentage?
High-performing organizations target 85%+ on 30-day forecasts, and best-in-class teams hit 90-95%. The median sits at 70-79%, with only 7% achieving 90%+ consistently. Above 80% on a 30-day window puts you ahead of most B2B sales orgs.
Why is MAPE a bad metric for sales forecasting?
MAPE distorts when actual values are small - a $5K deal missing by $5K shows 100% error, skewing the average. WMAPE weights errors by revenue so large deals carry proportional importance. Use WMAPE for executive reporting and Bias% to catch directional over- or under-forecasting patterns.
How far out can you forecast sales reliably?
Accuracy degrades roughly 5-8% per month. A 30-day forecast achieves 85-90%; by 90 days, you're at 65-75%. Treat anything beyond 60 days as directional guidance for resource planning, not a revenue commitment.
How does CRM data quality affect forecast accuracy?
Stale records mean reps are forecasting deals with contacts who've changed roles. Experian estimates poor data costs 15-25% of revenue annually. A weekly enrichment cycle with 98% email accuracy keeps pipeline data grounded in reality instead of outdated assumptions - and that accuracy improvement shows up directly in your WMAPE.