Sales Forecasting Excel Templates That Actually Work
It's the 5th of the month and you're still updating last month's forecast. The actuals are in a separate export, the formulas are half-overwritten, and someone on the team saved over the master file again. You're not alone - 79% of sales organizations miss their forecast by more than 10%, and a big chunk of that miss starts with a broken spreadsheet. Let's fix that.
What You Need (Quick Version)
Most teams need exactly one template matched to their sales model:
- Pipeline-heavy B2B? Use the weighted pipeline template. It turns stage probabilities into dollar forecasts.
- SaaS with recurring revenue? Use the MRR/churn template. It models expansion, contraction, and churn month by month.
- Everyone else? Start with the 12-month rolling forecast template. It auto-replaces forecasts with actuals so you stop rebuilding every month.
Pick one. Get it working. Add complexity later.
Which Forecasting Method Fits?
Before you touch a template, decide how you're going to forecast. The method determines the structure, and picking the wrong one is why most sales forecasting spreadsheets turn into maintenance nightmares within two quarters.
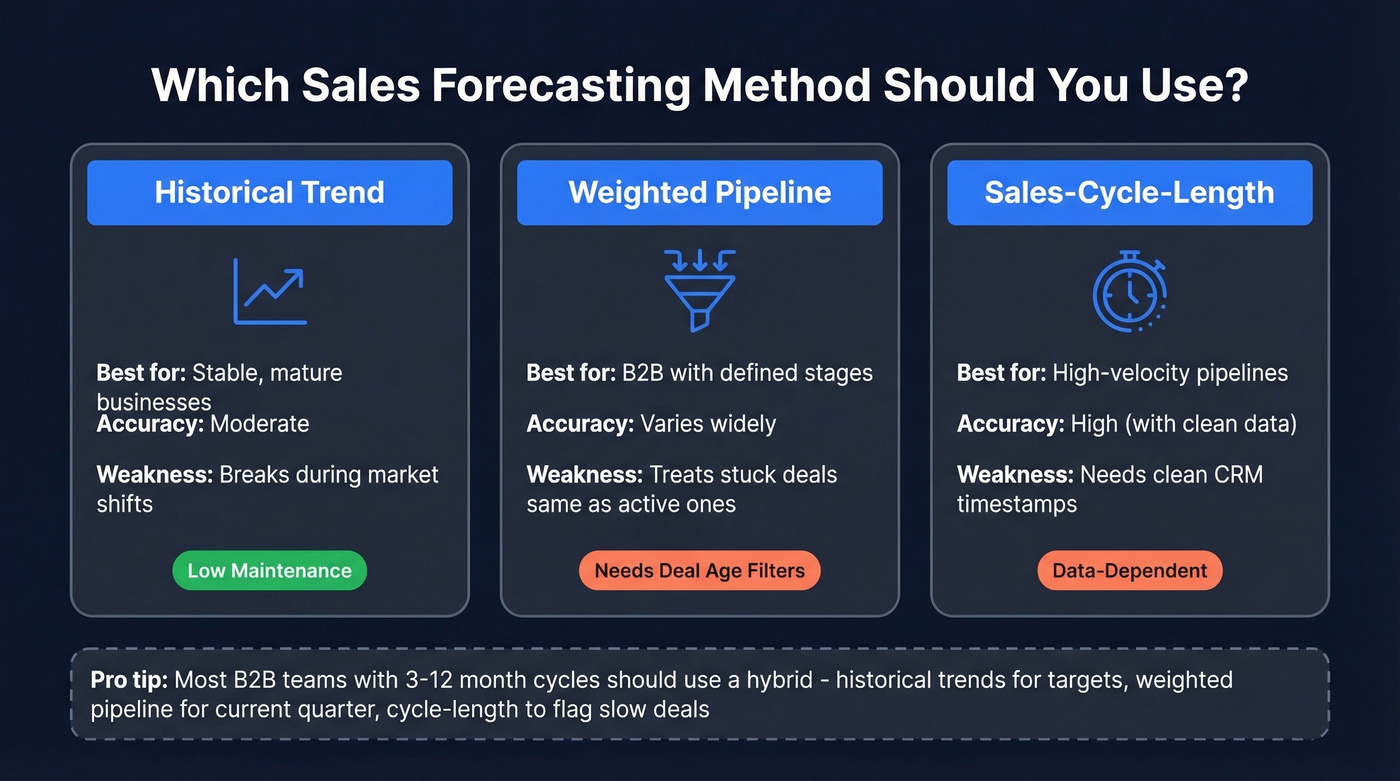
| Method | Best For | Weakness |
|---|---|---|
| Historical trend | Stable, mature businesses | Breaks during market shifts |
| Weighted pipeline | B2B with defined stages | Treats stuck deals the same as active deals |
| Sales-cycle-length | High-velocity pipelines | Needs clean CRM timestamps |
Traditional methods relying on rep intuition and stage probabilities miss by 20-30%. That's not a rounding error - that's the difference between hiring two reps and laying off two reps.
Here's the thing: weighted pipeline isn't a forecast. Multiplying deal value by stage probability treats a deal that's been sitting at 90% for six weeks the same as one that just got verbal confirmation yesterday. It's a snapshot, not a prediction. If you're going to use it, layer in deal age and last-activity-date filters - otherwise you're just doing math on stale data.
For most B2B teams with 3-12 month sales cycles, a hybrid approach works best: use historical trends for top-line targets, weighted pipeline for the current quarter, and sales-cycle-length analysis to flag deals that are running long.
Free Excel Forecast Templates
12-Month Rolling Forecast Template
The rolling forecast solves a common complaint on r/excel: the monthly rebuild. Instead of manually deleting forecast values and pasting in actuals, a rolling template uses XLOOKUP or INDEX/MATCH keyed to the current month to automatically swap forecast cells for actual data as it arrives.
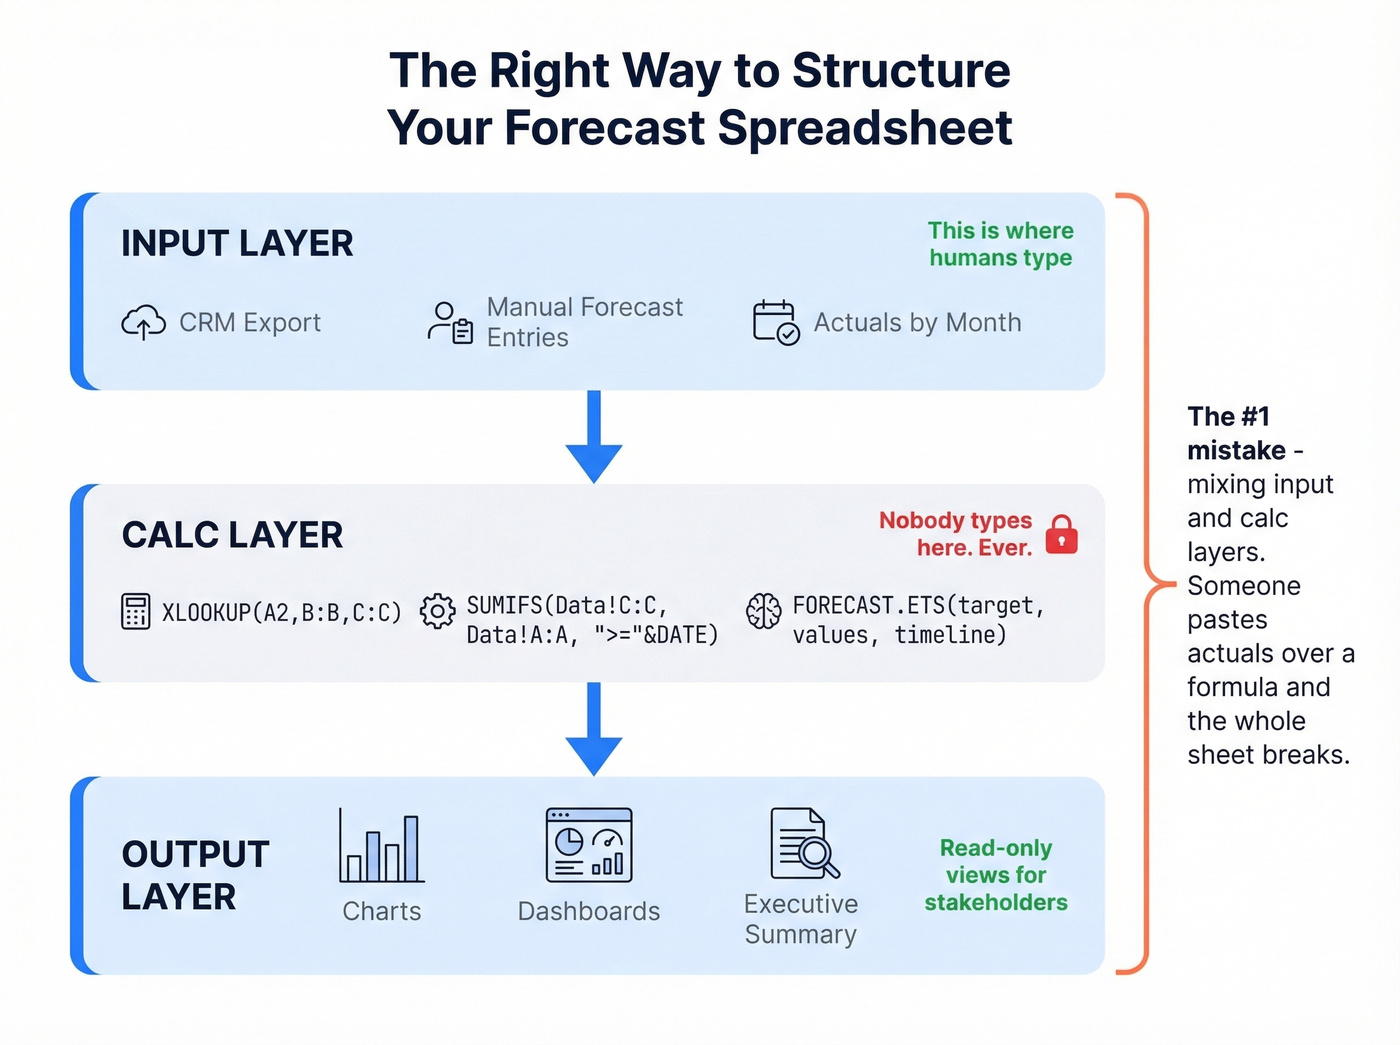
The architecture matters more than the formulas. You need two layers: an input layer where raw data lands - actuals from your CRM export, manual forecast entries for future months - and a calc layer where formulas pull from the input layer and never get touched. This separation prevents the formula-overwrite problem that plagues most forecast spreadsheets.
How to build it: Create two tabs - Input and Calc. Input tab columns: Month, Region, Product, Forecast, Actual. The Calc tab uses =IF(XLOOKUP(A2,Input!A:A,Input!E:E,"")<>"", XLOOKUP(A2,Input!A:A,Input!E:E), XLOOKUP(A2,Input!A:A,Input!D:D)) to auto-swap. If you manage multiple regions, add a dimension column and use SUMIFS against it instead of maintaining separate tabs. We've seen teams cut their monthly update time from two hours to fifteen minutes with just this change.
Weighted Pipeline Template
This is the most common format for Excel-based sales forecasting and the most commonly misused. Core fields, per Smartsheet's template library: Opportunity Name, Sales Phase, Sales Rep, Forecast Amount, Probability of Sale %, Month of Projected Close, and Weighted Forecast Amount (Forecast Amount x Probability %).
How to build it: Tab 1 (Pipeline): columns for the seven fields above plus Last Activity Date. Tab 2 (Summary): SUMPRODUCT grouped by month and rep. The critical addition is a conditional formatting rule that flags any opportunity where probability exceeds 50% but last activity date is more than 14 days ago. That single rule will improve your forecast accuracy more than any formula refinement ever will.
SaaS Revenue Forecast Template (MRR/Churn)
SaaS forecasting lives and dies on four formulas:
- MRR = Active Customers x Average Billed Amount
- ARR = MRR x 12
- ARPU = Total MRR / Number of Active Customers
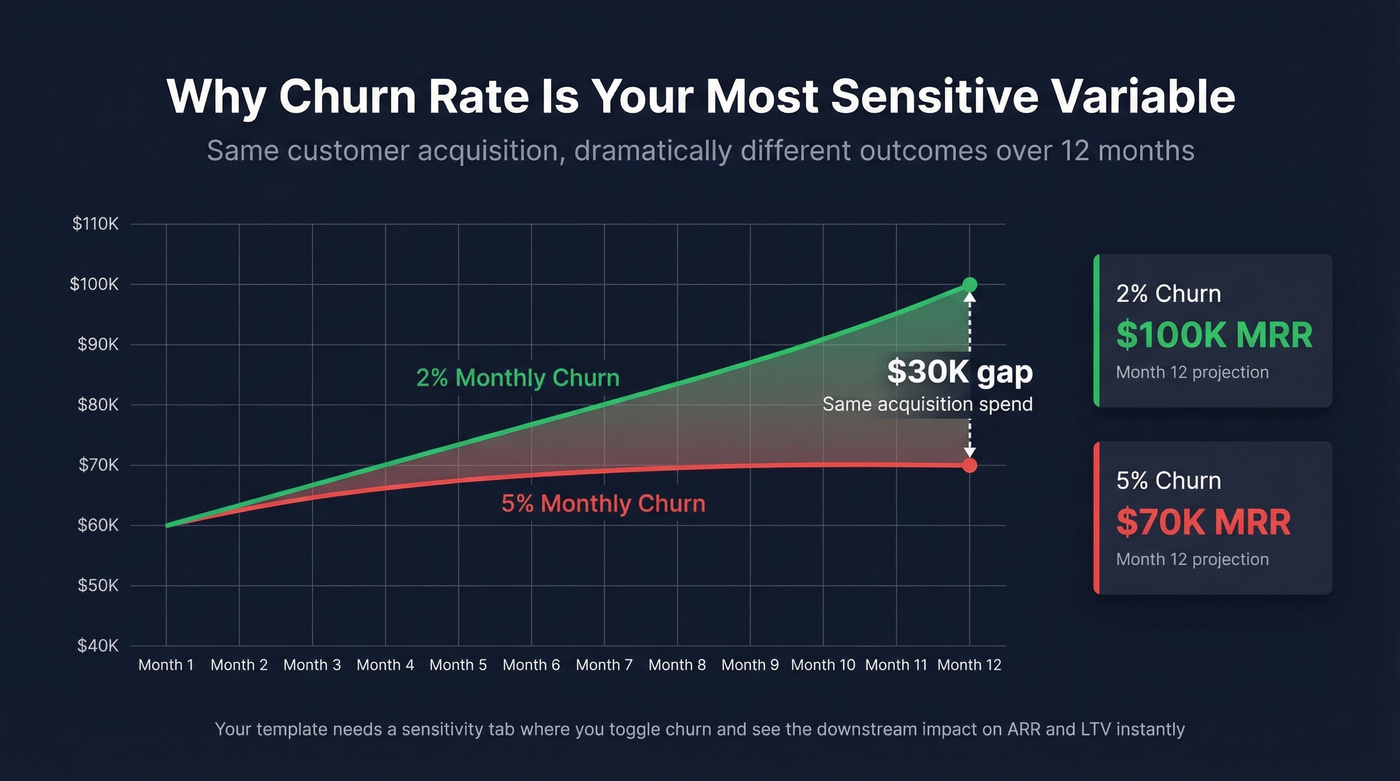
- LTV = ARPU x (1 / Churn Rate)
The sensitivity on churn is dramatic. Improving monthly churn from 5% to 2% can mean the difference between $70K and $100K MRR over 12 months - on the same customer acquisition numbers. Your template should include a sensitivity tab where you can toggle churn rate and immediately see the downstream impact on ARR and LTV. That's the tab your CFO will actually look at. (If you want to go deeper, see our guide to churn analysis.)
Quick Comparison
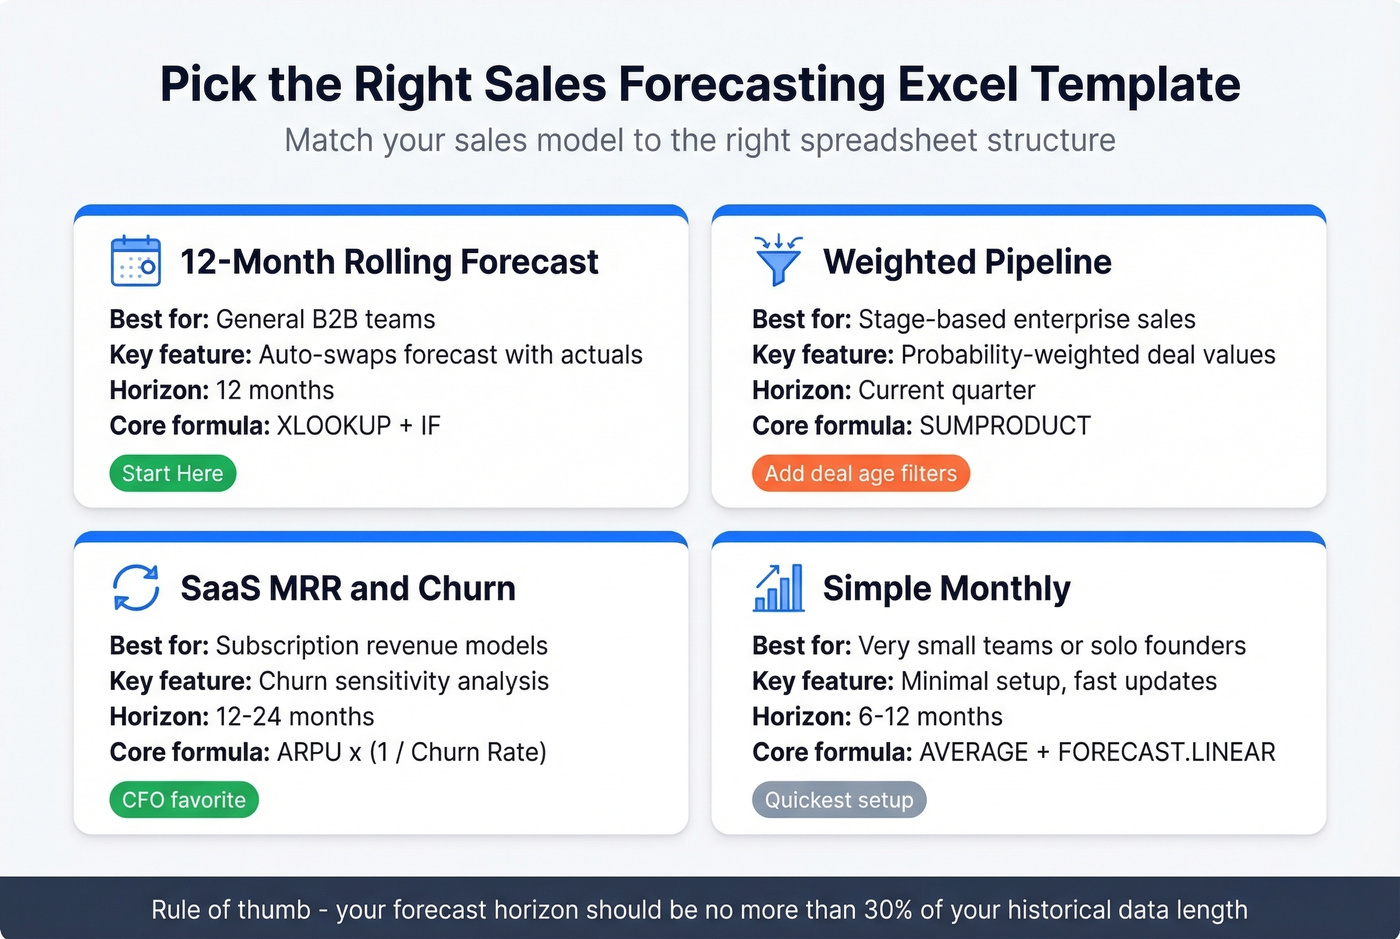
| Template Type | Best For | Key Fields | Time Horizon |
|---|---|---|---|
| Rolling forecast | General B2B | Monthly actuals + forecast | 12 months |
| Weighted pipeline | Stage-based sales | Opp name, stage, probability | Current quarter |
| SaaS MRR/churn | Recurring revenue | MRR, churn, ARPU, LTV | 12-24 months |
| Simple monthly | Very small teams | Revenue by month | 6-12 months |
Setting Up Your Spreadsheet
Getting the template right takes about an hour. Getting it wrong means rebuilding it every quarter.
1. Clean your data first. Run TRIM and CLEAN on text fields, standardize date formats, and remove duplicates. Dirty data in means garbage forecasts out.
2. Convert to Excel Tables. Select your data range and hit Ctrl+T. Tables auto-expand when you add rows, keep formulas consistent, and make structured references readable.
3. Separate input from calculation. This is the single most important architectural decision. Your input layer is where raw data lives. Your calc layer pulls from it using formulas and never gets touched directly. Optionally, add an output layer for dashboards and charts that pulls from the calc layer. Nobody types into the calc or output layers. Ever.
4. Respect the 30% rule. Your forecast horizon should be no more than 30% of your historical data length. Twelve months of history gives you a reliable 3-4 month forecast. Trying to project 12 months from 12 months of data isn't forecasting - it's guessing with extra steps.
5. Design for multi-entity from day one. If you have more than one product line, region, or sales team, add dimension columns to your input schema now. Use a single input table with columns for Region, Product, and Team, then SUMIFS or PivotTables to slice the calc layer. When you're consolidating forecasts from multiple departments, standardize the input schema across all trackers - otherwise you'll spend a week each month just merging data.
6. Set a refresh cadence. Monthly is the minimum. Weekly for high-velocity teams. Put the refresh date in a named cell so formulas that depend on "current month" logic have a single source of truth. If you’re running a bigger org, align this with your sales operations metrics cadence.
A weighted pipeline forecast is worthless if half your contacts bounce. Prospeo delivers 98% email accuracy with a 7-day data refresh, so the pipeline feeding your spreadsheet reflects real opportunities - not stale records.
Stop forecasting on dirty data. Start with verified contacts.
Excel Formulas for Forecasting
Trend Forecasting with FORECAST.LINEAR
For straightforward trend projection, FORECAST.LINEAR is your workhorse:
=FORECAST.LINEAR(x, known_y's, known_x's)
Where x is the target date, known_y's is your historical revenue column, and known_x's is your historical date column. It draws a straight line through your data and extends it - simple, fast, and surprisingly effective for businesses with steady growth.
When your data is noisy, smooth it first with a moving average. A 3-month moving average - =AVERAGE(C3:C5) - dampens monthly spikes and gives FORECAST.LINEAR cleaner input. Use 3-month for quarterly patterns, 6-month for semi-annual, 12-month if you have enough history.
Seasonal Forecasting with FORECAST.ETS
If your revenue has seasonal patterns - Q4 budget flush, summer slowdowns, fiscal year-end pushes - FORECAST.ETS handles it automatically:
=FORECAST.ETS(target_date, values, timeline, [seasonality])
Leave the seasonality argument blank and Excel auto-detects the cycle length. Verify what it found with =FORECAST.ETS.SEASONALITY(values, timeline) - it returns the number of periods in one cycle, like 12 for monthly data with annual seasonality. Don't manually set seasonality when you have less than two full seasonal cycles of history, because Excel can't reliably identify the components.
For a no-formula alternative, Excel's built-in Forecast Sheet wizard generates a complete forecast with 95% confidence intervals, handles up to 30% missing data points, and uses the AAA version of the ETS algorithm under the hood. It also outputs MASE, SMAPE, MAE, and RMSE via FORECAST.ETS.STAT - useful if you want to compare model performance. Select your data, go to Data > Forecast Sheet, and you'll have a publishable forecast chart in 30 seconds.
Measuring Accuracy with MAPE
A forecast without an accuracy metric is just a guess with a spreadsheet attached. MAPE (Mean Absolute Percentage Error) is the standard:
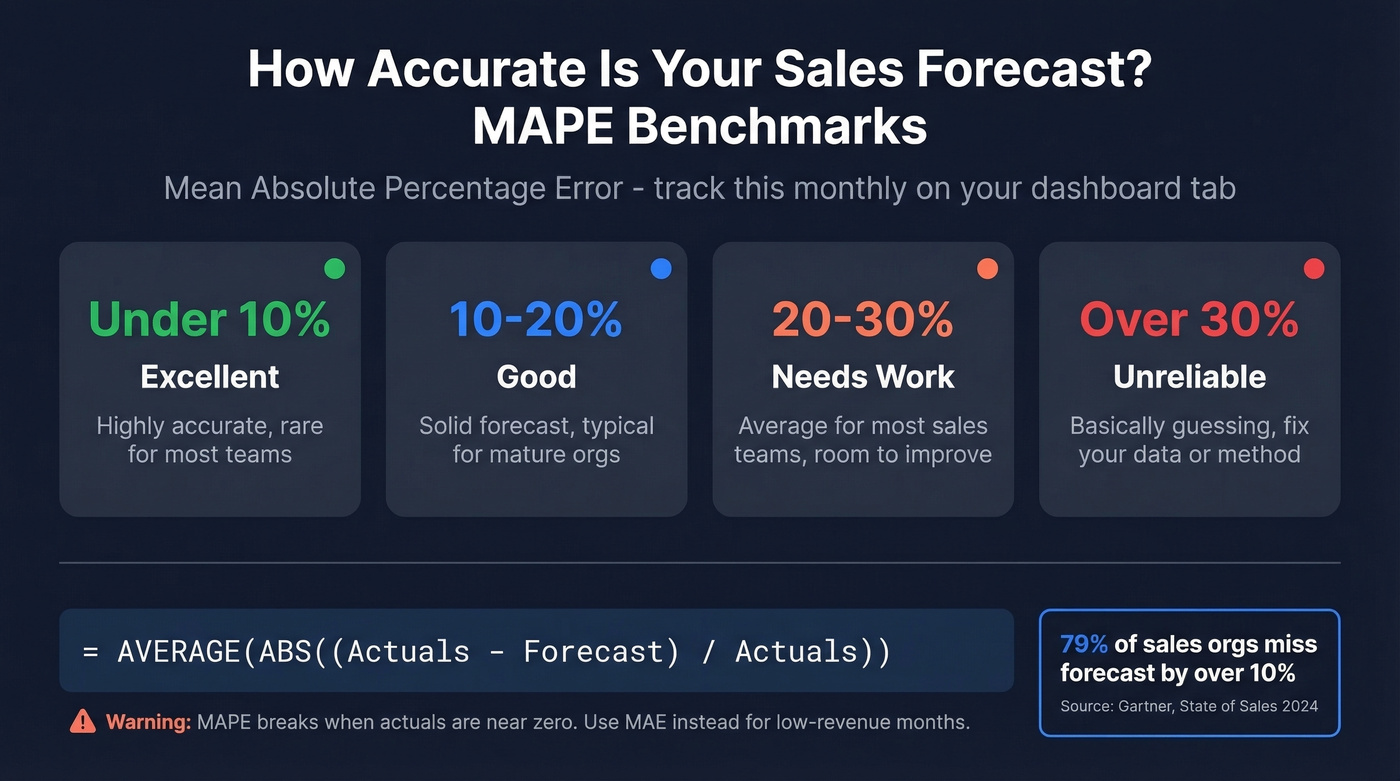
=AVERAGE(ABS((Actuals - Forecast)/Actuals))
A result of 0.19 means your forecasts differ from actuals by ~19% on average. Track this monthly in a dedicated cell on your dashboard tab. One warning: MAPE breaks when actuals are near zero. For months with very low revenue, use MAE instead, or exclude those periods from the calculation.
5 Mistakes That Break Forecasts
1. Formula overwrites. This is the #1 killer. Someone pastes actuals into a cell that contained a formula, and now that cell is a hardcoded number with broken rollover logic. We've seen this single mistake account for more forecast rebuilds than any other cause. The fix: separate input and calc layers. Actuals go in the input tab. Formulas live in the calc tab. Nobody types in the calc tab. Period.
2. Ignoring seasonality. If you're using FORECAST.LINEAR on data with obvious seasonal patterns, your forecast will systematically over-predict in slow months and under-predict in strong ones. Switch to FORECAST.ETS or apply seasonal indices manually.
3. Treating all pipeline deals equally. Reps leave probabilities at 90% after weeks of no contact. A deal with no logged activity in three weeks isn't a 90% deal - it's a 20% deal at best. Build last-activity-date logic into your weighted pipeline template. (This is also a classic pipeline health issue.)
4. No accuracy measurement. If you aren't calculating MAPE every month, you have no idea whether your forecast is improving or degrading. Add the formula. Track the trend. A forecast that's consistently 25% off is worse than useless - it's actively misleading your planning.
5. Dirty pipeline data. This is the mistake that compounds silently. If 30% of the contacts in your pipeline have bad emails or disconnected phone numbers, those deals aren't real - they're ghosts inflating your forecast. Tools like Prospeo catch stale records with 98% email accuracy and a 7-day data refresh cycle, so your pipeline reflects reality before it feeds your spreadsheet. Clean data in, clean forecast out.
What Good Accuracy Looks Like
Let's set realistic expectations. 79% of sales organizations miss their forecast by more than 10%. Gartner reports fewer than 50% of sales leaders have high confidence in their forecasts. If your numbers are off, you have plenty of company.
Here are the benchmark bands:
- World-class (80-95% accuracy): Clean CRM data, defined methodology, MAPE tracked religiously. The exception, not the norm.
- Average B2B (50-70% accuracy): Most teams land here. Good enough for directional planning, not good enough for headcount decisions.
- Lagging (<50% accuracy): You'd get better results flipping a coin. Usually caused by dirty data, inconsistent methodology, or both.

Track MAPE monthly in your template. Separating input and calc layers and adding a deal-age flag to your pipeline template can materially improve accuracy. If you're consistently above 25% MAPE, the problem isn't your spreadsheet - it's your data or your methodology. Fix those first. If you need a clearer definition, start with sales forecast vs sales goal.
Look, if your average deal size is under $15K and your team has fewer than five reps, a well-maintained Excel template will outperform a $30K/year forecasting platform nine times out of ten. The tool isn't the bottleneck. The data is.
When to Move Beyond Excel
Excel works until it doesn't. Here are the breaking points:
- More than 5 reps contributing pipeline data
- More than 3 product lines or regions
- More than 2 hours per month maintaining the spreadsheet
- Concurrency conflicts (the "Final_v3_reallyfinal.xlsx" problem)
When you hit these thresholds, CRM-native forecasting becomes worth the investment. HubSpot offers a free downloadable sales forecasting Excel template, and HubSpot CRM has a free tier. Salesforce runs about $25-$300/user/month depending on edition and includes native forecasting features.
The ML benchmark is real: spreadsheet-based forecasts typically run 15-40% MAPE, while ML-powered tools achieve 5-15% MAPE. But ML on bad data produces bad forecasts faster. Before upgrading your forecasting tool, upgrade your pipeline data - verify emails, confirm direct dials, and scrub contacts that haven't been touched in weeks. (If you’re evaluating platforms, compare sales forecasting solutions and best sales forecasting tools.)
Your forecast spreadsheet models probability and deal age - but none of that matters if your reps can't reach the buyers. Prospeo gives you 143M+ verified emails and 125M+ direct dials so every opportunity in your pipeline has a real person behind it.
Build a pipeline worth forecasting. Start free today.
FAQ
What's the best free sales forecasting Excel template?
For most B2B teams, the 12-month rolling forecast template is the best free starting point - it auto-swaps forecasts for actuals and eliminates the monthly rebuild. SaaS companies should use the MRR/churn template instead, since recurring revenue math differs fundamentally from pipeline-based forecasting. Both are free to build using the specs in this guide.
Can I use these templates in Google Sheets?
Yes, all formulas work in Google Sheets. FORECAST.LINEAR and FORECAST.ETS are both supported natively. The one exception is Excel's Forecast Sheet wizard, which is Excel-only - there's no Google Sheets equivalent for the automated chart-and-confidence-interval generation. You can still build the same output manually using the ETS functions.
How often should I update my forecast?
Monthly at minimum, weekly for high-velocity sales teams running short deal cycles. The rolling forecast design makes monthly updates take minutes instead of hours - actuals auto-populate from your input layer, and the remaining forecast months stay untouched. If your update cycle takes more than 30 minutes, your template architecture needs work.
How do I keep pipeline data clean for accurate forecasts?
Verify contact data before it enters the CRM. Stale emails and disconnected numbers inflate pipeline counts, which directly inflates your forecast. Run TRIM and CLEAN on imports, deduplicate weekly, and flag deals with no activity in 14+ days. For automated verification at scale, tools with real-time email validation and regular data refresh cycles keep your pipeline reflecting reality rather than wishful thinking.
What MAPE score should I target?
Aim for under 20% MAPE as a realistic first milestone. World-class teams hit 5-10%, but most B2B organizations land in the 30-50% range. If you're above 25% consistently, focus on data quality and methodology before tweaking formulas. Track MAPE monthly in a dedicated cell - the trend matters more than any single reading.