Pipeline Coverage Ratio: How to Calculate the Number That Actually Matters
A semiconductor sales leader managing 150 reps recently admitted on r/sales that their pipeline was "realistically inflated by about 60%." Wrong dollar values, outdated close dates, stale opportunities nobody had touched in months. Their 3.5x coverage? Probably closer to 1.4x once you stripped out the phantom deals.
That's not a pipeline problem. It's a forecasting crisis hiding behind a comfortable-looking Pipeline coverage ratio.
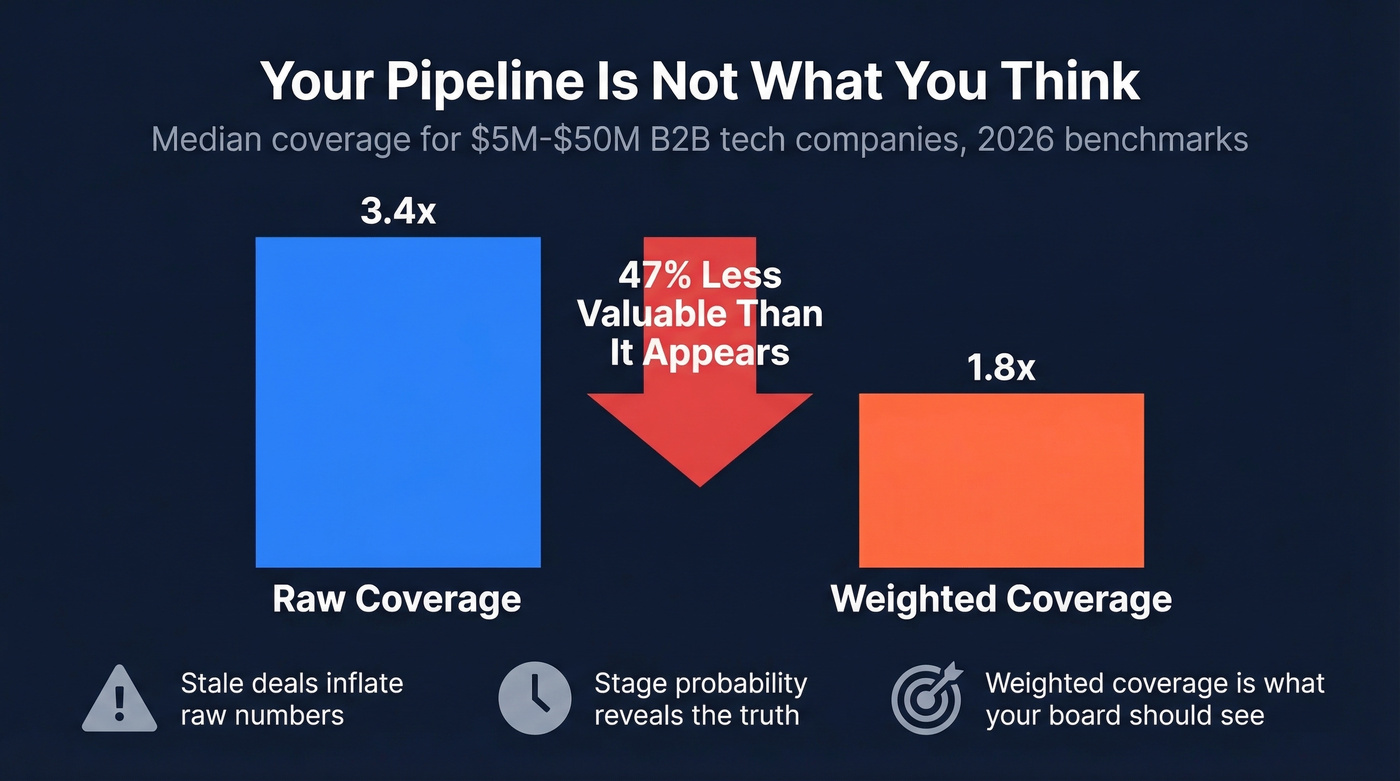
Here's the short version: the 3x rule is lazy math. A practical starting target is 1 / your win rate x 1.2 to account for slippage. 2026 benchmarks for $5M-$50M B2B tech companies show 3.4x raw but only 1.8x weighted. If you're not weighting by stage probability, you're planning on phantom pipeline.
The Formula
Pipeline coverage ratio = Total Pipeline Value / Revenue Target.
$3M in open pipeline against a $1M quota = 3x coverage. Simple enough. The problem is that 3x implicitly assumes a 33% win rate most B2B teams don't hit. Enterprise teams (1,000+ employees) typically close at 20-25%. One 2026 benchmark table puts SaaS & Technology win rates at 22%.
The formula itself is fine. The default target is where everyone goes wrong.
Why the 3x Rule Is Wrong
For $5M-$50M B2B tech companies, median raw coverage sits at 3.4x while weighted coverage is just 1.8x. That pipeline is 47% less valuable than it appears. The number in your board deck? It doesn't exist in any meaningful sense.
Excessively high coverage - above 8x - often signals poor qualification, not a healthy pipeline. Coverage without velocity is equally dangerous: you can have 5x coverage, but if deals aren't moving through stages, it's dead pipe.
Let's be honest: most teams obsess over generating more pipeline when they should be disqualifying faster. A ruthlessly honest 3x beats a bloated 6x every single quarter.
Four factors determine your real number:
- Historical win rate sets the baseline
- Sales cycle length determines slippage risk
- Deal size concentration tells you whether one lost whale tanks the quarter
- Lead source quality shifts the math further - inbound converts differently than cold outbound
This ratio is a leading indicator. When it drops below 3x, teams tend to miss their number 2-3 months later. By the time you see the revenue miss, it's too late to fix the pipeline that caused it.
How to Calculate Coverage for Your Team
Start with your segmented win rate from the last 12 months - not your blended average, but win rate by deal size, source, and rep tier. Use the median sales cycle, not the average. Then apply: 1 / win rate x 1.2 to account for deal slippage and pipeline variability.
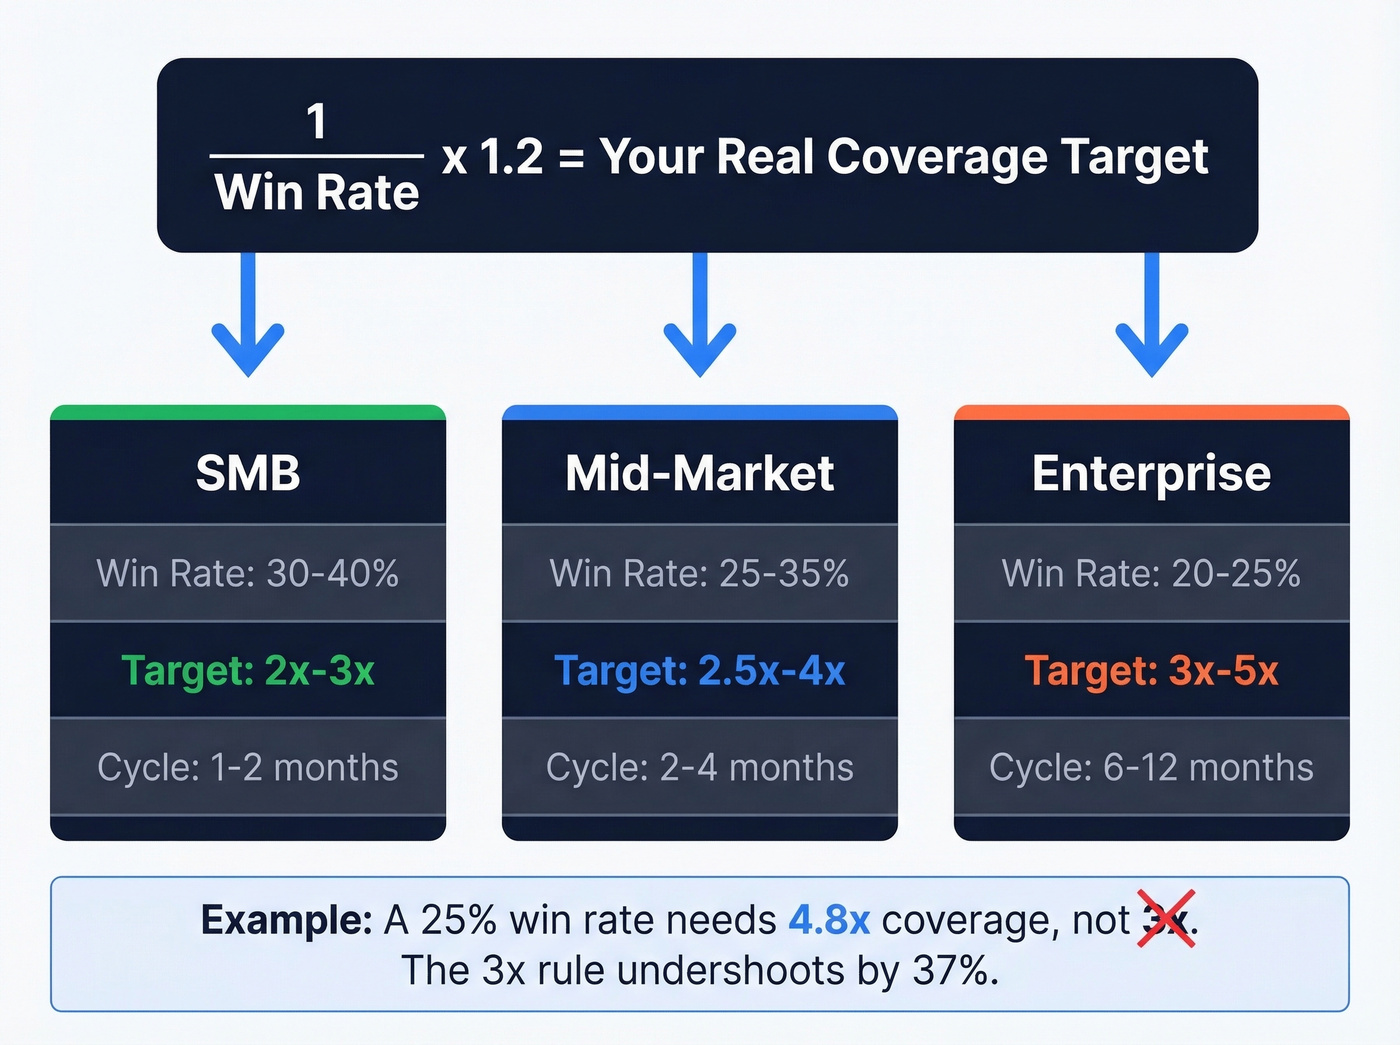
A team with a 25% win rate needs 4.8x coverage, not 3x. A team closing at 40% can operate comfortably around 3x. The difference is enormous, and it's why a single benchmark applied across all segments is meaningless.
| Segment | Win Rate | Coverage Target | Cycle Length |
|---|---|---|---|
| Enterprise (1,000+) | 20-25% | 3x-5x | 6-12 months |
| Mid-Market (100-999) | 25-35% | 2.5x-4x | 2-4 months |
| SMB (<100) | 30-40% | 2x-3x | 1-2 months |
Win rates vary dramatically by vertical too:
| Vertical | Win Rate | Median Deal | Cycle |
|---|---|---|---|
| Professional Services | 28% | $8,900 | 51 days |
| SaaS & Technology | 22% | $12,400 | 67 days |
| Real Estate & Construction | 16% | $89,300 | 147 days |
A real estate firm at 16% win rate needs roughly 7.5x raw coverage to hit plan. Telling them "3x is healthy" is malpractice.
Your coverage ratio is only as real as the contacts underneath it. Teams using unverified data carry 30-40% phantom pipeline - deals built on bounced emails and disconnected numbers. Prospeo delivers 98% email accuracy and 125M+ verified mobiles, refreshed every 7 days.
Stop forecasting on phantom pipeline. Verify the data first.
Weighted vs. Raw Coverage
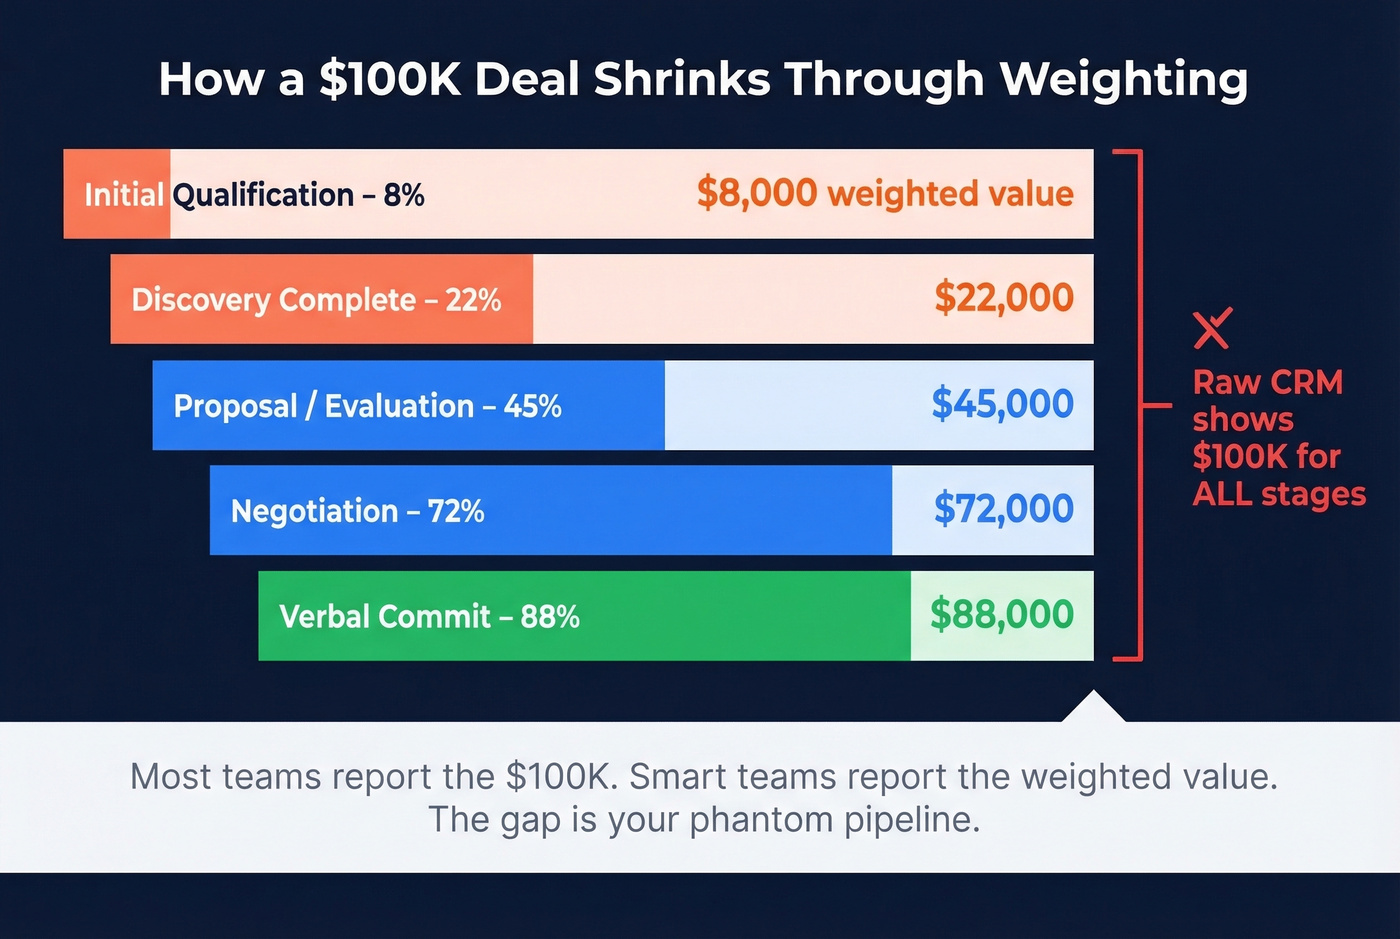
Weighting converts your pipeline from wishful thinking into something closer to a forecast: Opportunity Value x Stage Probability = Weighted Value. This is where your pipeline to target ratio starts reflecting reality instead of optimism.
Stage probabilities that track with 2026 mid-market B2B benchmarks:
| Stage | Probability |
|---|---|
| Initial Qualification | 8% |
| Discovery Complete | 22% |
| Proposal / Evaluation | 45% |
| Negotiation | 72% |
| Verbal Commit | 88% |
A $100K deal in Stage 1 contributes $8K to weighted coverage - not $100K. In Salesforce, the Expected Revenue field does this math automatically. Turn it on.
Most teams should start with stage-based defaults and layer in rep judgment overrides as data matures. AI/ML predictions work too, but only if you've got 2+ years of closed-opportunity data to train on. Once weighted coverage is reliable, it becomes the foundation of your sales forecasting coverage - the number your CFO should actually trust when planning headcount and spend.
When to Measure (and Common Mistakes)
Dave Kellogg documented a pattern we've seen repeatedly: a team's starting pipeline coverage declined from 3.1x to 2.4x over several quarters while pipeline generation stayed flat. They missed plan. The ratio told the story months before the revenue number did.
Use to-go coverage - 3x of the remaining target, not the original number. And don't trust your pipeline snapshot until week 3 of the quarter. Reps clean up stale deals in weeks 1-2, and the numbers before that cleanup are fiction.
Skip rolling four-quarter pipeline views too. You can starve with 3x coverage if it's all landing in Q3 and Q4 while this quarter's pipe is empty.
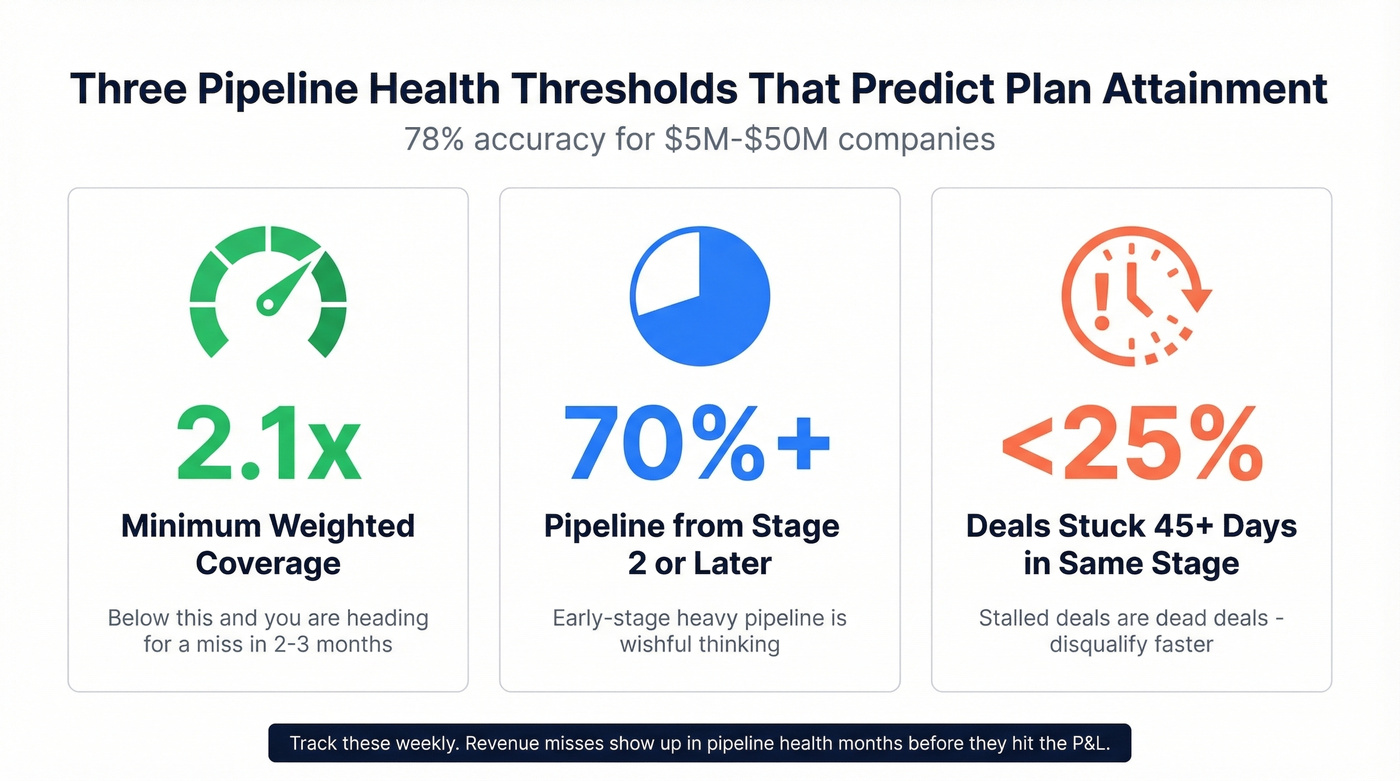
Three operational health thresholds worth tracking:
- Weighted coverage ≥2.1x
- 70%+ of weighted pipeline from Stage 2 or later
- Less than 25% of pipeline value stuck in the same stage for over 45 days
In our experience, these three thresholds predict plan attainment with 78% accuracy in the $5M-$50M band.
Fix the Data Under the Ratio
None of this math matters if the data underneath is garbage. Remove any deal that's been inactive for 45-60 days. Audit close dates quarterly - reps push dates forward reflexively, and those pushed dates create phantom coverage.

Here's the thing: phantom pipeline doesn't just come from stale CRM records. It starts with bad contact data. If reps are building pipeline against bounced emails and disconnected phone numbers, those deals were never real to begin with. We've watched teams shave 30-40% off their "pipeline" just by validating the contacts underneath it. Prospeo verifies emails at 98% accuracy and mobile numbers at a 30% pickup rate, refreshing every 7 days - so the contacts underneath your pipeline are actually reachable, and the ratio you're reporting to the board means something.
If you're tightening this process, it helps to standardize your lead scoring and lead status definitions so reps stop reviving dead deals.
Bad contact data inflates your raw coverage and kills your weighted forecast. When reps prospect with Prospeo's 300M+ verified profiles, every deal in your pipeline has a real person behind it - not a bounced inbox. That's how you turn 3.4x raw into 3.4x real.
Real pipeline starts at $0.01 per verified email.
FAQ
What's a good pipeline coverage ratio?
There's no universal number. Use 1 / your win rate x 1.2. A 25% win rate needs ~4.8x; a 40% win rate works at ~3x. Enterprise, mid-market, and SMB segments each require different targets based on cycle length and deal concentration.
What's the difference between weighted and unweighted coverage?
Unweighted counts every deal at face value. Weighted multiplies each opportunity by its stage close probability. The gap between them is your phantom pipeline - typically 40-50% of reported value in mid-market B2B.
How do I improve pipeline coverage without inflating it?
Remove stale opportunities inactive 45+ days, verify contact data so reps target reachable buyers, and weight pipeline by stage probability. A clean 3x beats a dirty 5x every quarter.