Total Addressable Market: A Practitioner's Guide to TAM
Your co-founder just dropped "$47 billion market" on the TAM slide. The number came from a Gartner report, a generous interpretation of "adjacent markets," and roughly zero actual customer data. Investors are going to skip that slide - and you know it. The consensus on r/startups is blunt: total addressable market estimates are often "stitched together from random assumptions," and everyone plays along. Let's stop playing along and build a number that actually holds up.
The Short Version
- Calculate bottom-up, not top-down. Count real accounts, multiply by realistic ACV. Top-down analyst numbers are a starting point, not a finish line.
- Investors care more about SOM than TAM. Your serviceable obtainable market - what you can actually capture in the near term, often modeled over one to three years - is where credibility lives.
- Use free government data plus a B2B database to count accounts, estimate pricing by segment, and pressure-test with conversion benchmarks.
What Does TAM Mean in Business?
TAM stands for total addressable market - the total revenue opportunity available if you captured 100% of the market for your product or service. It's a ceiling, not a forecast. The formula is straightforward:
TAM = Total potential customers x Average revenue per customer (ARPU or ACV)
Every other complexity - segmentation, geographic weighting, pricing tiers - is just making those two inputs more accurate.
Here's why the distinction matters. TAM isn't the same as current market revenue. McKinsey's cybersecurity analysis illustrates this well: the vended market, what companies actually spent on cybersecurity products, was roughly $150B in 2021. But the addressable market was estimated at $1.5-2.0 trillion when you include all the risk that organizations weren't yet addressing with purchased solutions. That's a 10x gap between "what people buy today" and "what they could buy."
This gap is exactly why the concept exists. It captures latent demand, not just current spend. But it's also why TAM gets abused - the bigger the gap between vended market and theoretical ceiling, the more assumptions you're stacking on top of each other, and the less anyone should trust the number without seeing the math behind it.
TAM vs SAM vs SOM
These three acronyms get thrown around interchangeably, but they answer fundamentally different questions. Here's a single example to make the distinctions concrete.
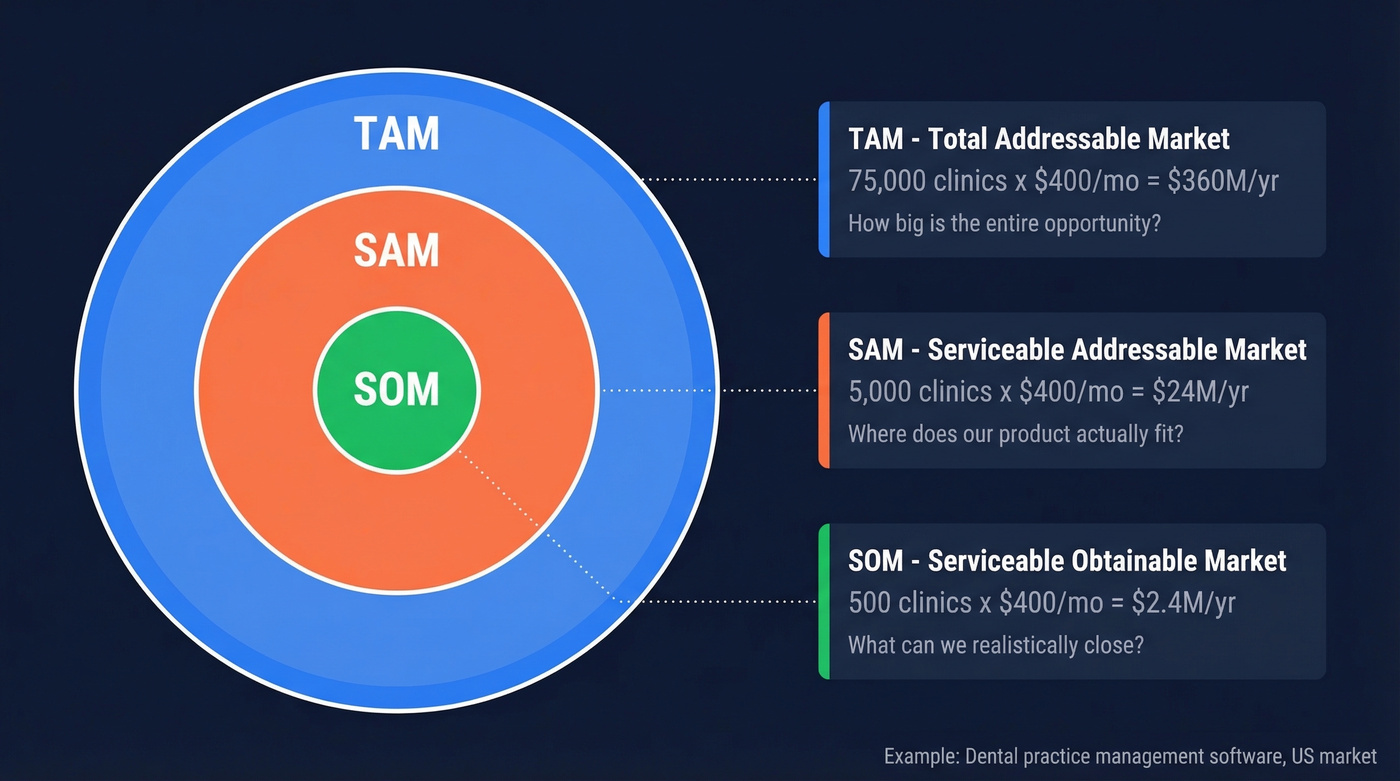
Imagine you sell practice management software to dental clinics in the US, priced at $400/month.
| TAM | SAM | SOM | |
|---|---|---|---|
| Definition | Total market demand | Segment you can serve | Share you can win now |
| Question answered | How big is the opportunity? | Where does our product fit? | What can we actually capture? |
| Clinic example | 75,000 x $400 = $360M | 5,000 x $400 = $24M | 500 x $400 = $2.4M |
| Investor reads as | Ambition boundary | PMF/GTM boundary | Execution clarity |
TAM says there are 75,000 dental clinics that could theoretically use your software. SAM narrows to the 5,000 that match your ICP - maybe mid-size practices in states where you have sales coverage. SOM is the 500 you can realistically close given your team size, budget, and pipeline.
If your CRM has 500 qualified accounts but your TAM slide says $2 billion, investors notice the disconnect. SOM is where your credibility lives, and it should be grounded in CAC, pipeline capacity, and conversion rates - not wishful market share assumptions.
How to Calculate TAM
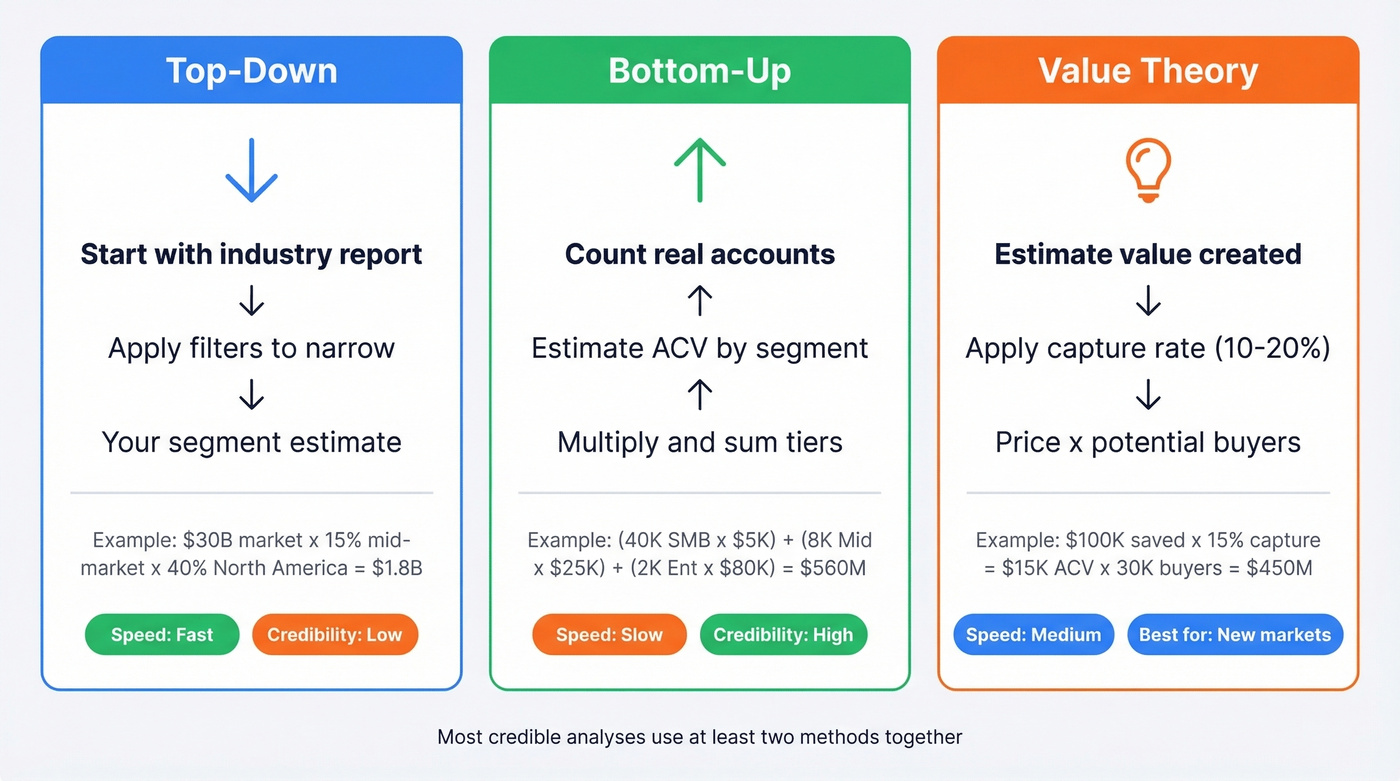
Three methods, each with different strengths. Most credible analyses use at least two.
Top-Down Method
Start with a published industry number and narrow it. Grab a Gartner, IDC, or IBISWorld report that sizes your broader market, then apply filters to isolate your segment.
Example: "The global HR software market is $30B. We sell to mid-market companies (15% of that market) in North America (40% of global revenue). TAM = $30B x 0.15 x 0.40 = $1.8B."
It's fast and easy to source. It's also the weakest standalone method because you're inheriting someone else's assumptions and definitions. Use it as a sanity check, not your primary number.
Bottom-Up Method
This is the method that earns investor trust. You're counting real accounts and multiplying by what they'd actually pay. In our experience, a properly built bottom-up TAM takes two to three days but saves weeks of investor pushback.
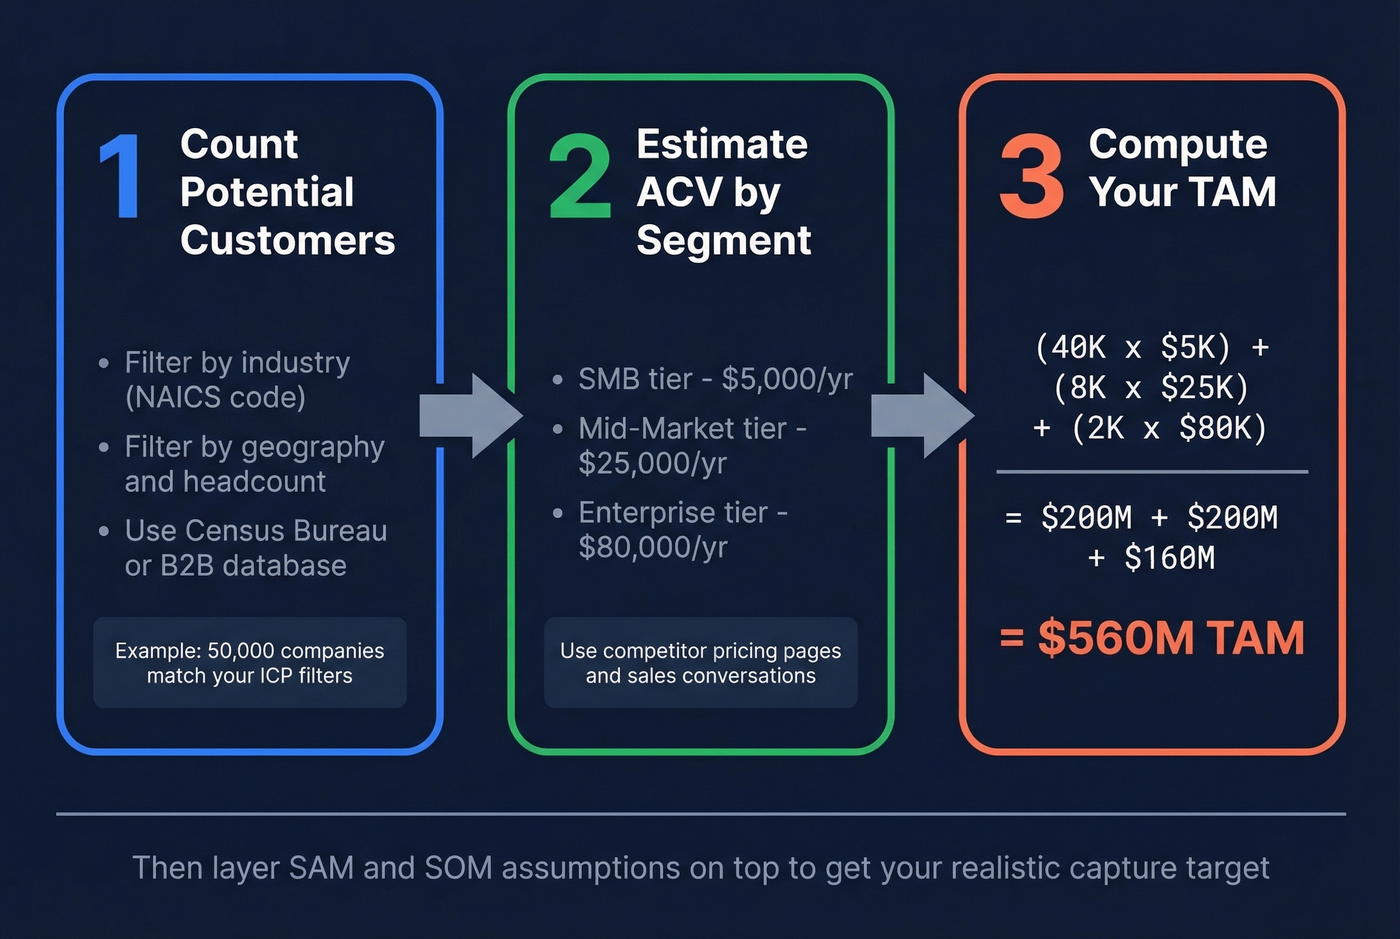
Step 1: Count potential customers. Filter by industry, geography, company size, and buying behavior. Free sources like the US Census Bureau give you business counts by NAICS code and state. For more granular filtering, pull a list from a B2B database - set industry, headcount, and geography filters, and you've got your starting denominator in minutes rather than days of manual research.
Step 2: Estimate ACV by segment. Don't use a single average. Break customers into tiers - SMB, mid-market, enterprise - and assign realistic pricing to each. Fill gaps using competitor pricing pages or willingness-to-pay conversations with prospects.
Step 3: Compute. TAM = (SMB count x SMB ACV) + (Mid-market count x Mid-market ACV) + (Enterprise count x Enterprise ACV). Then layer SAM and SOM assumptions on top.
The power of bottom-up is the reframing it forces. Instead of "$10 billion market," you end up with something like "50,000 potential companies, maybe 8,000 realistically reachable in the next three years." That reframing - common advice on r/SaaS - is infinitely more useful for planning.
Value Theory Method
When your product creates a market that doesn't exist yet, there's no industry report to reference. Value theory starts with the economic value your product creates - cost savings, revenue increase, risk reduction, time savings - and estimates what share of that value you can capture as revenue.
Software typically captures around 10-20% of the value it creates. If your tool saves a customer $100,000/year in manual labor costs, you'd price it at $10,000-$20,000/year.
This is the right approach for genuinely disruptive products. Uber couldn't have sized its TAM using the historical taxi and limo market - as Bill Gurley pointed out, that would assume "the future will look quite like the past." Value theory lets you model demand that doesn't show up in existing spending data. A thread on r/startups put it more bluntly: if your product changes behavior, backward-looking market data is useless.
Step 1 of your bottom-up TAM is counting real accounts - and that's where most founders stall. Prospeo's B2B database gives you 300M+ profiles with 30+ filters including industry, headcount, geography, funding, and technographics. Pull your total account universe in minutes, segment by company size, and get the denominator your TAM calculation actually needs.
Build your bottom-up TAM on real account data, not analyst guesswork.
Where to Find TAM Data
Most founders assume they need expensive analyst reports to size their market with precision. They don't. Free government sources cover most of what a typical B2B exercise requires, and paid tools fill the gaps when you need account-level precision.
Free Sources
| Source | Best For | Notes |
|---|---|---|
| US Census Bureau | Business counts by industry/size/state | Updated annually, 1-2 yr lag |
| Bureau of Labor Statistics | Roles by industry (buyer-based TAM) | Free, comprehensive |
| OECD / UN Data | International population, trade, indices | Good for global TAM |
| SEC Filings (EDGAR) | Competitor financials, operational data | Free, public companies only |
| International Trade Center | Export/import demand, competitive markets | Trade Map tool |
Paid Sources
| Source | Best For | Approximate Cost |
|---|---|---|
| Gartner / Forrester / IDC | Industry-level market sizing | $1,000-$10,000+ per report |
| IBISWorld | NAICS-mapped industry reports | $1,000-$5,000 per report |
| PitchBook | Investor-grade company + market data | $20,000-$50,000+/yr |
| Crunchbase | Startup data, funding rounds | Free tier; Pro ~$49/mo |
| ZoomInfo | B2B company + contact data | $15,000-$40,000+/yr |
| Prospeo | B2B account counting, 30+ filters | Free tier; paid ~$0.01/lead |
For early-stage teams, the bottom-up method lives or dies on accurate account counts. A self-serve database with 30+ filters for industry, headcount, geography, and tech stack lets you build your denominator without committing to a five-figure annual contract. If your first market sizing exercise is ahead of you, a free tier on a tool like Prospeo is enough to validate whether your market is 5,000 companies or 50,000.
Common TAM Mistakes
Understanding the concept is one thing. Calculating it accurately is another. Here are the mistakes we see most often, and a couple of them are surprisingly easy to make even if you've done this before.
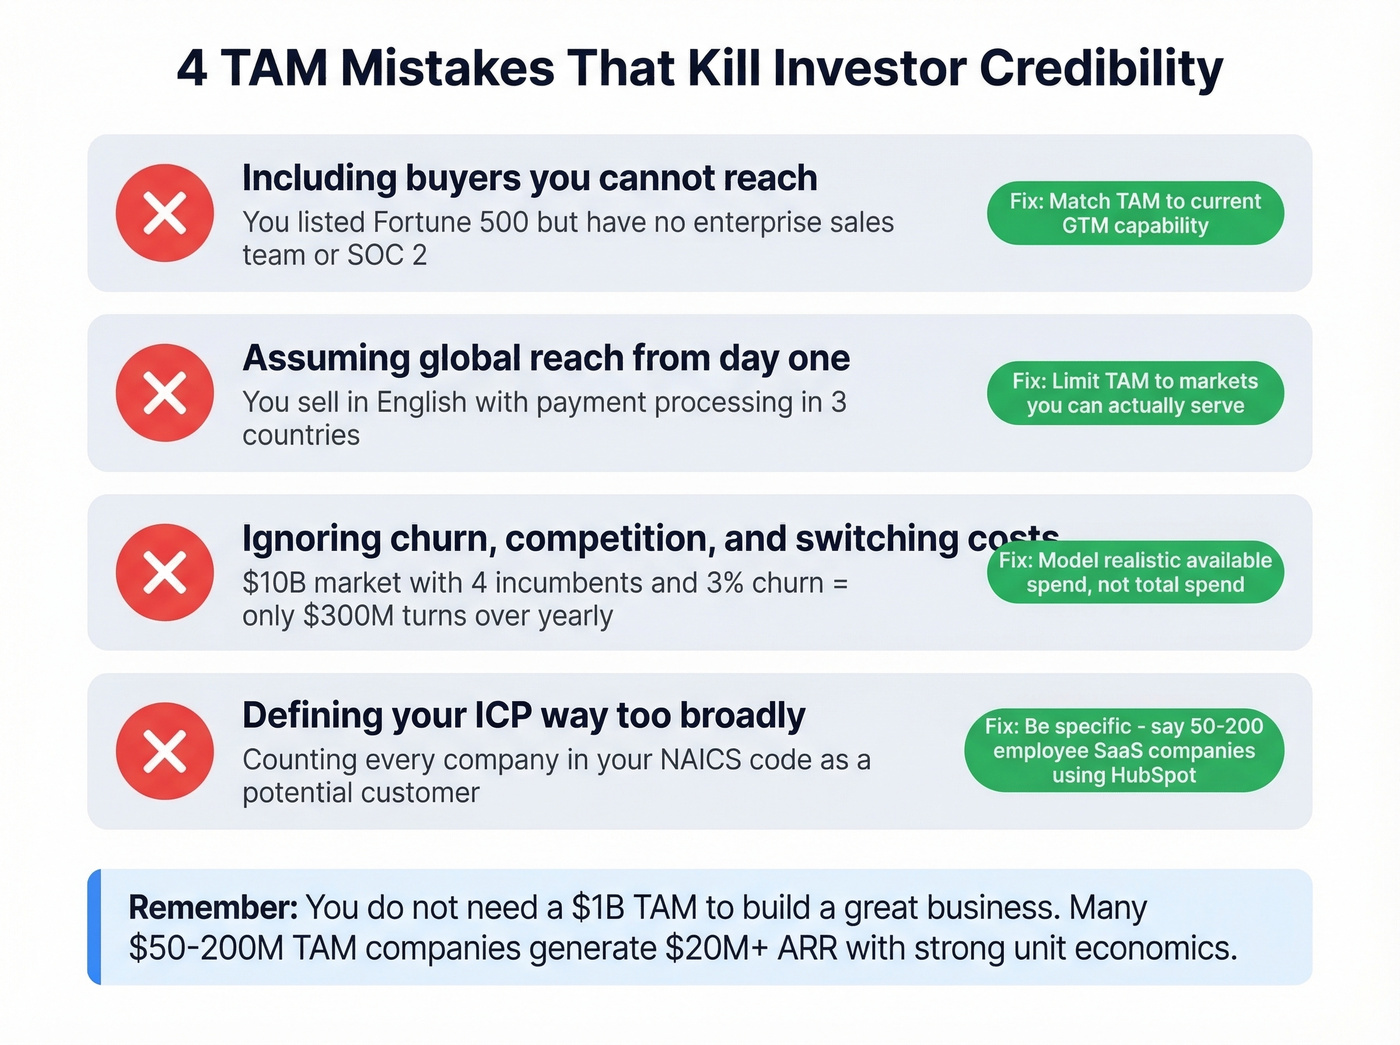
Including buyers you can't reach. Your TAM includes Fortune 500 enterprises, but you don't have an enterprise sales team, a SOC 2 certification, or a 12-month implementation timeline. Those aren't your customers yet.
Assuming global reach from day one. You sell in English, have payment processing in three countries, and your support team is in one time zone. Your addressable market isn't global. It's wherever you can actually deliver value today.
Ignoring churn, competition, and switching costs. A $10B market with four entrenched incumbents and 3% annual churn implies about $300M of annual spend turns over. That doesn't mean it's "yours" - it means that's the slice you have a realistic shot at competing for each year without displacing locked-in customers.
Defining your ICP too broadly. This is the most common pattern we see on r/SaaS: founders count every company in their NAICS code as a potential customer, ignoring that their product only fits a narrow slice. If your ICP is "B2B SaaS companies with 50-200 employees using HubSpot," say that - don't claim the entire CRM market.
Here's the thing: if your average deal size is under $10K, you probably don't need a $1B+ TAM to build a great business. Plenty of $50-200M TAM companies generate $20M+ ARR with strong unit economics and no venture funding. The obsession with billion-dollar TAMs is a VC artifact, not a business requirement. Amazon started with books. Zoom started with tech companies. Start small, prove penetration, then expand the frame.
Presenting TAM in a Pitch Deck
Most pitch decks show TAM as a pyramid - big number on top, smaller numbers below. Investors have seen this slide ten thousand times. It tells them nothing about your execution plan. Flip it and build from the bottom.
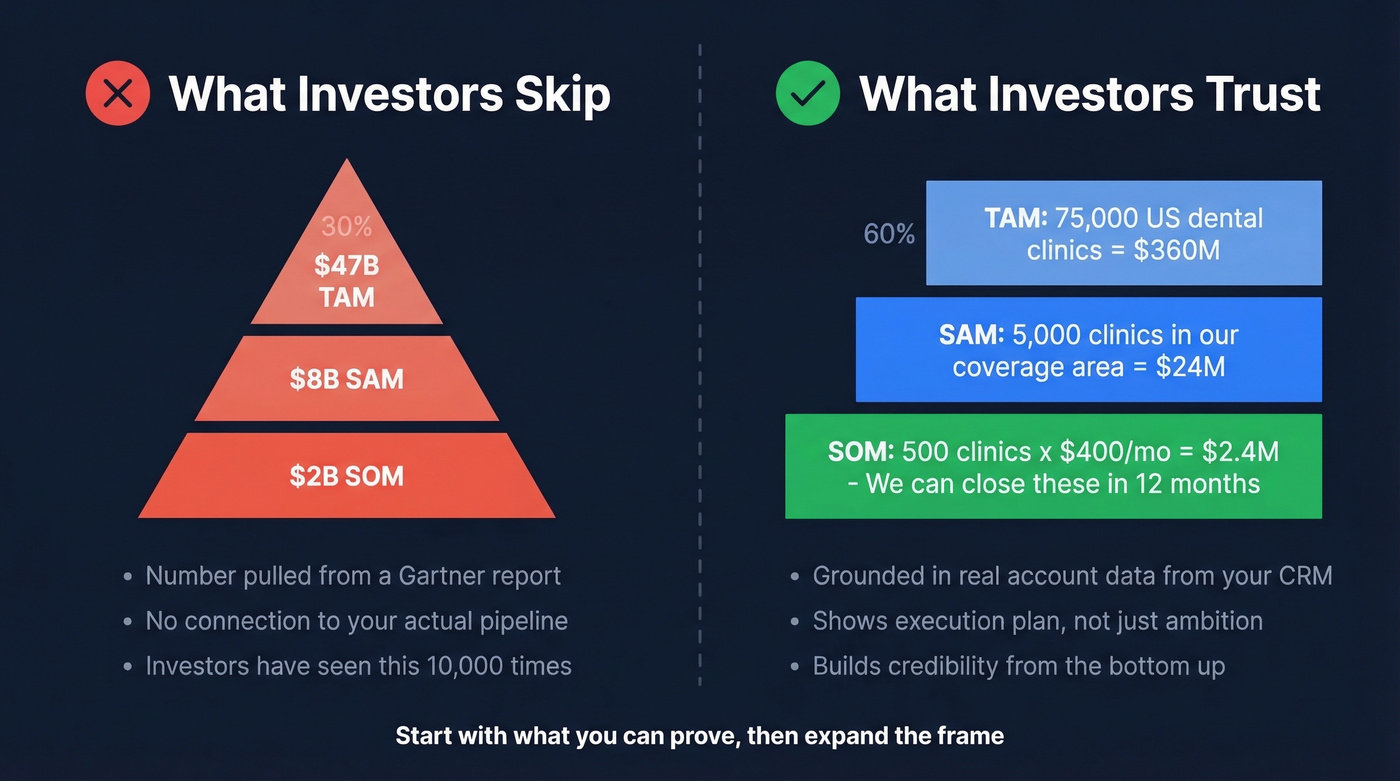
Start with SOM: "We can close 500 dental clinics in the next 12 months at $400/month. Here's our pipeline, our CAC, and our conversion rate." Then show SAM: "With Series A funding, we expand to 5,000 clinics by adding two new regions and a mid-market sales team." Finally, TAM: "There are 75,000 clinics in the US. Here's the product roadmap that makes us relevant to all of them."
This SOM-first approach works because it grounds your ambition in execution clarity. VCs interpret TAM as your ambition boundary, SAM as your product-market fit boundary, and SOM as proof that you understand your own business. SOM should be backed by real numbers - CAC, pipeline velocity, conversion rates - not a percentage plucked from thin air.
The Uber example is worth revisiting. If Uber had presented its market as "the global taxi and limousine market," investors would've seen a modest, slow-growth opportunity. Instead, Uber framed it around the total value of personal transportation - a much larger number grounded in value theory, not historical spend. Your pitch deck should do the same: show the methodology, not just the number.
As one VC framework puts it, if your market sizing numbers don't hold up, "the rest of your pitch deck starts to wobble." Replace the pyramid with a ladder, and annotate each rung with the resources and milestones required to climb it.
Sanity-Check Your Numbers
Before you finalize anything, run your SOM through these benchmarks. We've reviewed hundreds of pitch decks, and the TAM slide is where most founders lose credibility - usually because the numbers downstream don't survive basic arithmetic.
Growth rate reality. The median growth rate for private B2B SaaS companies is 25%, down from 30% in 2023. And 6.9% reported flat or negative growth in the most recent reporting period. If your SOM implies 100%+ year-over-year growth, you need extraordinary evidence.
Conversion rate floor. The average conversion rate across 14 industries is 2.9%, based on 100M+ data points. If your SOM model assumes 10% conversion from lead to customer, you're either in a very warm market or you're fooling yourself.
Acquisition cost inputs. Google Ads CTR averages 6.66% across 16,000+ campaigns, and CPC increased for 87% of industries last year. If your SOM depends on paid acquisition, model the actual unit economics - don't just assume leads will appear.
Net revenue retention. SaaS Capital's benchmarks show that moving NRR from 90-100% to 100-110% is associated with roughly 5 percentage points of additional growth. If your TAM expansion story depends on upselling existing customers, your NRR had better support it.
Your SOM is only as credible as the accounts you can actually reach. Prospeo delivers 98% verified email accuracy and 125M+ direct dials so every account in your serviceable obtainable market has a real contact attached - not just a company name on a spreadsheet. At $0.01 per email, sizing and activating your market costs less than a single analyst report.
Turn your TAM spreadsheet into a pipeline you can actually close.
FAQ
What's a good TAM size for investors?
Most VCs want to see at least $1B for venture-scale returns, but size alone doesn't close the deal. A well-defended $500M TAM built bottom-up beats a hand-wavy $10B number from a Gartner report every time. Credibility of methodology matters more than the final figure.
TAM vs market size - what's the difference?
Market size usually refers to current revenue being spent in a category - the vended market. Total addressable market is broader: it includes all potential revenue, even from customers who aren't buying yet. The cybersecurity example makes this concrete - $150B vended market versus $1.5-2T in TAM.
How often should you update your TAM?
At minimum annually, or whenever you change pricing, expand to new segments, or enter new geographies. Markets shift faster than most models assume, and static TAM models decay quickly. Quarterly reviews are ideal for high-growth startups.
Can I calculate TAM without expensive research reports?
Yes. Free sources like the US Census Bureau, BLS, and SEC filings cover most B2B market sizing exercises. For account-level counts, a B2B database with filters for industry, headcount, and geography gives you a precise denominator at a fraction of the cost of traditional analyst reports.