Total Addressable Market Size: How to Calculate TAM (2026)
Your TAM slide is probably the one investors skip. That's not a guess - it's a pattern. As one investor put it on r/startups: "Your total addressable market size in your pitch deck is wrong. Investors don't buy it. They skip that page." Meanwhile, founders on r/ProductMarketing describe their own TAM work as "wishy-washy" and "flimsy" the moment they leave sectors with published analyst research.
Here's the contrarian truth: TAM is simultaneously the most important and most useless number in business planning. Its value isn't the number itself - it's the rigor of the process. A $50M TAM built bottom-up from real account data is more fundable than a $10B number pulled from a Gartner headline.
TAM is the total revenue opportunity if you captured 100% of your market - a theoretical ceiling, not a forecast. Three methods exist: top-down (fast, least credible), bottom-up (most credible), and value theory (for category creators). Use bottom-up as your primary method, validate with top-down, and triangulate. Investors want bottom-up math with real account counts, not "1% of a $100B market."
What Is Total Addressable Market?
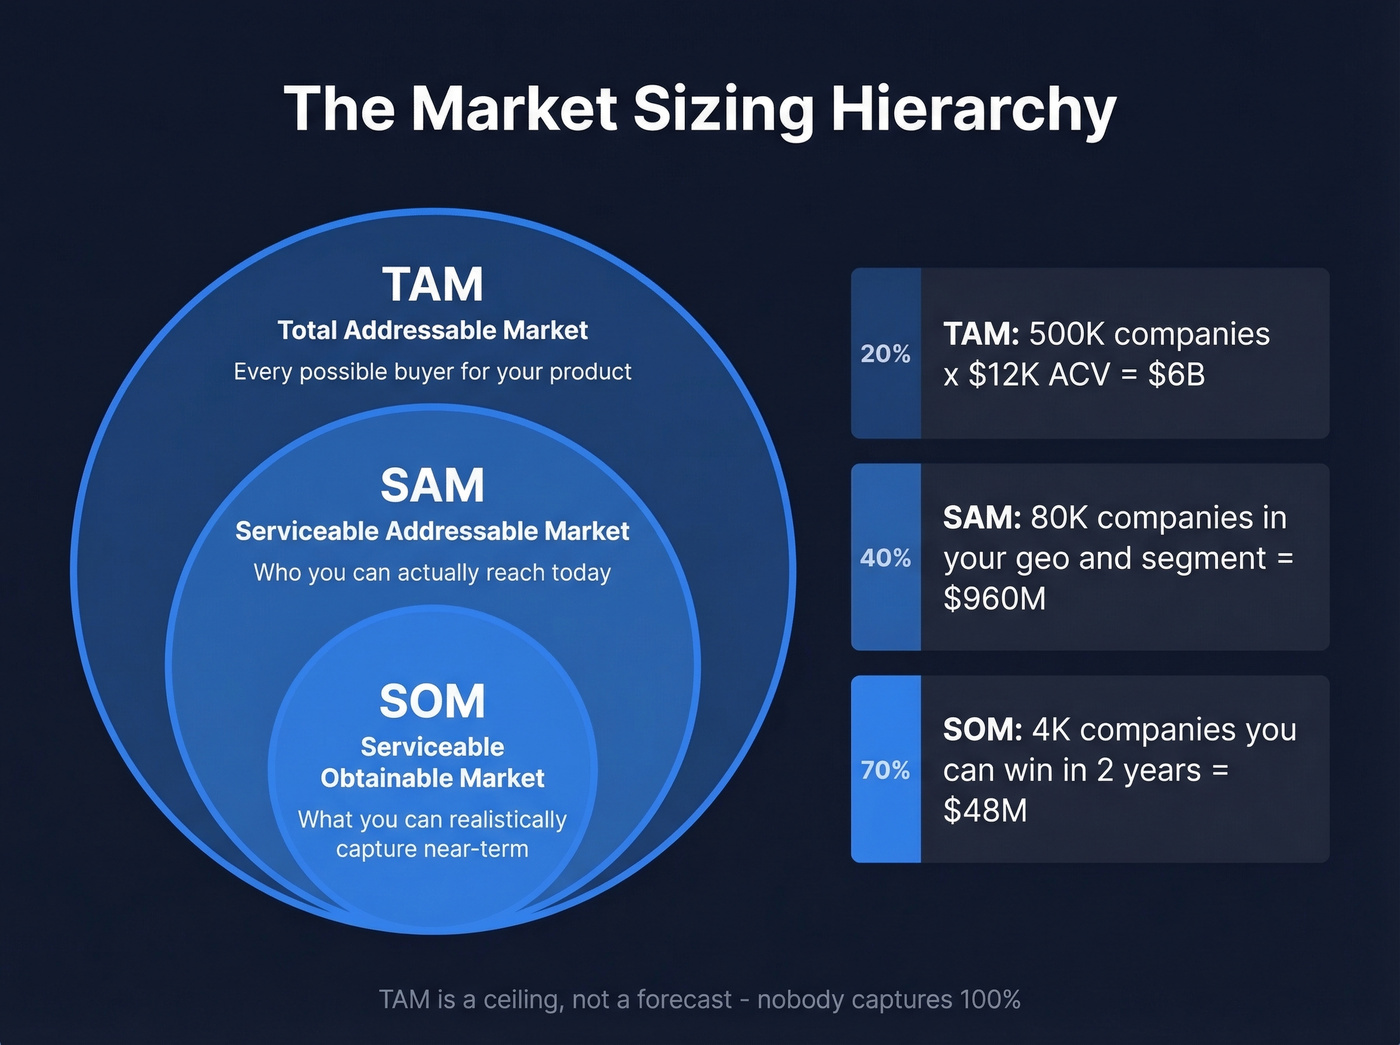
Total addressable market size is the maximum revenue available to you if every possible buyer purchased your product. It's a theoretical ceiling - useful for framing opportunity, useless as a forecast. Nobody captures 100% of anything.
Understanding the distinction between market size and TAM matters: "market size" often refers to current spending in a category, while TAM represents the full revenue opportunity if every potential customer adopted your solution. They're related but not interchangeable, and mixing them up in a pitch is a fast way to get follow-up questions you can't answer.
TAM sits at the top of a three-layer hierarchy. TAM is the entire market. SAM (Serviceable Addressable Market) is the slice you can actually reach with your current product, pricing, and distribution. SOM (Serviceable Obtainable Market) is the portion you can realistically capture in the near term given competition, resources, and go-to-market motion.
For most B2B companies, TAM = number of potential customers x annual contract value (ACV) or average revenue per user (ARPU). The hard part isn't the formula. It's getting an honest count of potential customers and an honest ACV - which is where most people start making things up.
Why TAM Matters Beyond the Pitch Deck
TAM isn't just a fundraising exercise. It drives real operational decisions:
- Territory design - each rep's territory needs enough addressable opportunity to hit quota
- Quota setting - quotas without market sizing context are essentially arbitrary
- Account prioritization - focus effort on segments with the biggest potential and best fit
- White space analysis - identify segments where you have low penetration and room to grow
For fundraising, VCs typically look for $1B+ addressable markets in software and tech. Matrix Partners has called TAM slides "among the most frequently mis-executed" in pitch decks, and the fastest way to lose the room is to show a market that doesn't exist the way you think it does.
Let's be honest, though: if your deal sizes hover around $8K and you're selling to SMBs, you probably don't need a $1B TAM to build a great business. You need a $100M TAM you can dominate. VCs want billion-dollar markets because their model requires it - your model might not.
Three Ways to Calculate TAM
Top-Down (Start With the Market)
Start with a broad industry number from an analyst report - say, "the global CRM market is $80B" - then narrow by geography, segment, and product fit. It's the fastest method and the least credible. You're trusting that the analyst's definition matches yours and that their methodology is sound.
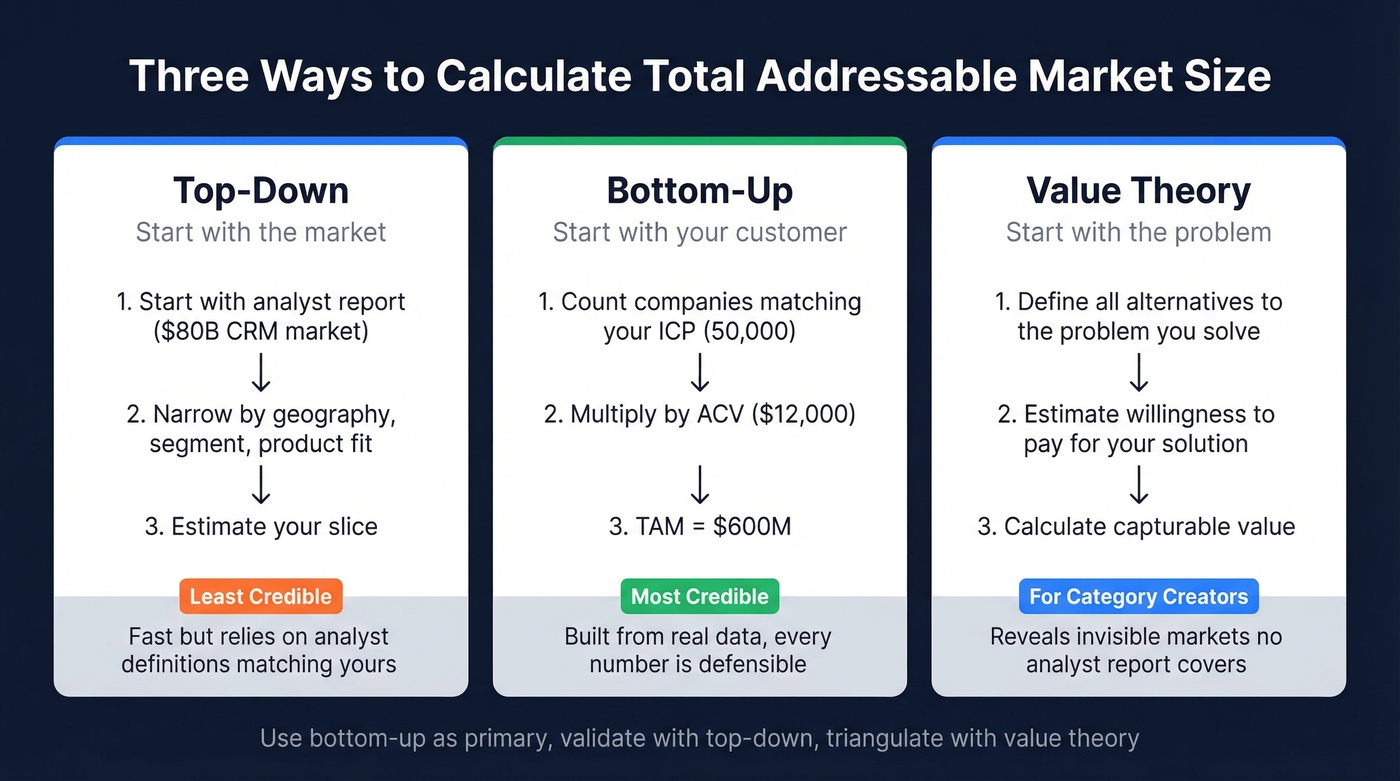
Use top-down to sanity-check your bottom-up number, not as your primary estimate.
Bottom-Up (Start With Your Customer)
This is the method that earns credibility. You count the actual companies or people who could buy your product, then multiply by what they'd pay.
Say you sell compliance software to mid-market financial services firms in North America. You identify 50,000 companies matching your ICP (financial services, 100-5,000 employees, US and Canada). Your ACV is $12,000. That's 50,000 x $12,000 = $600M TAM. Every number in that equation is defensible because it's built from real data, not analyst abstractions.
A founder on r/startups framed it simply: target users x realistic price x time. They used 10,000 x $100 x 12 months = $12M TAM. Small, specific, and believable.
Value Theory (Start With the Problem)
This method works when you're creating a category rather than entering one. Instead of sizing an existing market, you define all the alternatives to the problem you solve, estimate willingness to pay for your solution, and calculate the capturable value.
Value theory works both ways. It can reveal a TAM far larger than existing markets suggest, but it can also shrink one. Uber expanded the taxi TAM by pulling demand from walking, transit, and personal driving. Wikipedia collapsed the encyclopedia TAM from billions to near-zero.
Index Ventures' Jahanvi Sardana calls these "invisible markets" - TAM that doesn't show up in any analyst report because the category doesn't exist yet.
Real-World TAM Examples
Uber's invisible market. In June 2014, Aswath Damodaran argued that if you size Uber like a taxi company, you end up with a much smaller ceiling - including an estimate of Uber's terminal value at no more than $6B. He wasn't wrong about taxis. He was wrong about the market. Uber didn't just replace cab rides - it pulled demand from walking, public transit, biking, and personal driving. By early 2025, Uber was profitable on a $48B annual revenue run rate with a $167B market cap. The value theory approach - what are all the alternatives to getting from A to B, and what share of that value can we capture? - is the only one that would've gotten close.
Airbnb's layered TAM. Their S-1 filing broke the addressable market into three layers: $1.8T in short-term stays, $210B in longer-term stays, and $1.4T in experiences - totaling $3.4T. Enormous, but built from identifiable spending categories. The breakdown gave investors something to evaluate rather than a single headline figure to dismiss.
Zoom's land-and-expand. They didn't start by claiming the entire video conferencing market. They started with tech companies - a narrow, reachable segment - and expanded from there. The TAM grew as the product proved itself in adjacent segments. This framing is far more persuasive than claiming the whole market on day one.
Your bottom-up TAM is only as credible as your account count. Prospeo's B2B database lets you filter 300M+ profiles by industry, headcount, revenue, funding, technographics, and 30+ other criteria - so you get a defensible ICP count, not a guess. At $0.01 per email, sizing your market costs less than the coffee you'll drink doing it.
Build your TAM from real account data, not analyst abstractions.
Building a Bottom-Up TAM
The bottom-up method is only as good as your data. We've seen founders spend weeks on TAM analysis and still present a number they can't defend - usually because they guessed at the company count. Here's the workflow that fixes that.
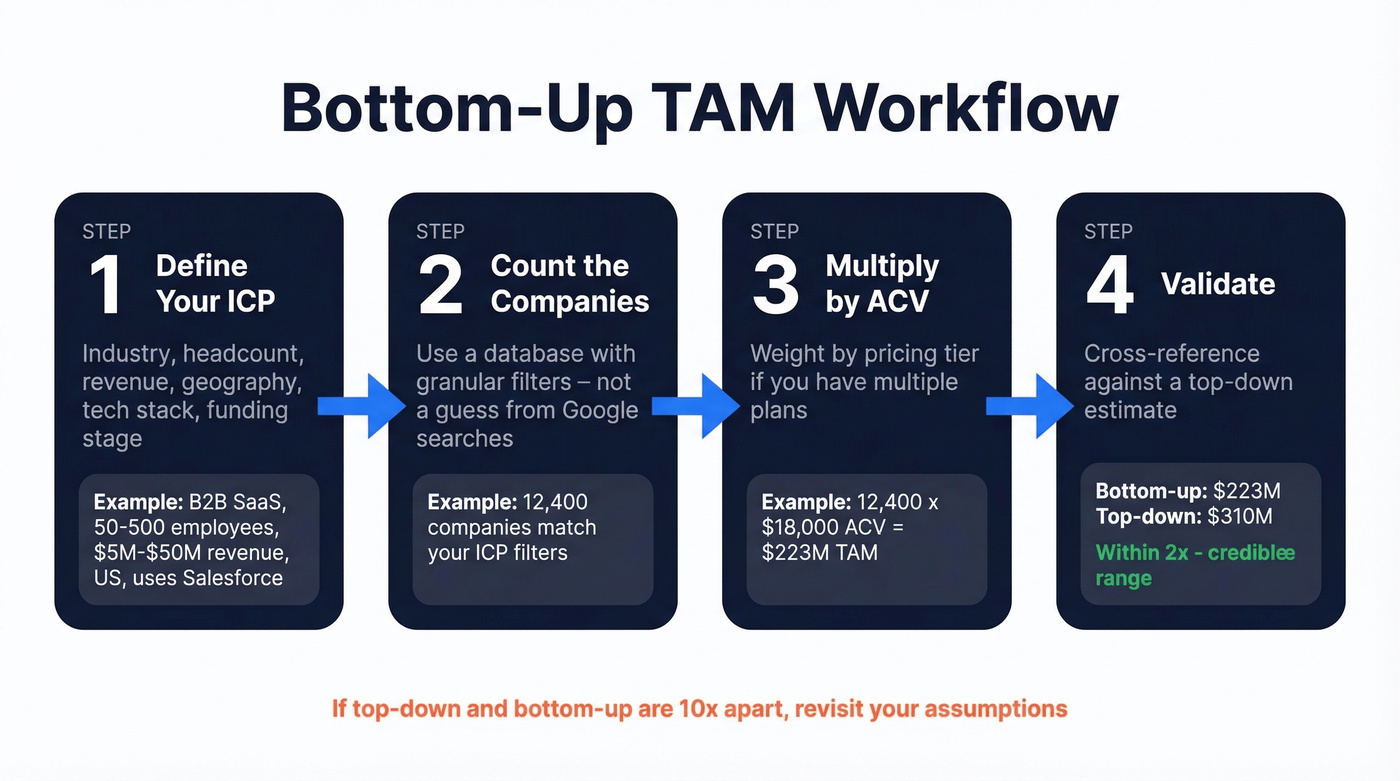
Step 1: Define your ICP. Industry, headcount range, revenue range, geography, tech stack, funding stage, or growth signals. "B2B SaaS companies, 50-500 employees, $5M-$50M revenue, US-based, using Salesforce" is an ICP. "Mid-market SaaS companies" is not.
Step 2: Count the companies. This is where most people guess, and where the whole exercise falls apart. You need a database with granular filters. Prospeo's B2B database covers 300M+ professional profiles with 30+ search filters - industry, headcount, revenue, tech stack, geography, buyer intent across 15,000 topics. Filter to your ICP, export the count, and you've got a defensible denominator instead of a number you pulled from thin air.

Step 3: Multiply by ACV. Take your company count and multiply by your average annual contract value. If you have tiered pricing, weight by segment - don't just use one number across all tiers, because that's how you end up with a TAM that's either wildly inflated or suspiciously small.
Step 4: Validate. Cross-reference against a top-down estimate. If they're within 2-3x of each other, you're in a credible range. If they're 10x apart, revisit your assumptions.
Once you've sized your TAM, the next step is reaching it. Prospeo gives you verified emails (98% accuracy) and direct dials (125M+ mobiles) for every account in your serviceable market - with intent data across 15,000 topics to show which accounts are actually in-market right now.
Turn your TAM slide into a pipeline with contacts you can actually reach.
TAM Mistakes That Kill Credibility
The "1% of a huge market" argument. The single fastest way to lose an investor. It proves you haven't done the work.
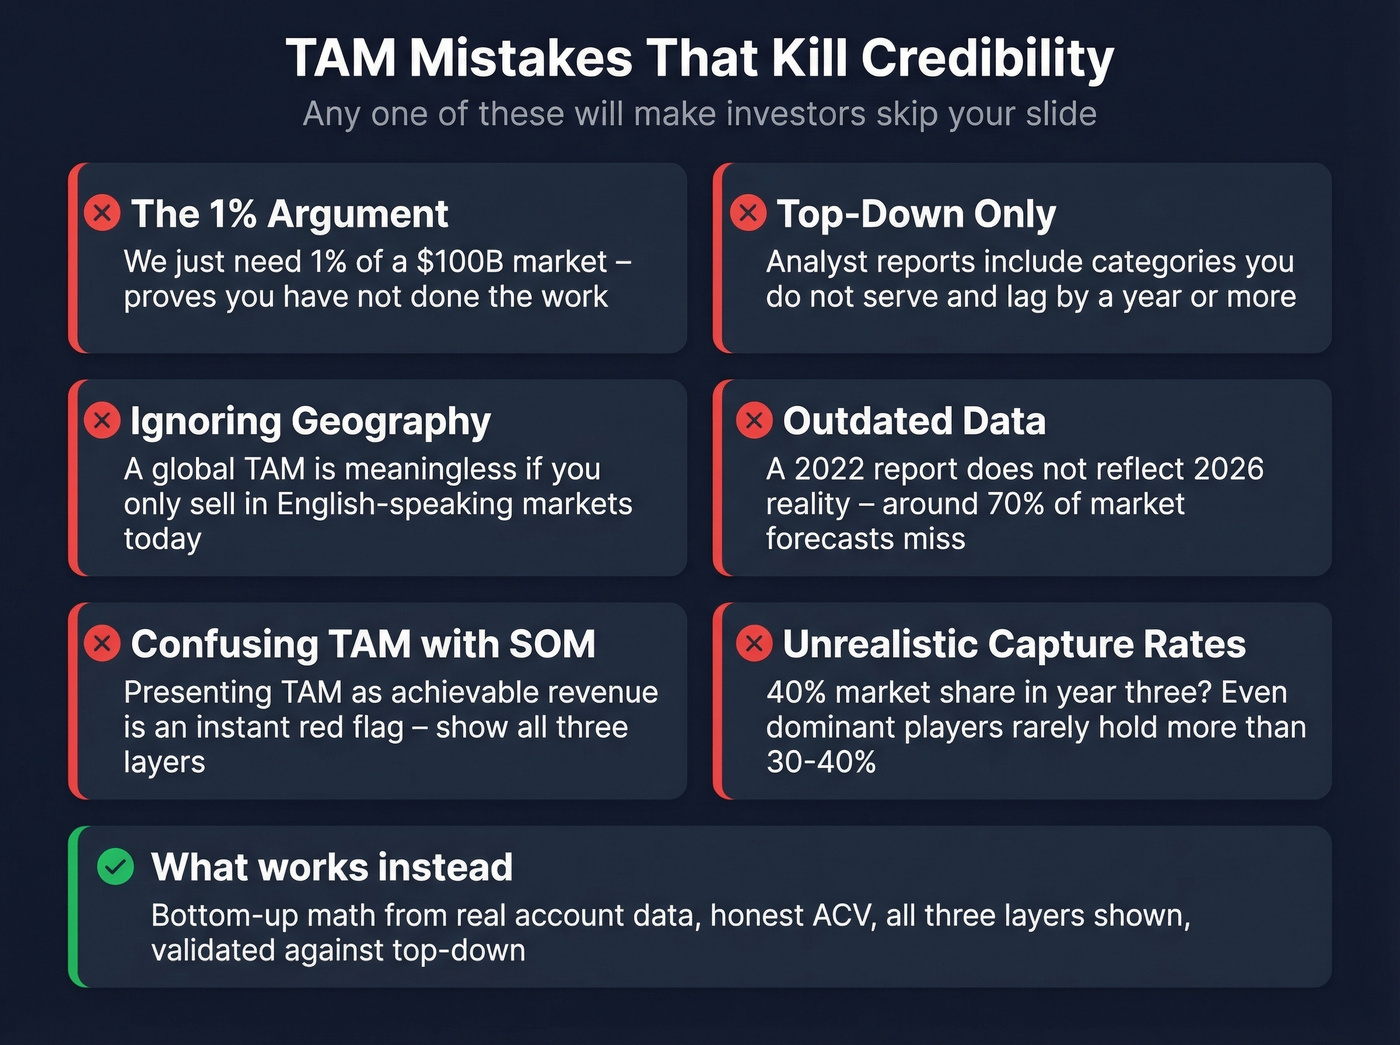
Over-relying on top-down analysis. Analyst reports often include adjacent categories you don't serve and lag the market by a year or more.
Ignoring geographic restrictions. Legislation, logistics, language, and local competition all shrink your real market. A "global TAM" is meaningless if you only sell in English-speaking markets today.
Using outdated data. A 2022 report doesn't reflect 2026 reality. Around 70% of market forecasts miss the mark, especially in tech. Stale data produces stale conclusions.
Confusing TAM, SAM, and SOM. Presenting TAM as if it's your achievable revenue is a red flag. Show all three layers. (If you need a refresher on definitions, see our addressable market breakdown.)
Assuming unrealistic capture rates. If your financial projections imply you'll capture 40% of TAM in year three, you've lost the room. Even dominant players in mature markets rarely hold more than 30-40% share.
Averaging two bad estimates. One founder on r/startups described combining a competitor-derived estimate with a paid research number and dividing by two. That's not triangulation - it's hoping the errors cancel out.
Tools for TAM Research
| Tool | Best For | Pricing |
|---|---|---|
| Prospeo | Bottom-up B2B sizing with 30+ filters and intent data | Free tier; ~$0.01/lead |
| Crunchbase | Company discovery + funding data | From ~$49/mo |
| Statista | Industry market reports | From ~$79/mo |
| SimilarWeb | Digital traffic + market share | Free tier; enterprise $10K+/yr |
| PitchBook | Deep VC, M&A, and market data | ~$20K-50K+/yr |
| CB Insights | Market intelligence + trends | ~$30K-60K+/yr |
| Gartner | Analyst reports + forecasts | $30K+/yr |
For most B2B companies, the bottom-up approach matters most - and that means you need real company counts, not a headline number. The enterprise tools are worth it for board-level presentations, but skip them if you're doing a straightforward sizing exercise for a Series A deck.
Industry TAM Benchmarks (2026)
These figures reflect the most recent published data with forward projections:
| Industry | 2025 TAM | Projected TAM | CAGR | Source |
|---|---|---|---|---|
| SaaS (Global) | $315.68B | $1,482.44B by 2034 | 18.7% | Fortune Business Insights |
| SaaS (North America) | ~$148B (46.9% share) | - | - | Fortune Business Insights |
These benchmarks serve as anchors for your own TAM calculation. If your B2B SaaS number comes out to 10x the entire global SaaS market, something's wrong with your assumptions. If it's a tiny fraction, that's fine - but make sure you can articulate the expansion path. Check Vena Solutions' SaaS statistics or Fortune Business Insights for the latest numbers when building your deck.
FAQ
What's a good TAM for a startup?
VCs typically expect $1B+ for software, but a $50M TAM built bottom-up from real account data is more fundable than a $10B number pulled from a headline. For niche B2B products, $100M-$500M can still attract serious funding if you demonstrate a clear path to market leadership.
How often should you update your TAM?
At minimum annually, or whenever you enter a new segment, change pricing, or expand geographically. Markets shift constantly - treat your TAM as a living number, not a one-time slide you build and forget.
What's the fastest way to build a bottom-up TAM?
Use a B2B database with granular filters. Define your ICP, pull the company count, multiply by ACV, and validate against a top-down estimate. In our experience, what used to take weeks of manual research now takes an afternoon with the right tooling.
How is total addressable market size different from SAM?
TAM represents the full revenue opportunity if every possible buyer purchased your product. SAM narrows that to the segment you can actually serve with your current product, pricing, and distribution. Most investors want to see both - TAM for the ceiling, SAM for the realistic opportunity.