Total Available Market: The Practitioner's Guide to Calculating TAM That Investors Believe
It's Friday. The pitch deck is due Monday. You're staring at a blank TAM slide, wondering whether to type "$5B" or "$50B" - and whether anyone in the room will believe either number. Here's the uncomfortable truth: most total available market estimates are wrong, and everyone knows it. Founders on Reddit call TAM "fiction." Investors skip the slide entirely. The number still matters - but only if you build it right.
The quick version:
- TAM = every possible dollar if you had 100% market share. It's a ceiling, not a forecast.
- Bottom-up is the method investors take seriously. Top-down is a sanity check. Value theory is for category creators.
- A TAM number on a slide is useless unless it connects to a countable list of accounts you can actually reach. If you can't name the companies, you don't have a TAM - you have a guess.
What Does Total Available Market Mean?
Total available market (TAM) - also called total addressable market, the terms are completely interchangeable - is the total revenue opportunity available if your product achieved 100% market share. No competition, no distribution constraints, no pricing friction. Just the theoretical maximum.
It's the absolute ceiling of demand for what you sell. You'll occasionally see "Potential Active Use" or PAU in academic contexts, but TAM is the standard in pitch decks and S-1 filings.
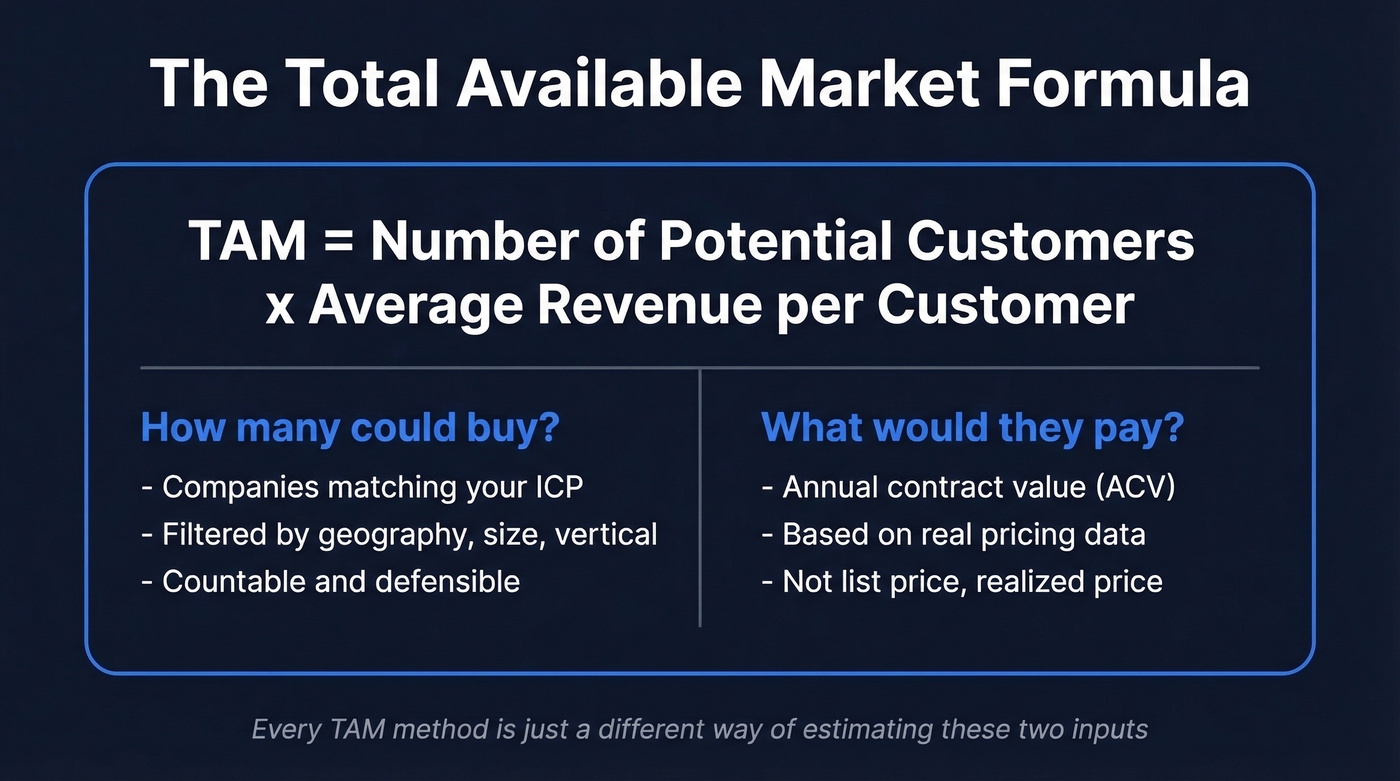
The core formula:
TAM = Number of potential customers x Average revenue per customer (ACV or ARPU)
Every method of calculating TAM is just a different way of arriving at those two inputs. The disagreements - and there are many - come down to how you define "potential customer" and what price you assign.
Think of TAM as the outermost ring of a target: the entire universe of people or companies who could theoretically buy what you sell. Not a forecast. Not a goal. The boundary condition that tells investors whether the opportunity is large enough to justify the risk. Most founders treat TAM like a marketing number, something impressive to put on a slide. Investors treat it as an analytical input. They want the math, not the headline.
Why TAM Matters for Investors and Strategy
TAM isn't just a fundraising exercise. Misunderstanding your market is a common reason startups fail, and a rigorous market-sizing analysis is the first line of defense against building something nobody needs at a scale that doesn't exist.
Investor evaluation is the obvious one. VCs need TAM to calculate whether a startup can generate venture-scale returns. A $100M TAM can build a great business, but it won't return a $500M fund. Most VCs want to see a TAM in the billions to justify the bet. Facebook's early pitch deck included market sizing that showed the scale of the social networking opportunity - that framing helped investors see beyond a college directory, per Antler's analysis.
Then there's resource allocation. A $2B TAM with 60% concentrated in North American mid-market means your first 10 reps should be in Chicago, not Singapore. TAM drives go-to-market prioritization - when it breaks into segments, you see which slices are worth attacking first and which to defer. Beyond the total addressable opportunity, you also need to identify the subset of potential buyers who are actively aware of and seeking solutions like yours. A defensible TAM signals analytical rigor, and that credibility compounds across every investor conversation.
How to Calculate Total Available Market
Top-Down Method
Start with a broad industry number from an analyst report and narrow it to your addressable slice:
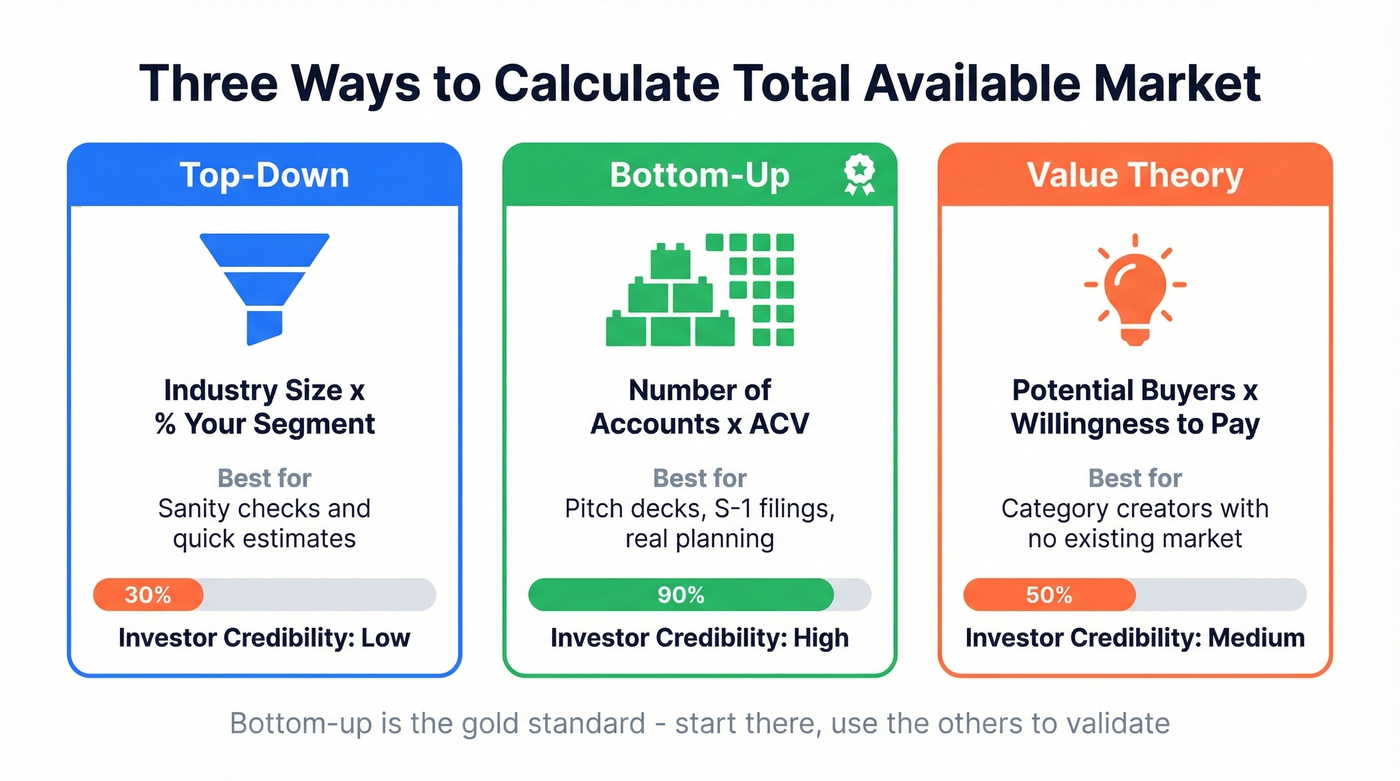
TAM = Industry market size x % relevant to your segment
The problem? Every assumption in that chain is debatable. Analyst reports disagree on base numbers. Your "relevant segment" definition is subjective. Top-down works as a sanity check - if your bottom-up number is 10x your top-down estimate, something's off - but it's not the number you put on the slide.
Bottom-Up Method
This is the method that matters. You count potential customers and multiply by what they'd pay.
TAM = Number of potential accounts x Average annual contract value (ACV)
Say you're building a compliance automation platform for mid-market SaaS companies in North America. You identify 12,000 companies that fit your ICP (50-500 employees, SaaS vertical, Series A through Series D). Your ACV based on early customers is $18,000/year.
12,000 x $18,000 = $216M TAM
That number is smaller than a top-down estimate would produce. It's also far more credible. An investor can challenge any input - "Why 12,000? Why not 8,000?" - and you can defend it with data. We've seen founders transform investor conversations by switching from "the compliance market is $47B" to "there are 12,000 mid-market SaaS companies that match our ICP, and here's the list." The second version gets follow-up meetings. The first gets polite nods.
Value Theory Method
Value theory works when your product creates a market that doesn't exist yet. Instead of counting current buyers, you estimate willingness to pay for a new category of value.
TAM = Potential buyers x Willingness to pay for the value created
Uber is the textbook example. NYU professor Aswath Damodaran estimated the global taxi and limousine market at $100B and assumed Uber might capture 10%. He was measuring the wrong market. Uber wasn't competing for existing taxi rides - it was creating new ones. By 2022, gross bookings exceeded $26.4B per quarter. The actual market was multiples of the taxi TAM.
Value theory is the right approach when you're genuinely creating demand. It's the wrong approach when you're just trying to inflate your number.
SaaS TAM - ACV vs ARR
If you're building a SaaS company, pick the right revenue metric.
ACV (Annual Contract Value) is per-account: (Total Contract Value minus one-time fees) divided by contract years. A 3-year deal worth $60,000 with a $6,000 implementation fee has an ACV of $18,000. Use ACV for bottom-up TAM calculations.
ARR (Annual Recurring Revenue) is across all accounts: MRR x 12. ARR tells you your current run-rate, not your market size. It's a company metric, not a TAM input.
The SaaS-specific pitfalls are predictable. Founders include enterprise buyers they can't realistically access (you're not selling to JPMorgan with a 4-person team). They assume global reach when they're selling in two countries. They use list price instead of actual realized ACV, which is always lower after discounts. One Reddit thread in r/SaaS is full of founders admitting they inflated TAM by 3-5x using these exact mistakes. Every one of these erodes credibility with anyone who's done the math themselves.
TAM vs SAM vs SOM (+ POM)
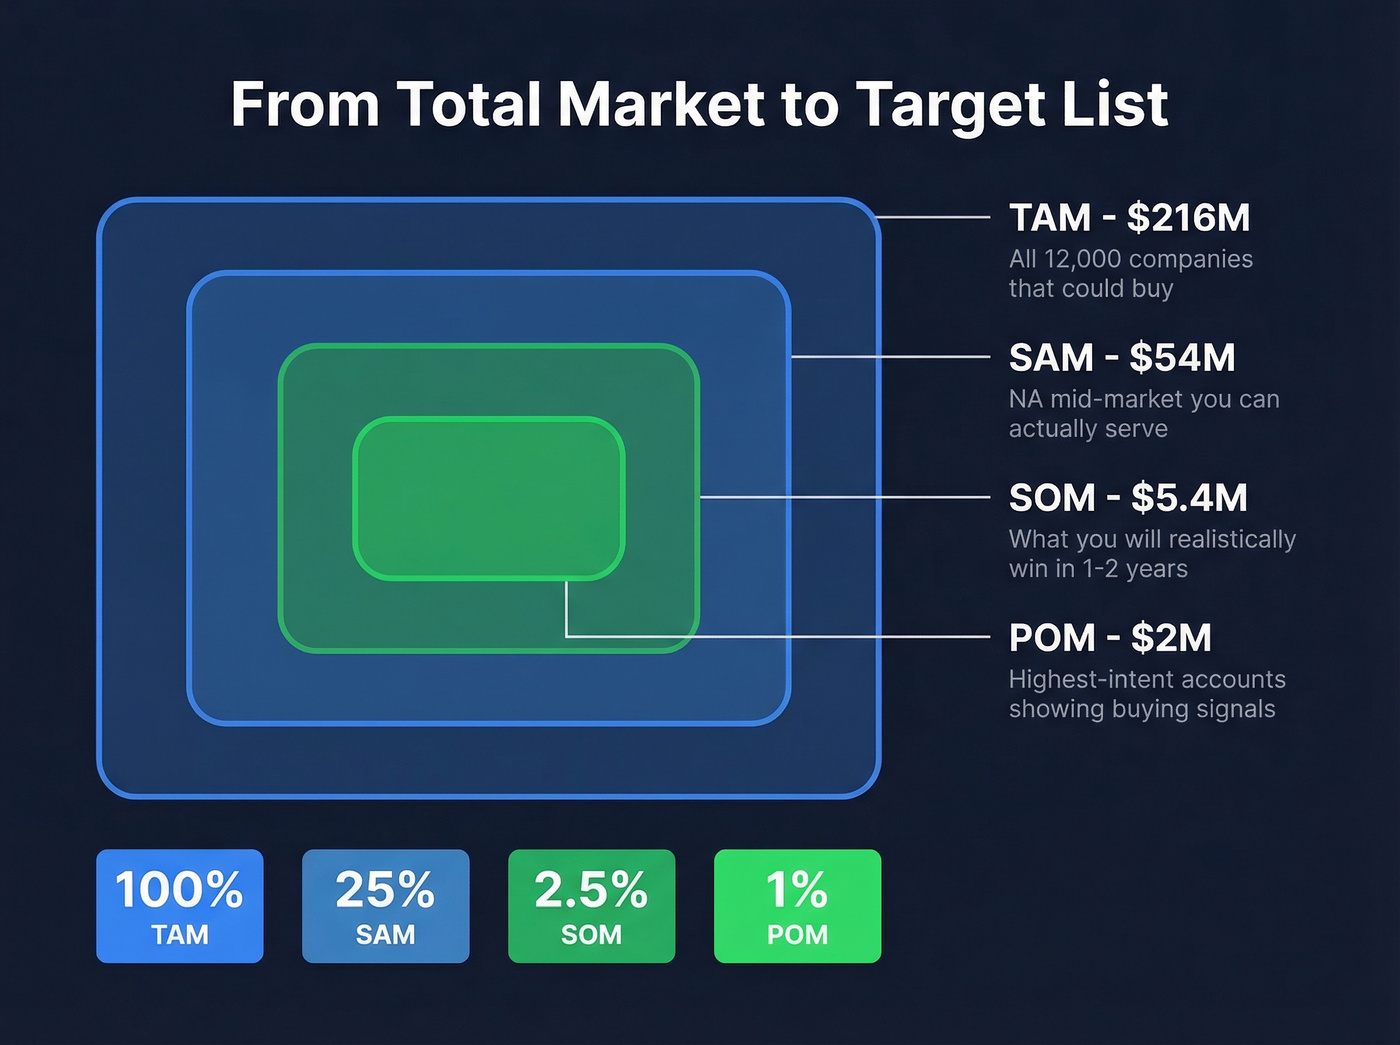
TAM is the ceiling. Investors care more about the layers beneath it. Let's carry our compliance SaaS example through all four:
| Layer | Definition | Example | Typical % of TAM |
|---|---|---|---|
| TAM | Total market at 100% share | $216M (all 12K companies) | 100% |
| SAM | Segment you can reach | $54M (NA mid-market only) | ~25% |
| SOM | What you'll win in 1-2 yrs | $5.4M (realistic penetration) | ~2-3% |
| POM | Highest-intent accounts | $2M (active buyers now) | ~1% |
SAM (Serviceable Available Market) narrows TAM to the segment you can actually serve given your current product, geography, and go-to-market. If you only sell in North America and only to mid-market, your SAM is a fraction of TAM.
SOM (Serviceable Obtainable Market) is what you'll realistically win in the near term. It factors in competition, sales capacity, and conversion rates. This is the number investors actually underwrite.
POM (Prioritized Obtainable Market) is a layer Hunter.io's framework adds below SOM - the subset where you have the highest probability of winning. Accounts showing intent signals, using complementary tech, or matching your best-customer profile. POM is where your first reps should spend their time.
One more concept worth knowing: earlyvangelists. Coined by Steve Blank, these are the customers within your POM who actively feel the pain your product solves and will champion it internally. Per Gust Debacker's analysis, identifying earlyvangelists inside your SOM is what separates founders who close their first 10 deals from those who stall at 2.
A TAM number means nothing without a countable list of accounts. Prospeo's B2B database lets you filter 300M+ profiles by 30+ criteria - headcount, funding stage, technographics, revenue - so your bottom-up TAM becomes an actual prospect list you can sell into.
Turn your TAM slide into a pipeline with real, verified contacts.
The Qualtrics S-1 - TAM Done Right
Want to see how a company justifies its market sizing in an SEC filing - where lawyers review every word? Look at Qualtrics.
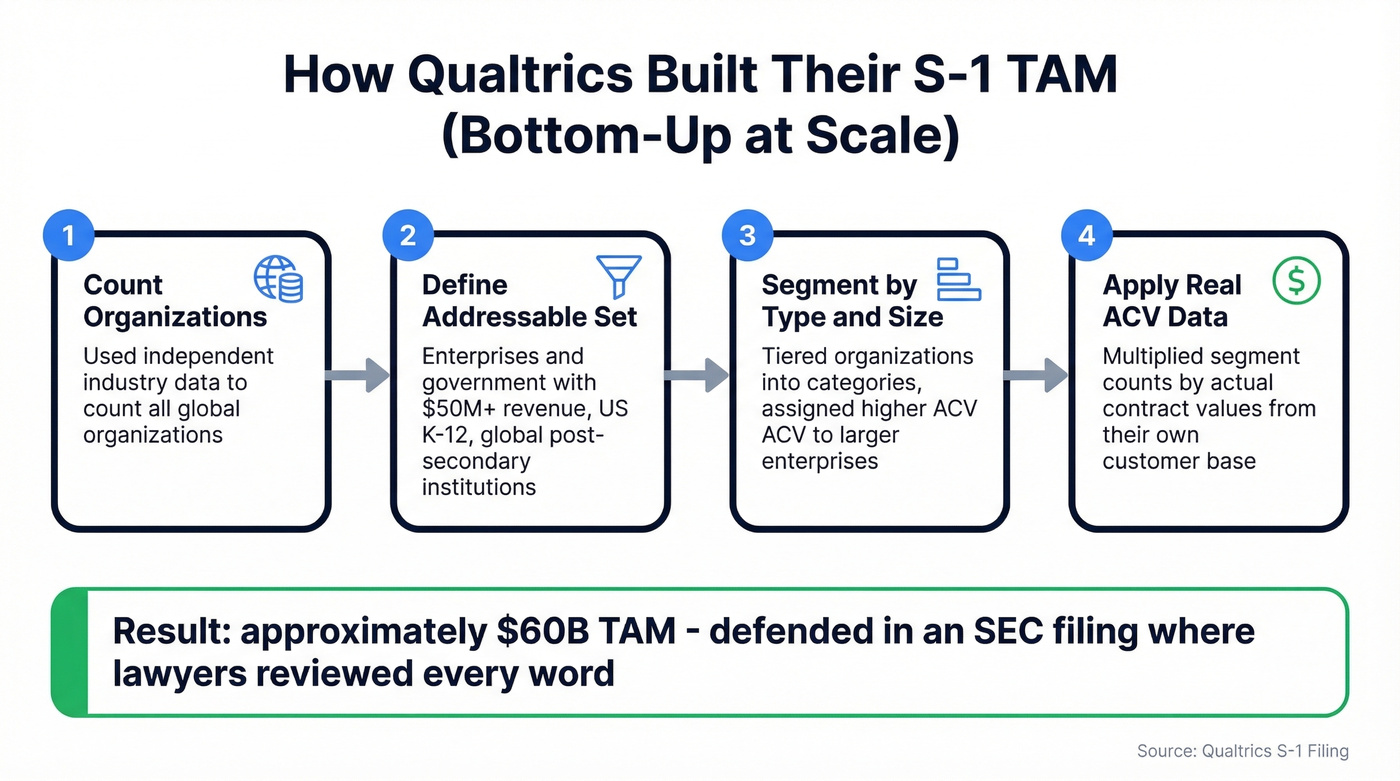
In their S-1, Qualtrics estimated a TAM of approximately $60B in 2020. They started with the total number of organizations globally from independent industry data, then defined their addressable set: global enterprises and government institutions with $50M+ annual revenue, US K-12 institutions, and global post-secondary institutions. They segmented by type and size, then applied average annual contract values from their own customer data, tiering larger enterprises higher.
This is bottom-up at scale. Real org counts, real ACV data, defensible segmentation. In our experience, the bottom-up number always survives due diligence better than the top-down one - and the Qualtrics filing proves it at the highest level of scrutiny. That's the bar your TAM should clear, even at seed stage. The methodology doesn't change. Only the data sources do.
When TAM Is Wrong - Market Expansion
Sometimes TAM is wrong not because the math is bad, but because the market itself changes.
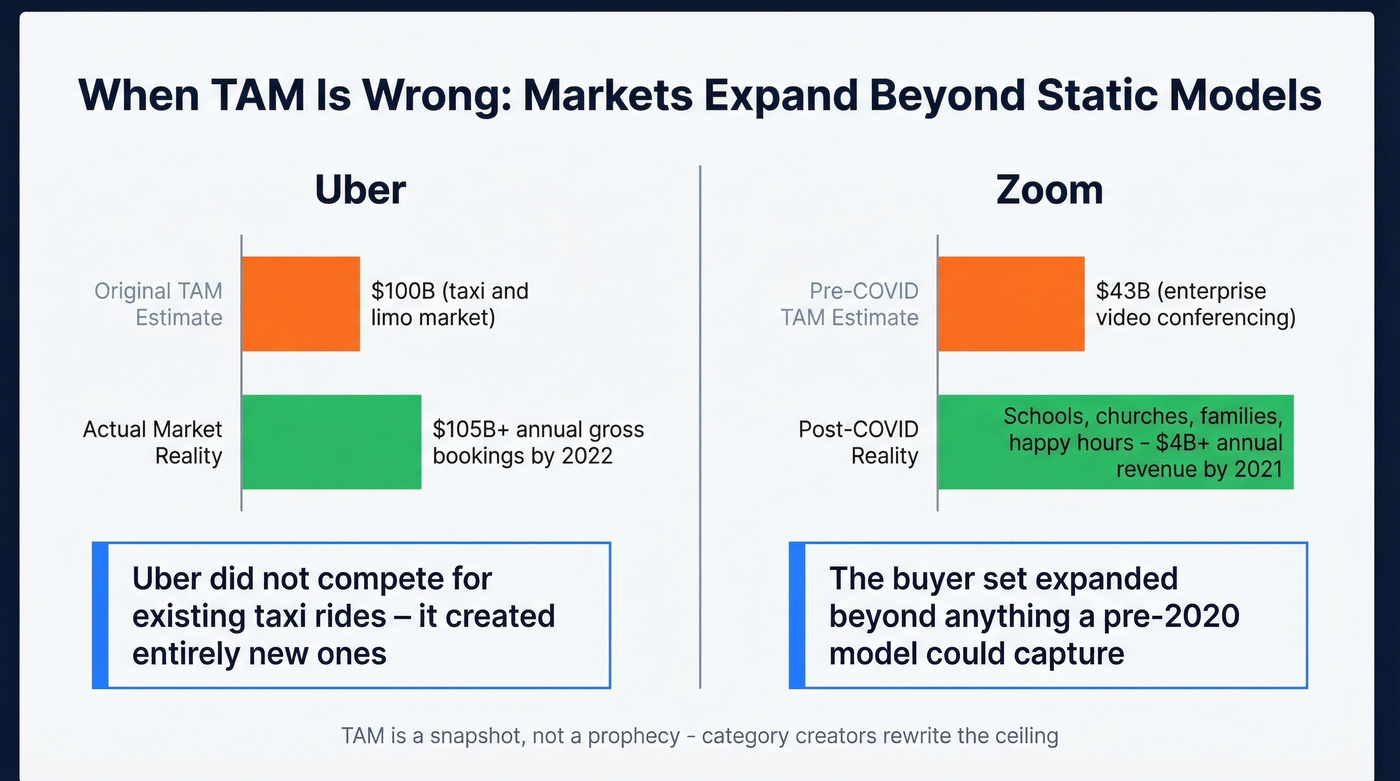
Uber is the canonical case (covered above). Zoom tells a similar story. Pre-COVID, the corporate video conferencing TAM was estimated at $43B - assuming the buyers were enterprises with conference room budgets. Then a pandemic hit, and Zoom expanded to schools, churches, family reunions, and happy hours. Annual revenue exceeded $4B by 2021. The TAM had fundamentally shifted because the buyer set expanded beyond anything a pre-2020 model could capture.
Here's a hot take: if your deal size is under $10K annually, you probably don't need a TAM slide at all - you need a SOM slide. Most seed-stage companies with low ACVs are better served showing investors 500 named accounts they can close this year than a $5B circle on a PowerPoint. TAM is a snapshot, not a prophecy. Category-creating products expand the market beyond what any static model predicts. Acknowledge this on your slide - investors respect founders who understand the difference between capturing a market and creating one.
Common Mistakes in Market Sizing
Look, we've reviewed hundreds of pitch decks, and the same errors show up over and over.
"We just need 1% of a $300B market." This is the fastest way to lose credibility with any serious investor. It signals you haven't done the work to understand your actual addressable segment.
Stacking adjacent markets to inflate the number. Your CRM doesn't also address the "marketing automation market" and the "customer data platform market" just because those categories are tangentially related.
Including enterprise buyers you can't access. If you're a 5-person startup, Fortune 500 companies aren't in your TAM. They're in your fantasy. Skip them until you have the sales infrastructure to compete at that level.
Never updating TAM. B2B data decays fast - estimates range from 22% to 70% per year depending on the segment. Companies get acquired, change industries, grow past your ICP, or shrink below it. Most teams let their TAM lists decay for months, then wonder why outbound performance craters.
Leading with top-down Gartner numbers. A $47B industry report number tells investors nothing about your specific opportunity. Start with your bottom-up account count and use the industry number as a sanity check, nothing more.
Where to Get TAM Data
You don't need a $50,000 analyst subscription to build a credible TAM.
Free Sources
| Source | What You Get |
|---|---|
| US Census Bureau | Business counts by industry, size, state (updated annually, often a couple of years behind) |
| Bureau of Labor Statistics | Roles by industry (seat-based TAM) |
| SEC EDGAR | Public company financials |
| UN Data | Global population, trade, education |
| AWS Public Datasets | 580+ datasets; Data Catalogs lists 599 open data portals |
The Census Bureau's County Business Patterns dataset is underrated. It gives you an accurate count of every business by NAICS code, employee size range, and geography. If your TAM starts with "how many companies fit this profile in the US," Census data gets you 80% of the way there for free.
Paid Sources
| Source | Best For |
|---|---|
| Gartner / IDC / Forrester | Industry-level market sizing |
| IBISWorld | NAICS-aligned industry reports |
| Crunchbase / PitchBook | Company-level data, Excel-ready |
| ZoomInfo | Firmographic and technographic filtering |
| DMDDatabases.com / NAICS Association | Pre-built market lists by SIC/NAICS code |
From TAM to a Prospecting List
Here's what most TAM guides miss entirely: a TAM number isn't a strategy. It's the starting point for one.
Once you've calculated that there are 12,000 mid-market SaaS companies in your total available market, the next question is immediate - can you name them? Can you find the VP of Engineering at each one? Do you have a verified email and direct dial for the decision-maker?
TAM is a list, not a number. The gap between "we have a $216M TAM" and "we have 12,000 accounts loaded in Salesforce with verified contacts" is where most go-to-market plans die. I've watched teams spend weeks perfecting a TAM slide, then scramble for months trying to actually build the account list it describes. The workflow to close that gap:
- Define your ICP criteria (firmographics, technographics, intent signals)
- Filter a B2B database by those criteria
- Export verified emails and direct dials
- Load into your CRM
- Start prospecting
Tools like Prospeo make this bridge concrete - 300M+ professional profiles, 30+ search filters including buyer intent across 15,000 Bombora topics, and 98% email accuracy on a 7-day refresh cycle mean you can go from "TAM slide" to "first outbound sequence" in an afternoon. A $2B TAM means nothing if you can't name 500 accounts in your first territory.
You just identified 12,000 accounts that fit your ICP. Now what? Prospeo enriches your TAM list with 98% accurate emails and verified mobile numbers - at $0.01 per email. No inflated data. No bounced outreach. Just the contacts behind your market math.
Stop sizing the market and start reaching it.
How to Build a TAM Slide Investors Actually Read
| Do This | Don't Do This |
|---|---|
| Start with bottom-up account count | Quote global market reports as TAM |
| Show real data sources | Use "1% share" logic |
| Prove initial penetration (SOM first) | Stack assumptions across markets |
| Cite specific data sources | Present one number without math |
| Include methodology footnotes | Assume investors won't check |
The investor math behind your slide works like this: if your TAM is EUR 2B, SAM is EUR 100M, and you hit EUR 5M SOM in two years with 25% EBITDA margins, an 8x EBITDA exit values the company at EUR 10M. An early investor with 20% equity on a EUR 250K check gets an 8x return. Hit EUR 12M revenue in four years, and that return jumps to 19.2x.
Investors aren't reading your TAM slide to see a big number. They're running this math in their heads. Give them the inputs - bottom-up account count, realistic ACV, defensible SOM - and let the math do the selling.
If your TAM slide doesn't show the methodology, you don't have a TAM slide. You have a wish.
FAQ
Is "total available market" the same as "total addressable market"?
Yes, completely interchangeable. TAM refers to the total revenue opportunity at 100% market share regardless of which term you use. You'll see both across pitch decks, S-1 filings, and analyst reports without any difference in meaning.
How often should you update your TAM?
Quarterly at minimum. B2B data decays 22-70% annually - companies get acquired, change verticals, and shift headcount. Treat your market sizing as a living dataset, not a one-time fundraising slide.
What's a good TAM size for seed funding?
Most VCs want to see a TAM in the billions, but a defensible $500M bottom-up number beats a hand-wavy $10B top-down estimate every time. Investors would rather see 8,000 named accounts at $60K ACV than a Gartner chart with a circle around it.
Can TAM grow after you calculate it?
Absolutely - Uber and Zoom both expanded their TAMs by creating demand that didn't previously exist. Market creation, new use cases, and geographic expansion can all push the number higher over time.
What tools help turn a TAM number into a prospecting list?
B2B data platforms let you filter millions of profiles by industry, headcount, tech stack, funding stage, and buyer intent - then export verified emails and direct dials. This bridges the gap between a TAM calculation and actual outbound execution, typically in under an hour.