3x Pipeline Coverage Is a Myth. Here's What the Data Actually Says.
It's week 3 of the quarter. Your CRO pulls up the pipeline report: 3.8x coverage. Everyone exhales. Then the quarter ends, and you miss by 18%. The pipeline was there on paper. The revenue wasn't.
That gap has a name - phantom pipeline - and it's the reason the 3x pipeline coverage rule needs to die.
The quick version:
- The 3x rule assumes a ~33% win rate. If yours is different, 3x is wrong by definition.
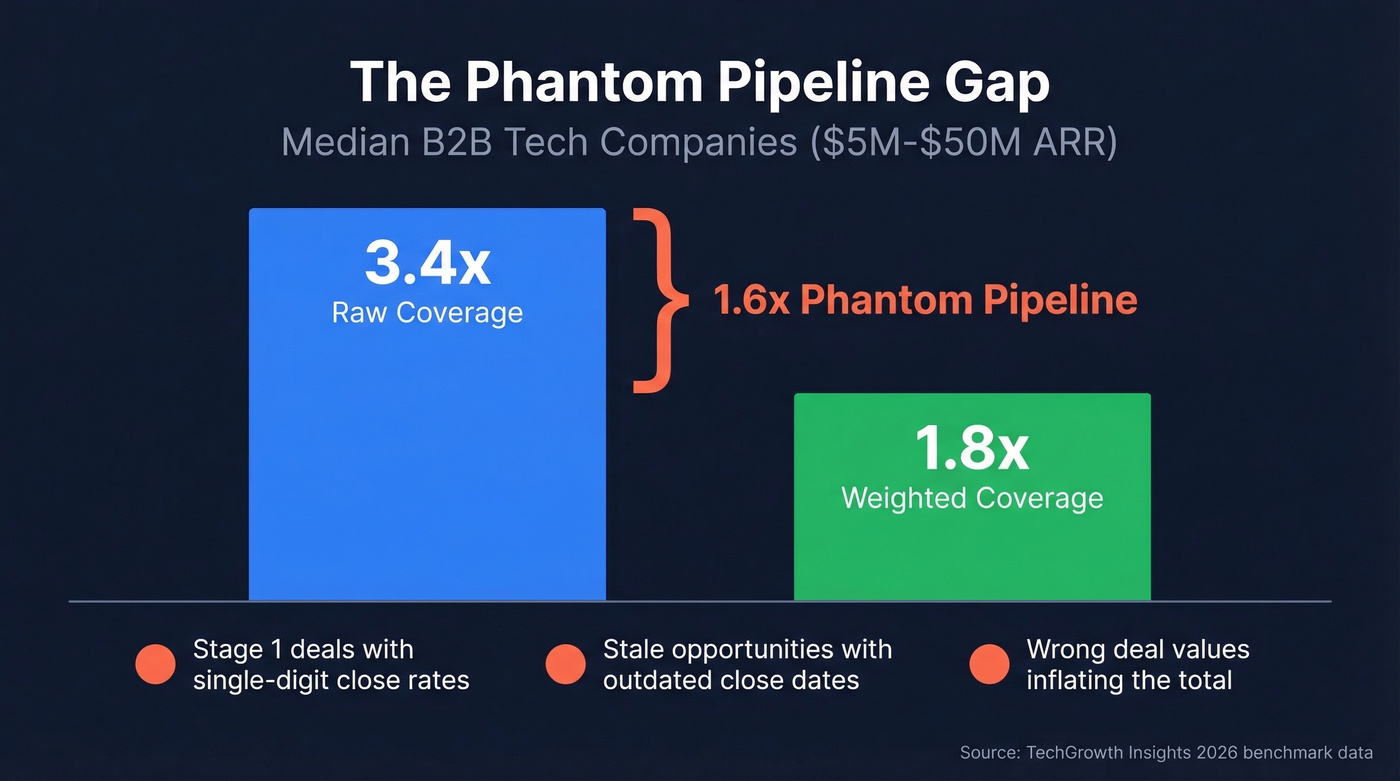
- Median raw coverage is 3.4x; median weighted coverage is 1.8x. That 1.6x gap is phantom pipeline.
- Use weighted pipeline coverage alongside raw coverage. Formula, benchmarks, and worked example below.
What Pipeline Coverage Actually Means
Pipeline coverage ratio = total pipeline value / quota. If you're carrying $250K in pipeline against a $100K target, that's 2.5x coverage. Simple division.
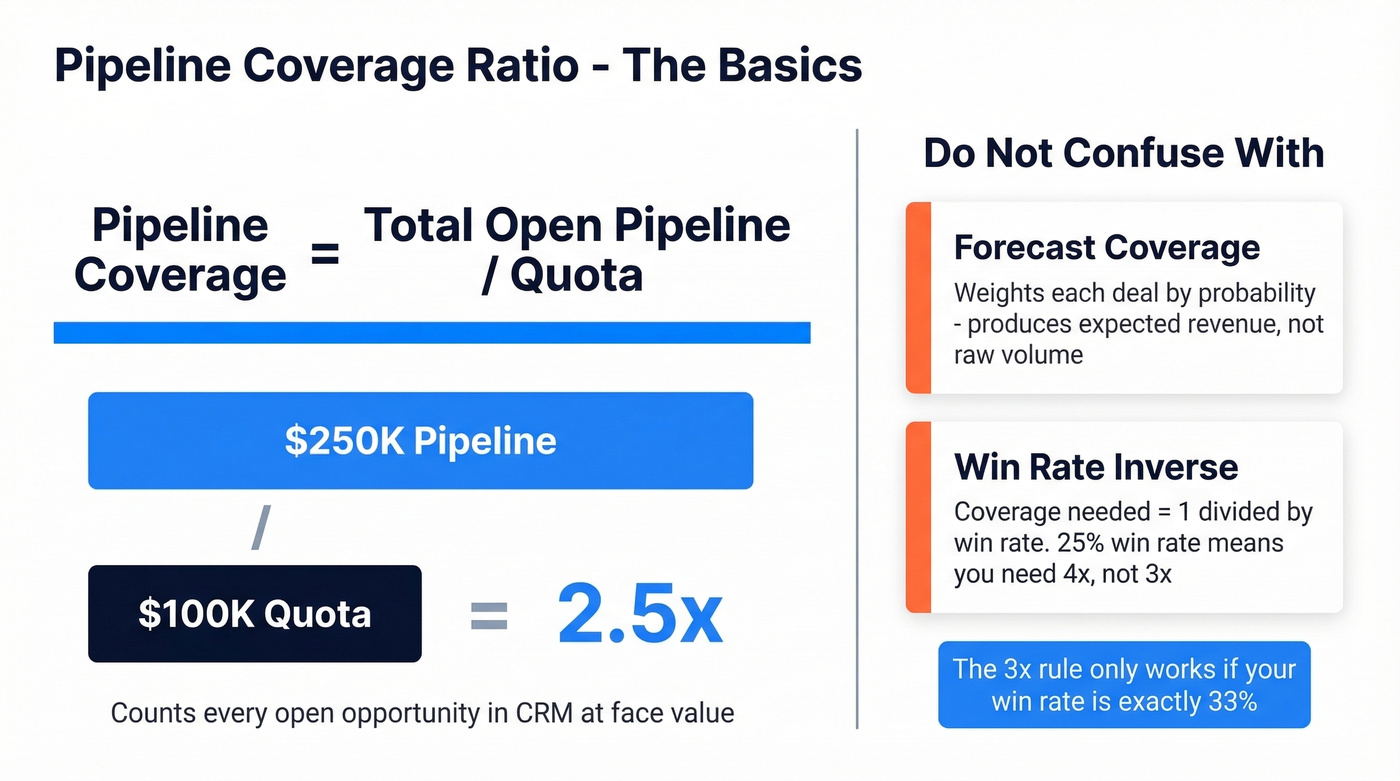
Don't confuse this with forecast coverage, which weights opportunities by probability to produce a more realistic expected outcome. Pipeline coverage is usually just "how much open pipeline do we have versus the target?" - and in many orgs it includes every open opportunity sitting in the CRM, whether it's truly qualified or not.
Why the 3x Rule Misleads Teams
The math behind the rule: coverage = 1 / win rate. A 33% win rate needs 3x. But typical B2B win rates run 20-30%. If your team closes 25%, you need 4x just to break even, and teams with complex enterprise deals or long evaluation cycles often find even that insufficient.
That's the first problem. The second is worse.
For B2B tech companies in the $5M-$50M range, median raw coverage is 3.4x while median weighted coverage is just 1.8x. The 1.6x difference is phantom pipeline - deals sitting in Stage 1 with single-digit close probabilities, inflating your board deck. One sales leader managing 150 reps put it bluntly on r/sales: their pipeline was "realistically inflated by about 60%" due to wrong values, outdated info, and stale close dates.
Here's what we've found useful - practical benchmark ranges by segment instead of a single magic number:
| Segment | Typical Raw Coverage | Why |
|---|---|---|
| Enterprise | 3-5x | Long cycles, low win rates (some teams target 5x) |
| Mid-market | 2.5-4x | Moderate complexity |
| SMB | 2-3x | Short cycles, higher win rates |
Unweighted coverage is a vanity metric. Stop reporting it to your board without the weighted number next to it.
Phantom pipeline starts with phantom contacts. If your coverage ratio looks healthy but quarters keep missing, bad data is inflating your numbers. Prospeo's 98% email accuracy and 7-day refresh cycle mean every deal in your CRM is backed by a reachable contact - not a bounced email masquerading as pipeline.
Meritt cut bounce rates from 35% to under 4% and tripled real pipeline.
How to Calculate Your Real Coverage Ratio
Start with stage-based close probabilities. Use your own CRM data if you have it, but here are solid benchmarks:
| Stage | Close Probability |
|---|---|
| Initial Qualification | 8% |
| Discovery Complete | 22% |
| Proposal / Evaluation | 45% |
| Negotiation | 72% |
| Verbal Commit | 88% |
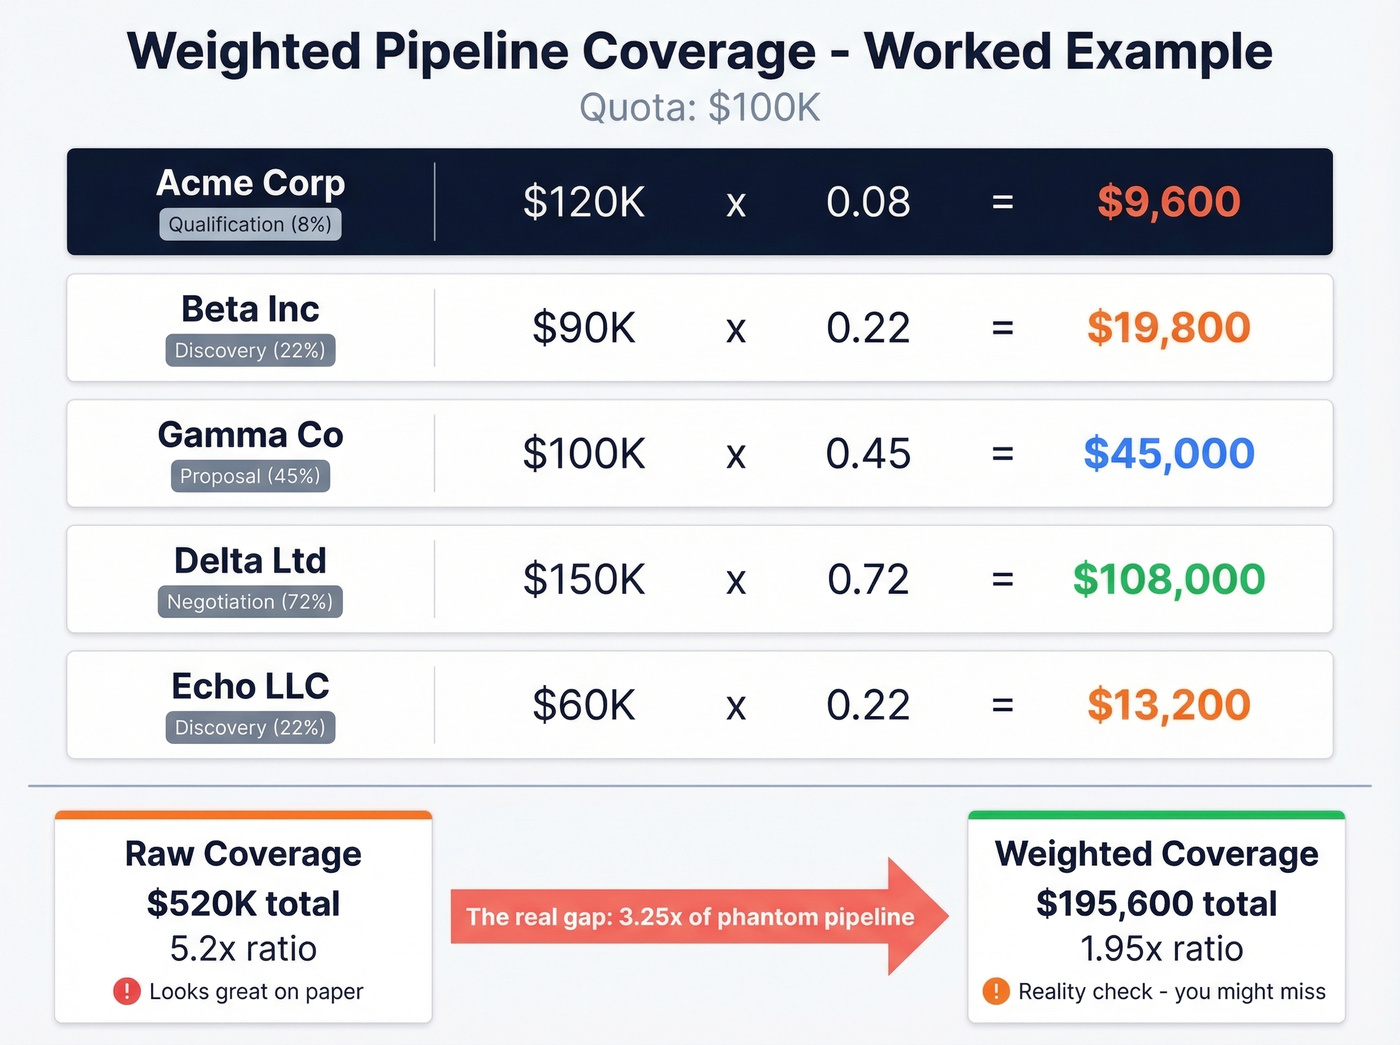
Worked example - five deals against a $100K quota:
| Deal | Stage | Value | Weighted Value |
|---|---|---|---|
| Acme Corp | Qualification | $120K | $9,600 |
| Beta Inc | Discovery | $90K | $19,800 |
| Gamma Co | Proposal | $100K | $45,000 |
| Delta Ltd | Negotiation | $150K | $108,000 |
| Echo LLC | Discovery | $60K | $13,200 |
Raw total: $520K - that's 5.2x coverage. Weighted total: $195,600 - roughly 1.95x coverage. The 5.2x figure was a fantasy, and chasing inflated coverage without weighting it only encourages reps to stuff the funnel with unqualified deals.
One more filter: time. If your median sales cycle is 84 days and a deal entered the pipeline last week, it mathematically can't close this quarter. Strip those out. Even weighted pipeline misleads if deals can't close within the measurement period.
What Your Coverage Ratio Is Actually Telling You
Dave Kellogg's week-3 snapshot methodology is the measurement standard: take your pipeline reading in week 3 of the quarter, when it's late enough to be real but early enough to act on. As one practitioner framed it on r/SaaS, "if pipeline drops below 3x your target revenue, you're going to miss quarters 2-3 months from now."
If you consistently need >3x coverage to hit plan, Kellogg's diagnosis is blunt: you likely have unscrubbed pipeline full of junk, a win-rate problem masquerading as a volume problem, or reps squatting on accounts they'll never close. Arbitrary coverage targets create a perverse incentive - reps stuff pipeline to hit the number, which is the exact opposite of what the metric is supposed to measure. The common term for this is "waterlogging," and in our experience, it's the single biggest reason coverage ratios lie.
Let's be honest: if your deals average under $25K, you probably don't need to obsess over coverage ratios at all. Velocity matters more than volume at that price point. But if you do track coverage, these three metrics together tell you almost everything:
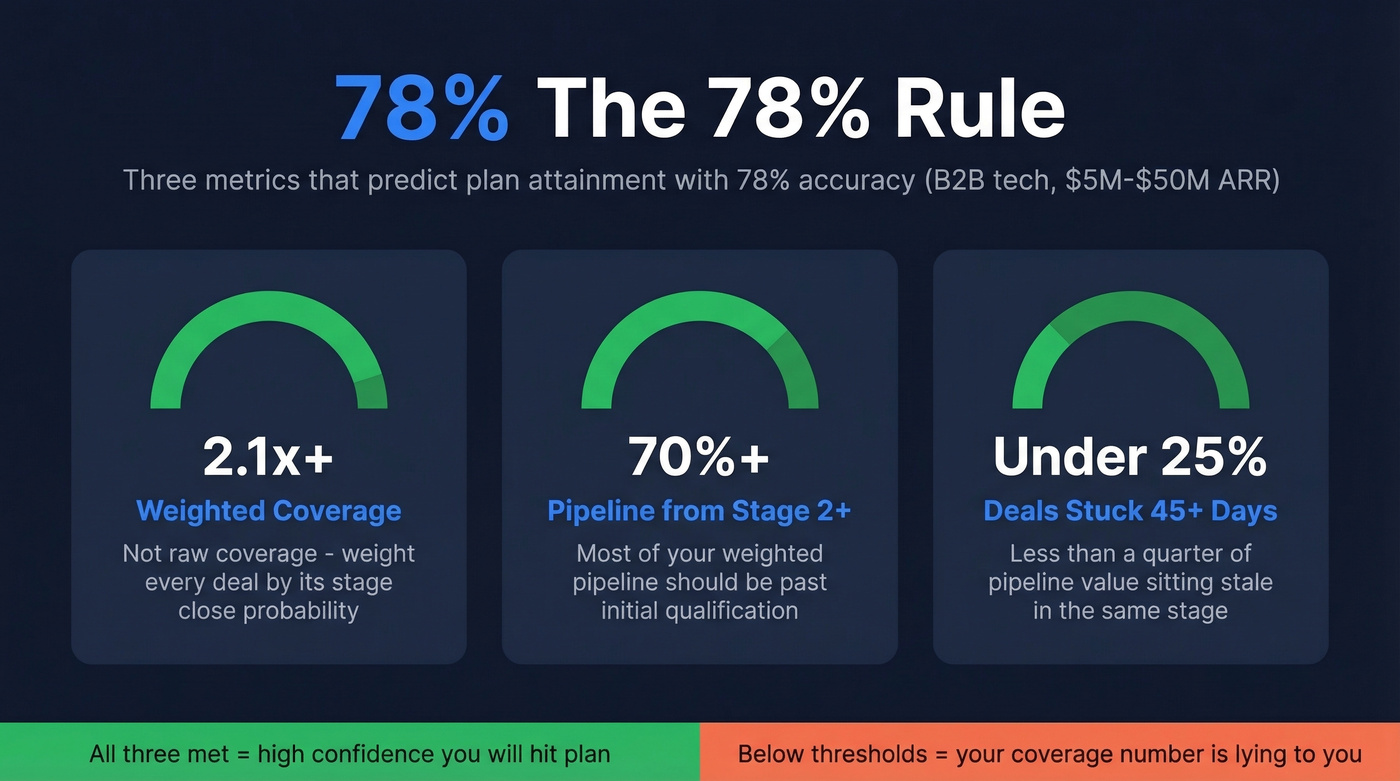
The 78% Rule (from Clari and TechGrowth Insights data, $5M-$50M companies):
- Weighted coverage above 2.1x
- 70%+ of weighted pipeline from Stage 2 or later
- Less than 25% of pipeline value stuck in the same stage for 45+ days
That combination predicts plan attainment with 78% accuracy. If you're below those thresholds, the coverage number is lying to you. The problem is either volume (not enough pipeline) or rate (not enough conversion), and the fix for each is completely different.
The Data Problem Underneath
Every formula above assumes the deals in your pipeline are real - that the contacts are reachable and the emails work. We've seen this pattern over and over: an SDR team generates 200 "opportunities" last quarter, but half had bounced emails. Your 4x coverage was really 1.5x.

Bad contact data is a pipeline coverage problem. Prospeo's 98% email accuracy and 7-day data refresh cycle mean the contacts feeding your pipeline are actually reachable. Meritt saw this firsthand - bounce rate dropped from 35% to under 4%, and pipeline tripled from $100K to $300K per week. That's not a coverage ratio trick. That's real pipeline built on verified data.
If you need more than 4x coverage to hit plan, you don't have a pipeline problem. You have a win-rate problem or a data quality problem. Fix the inputs before you chase more volume.
If you're diagnosing the root cause, start with pipeline health and then audit your sales pipeline challenges to see where deals stall.
You just learned that weighted coverage under 2.1x predicts missed quarters. But even weighted math breaks if your contacts aren't real. At $0.01 per verified email, Prospeo turns inflated coverage into pipeline that actually converts - 143M+ verified emails, refreshed every 7 days, not every 6 weeks.
Stop stuffing your funnel with unverifiable contacts. Verify before you pipeline.
FAQ
What's a good pipeline coverage ratio?
It depends on your win rate: close 25% and you need 4x; close 33% and 3x works; close 20% and you need 5x just to stay on track. Use weighted coverage for a realistic picture - median weighted coverage for B2B tech is 1.8x, meaning most teams carrying "3x raw" are actually closer to 2x.
How often should you measure pipeline coverage?
Weekly, at a consistent snapshot point. Kellogg recommends week 3 of the quarter as the most predictive window - early enough to course-correct, late enough to reflect real deal progression.
Does pipeline coverage account for deal quality?
Raw coverage doesn't - it treats a Stage 1 deal the same as a verbal commit. Weighted pipeline coverage adjusts each deal by its stage-based close probability, giving you a realistic picture. Pair that with verified contact data to ensure the underlying opportunities are built on reachable contacts, not bounced emails and dead leads.