ABM KPIs: What to Track, What to Drop, and How to Set It All Up
It's QBR day. Your CMO asks, "What's the ROI on our ABM program?" You pull up a dashboard full of MQLs, email opens, and webinar registrations. The room goes quiet - not because the numbers are bad, but because nobody can connect them to revenue.
You're not alone. Choosing the right ABM KPI framework is the difference between a funded program and a cancelled one. 80% of B2B organizations have an ABM program, but only about 30% run mature ones. The gap isn't strategy - it's measurement. Teams layer account-based tactics on top of lead-centric infrastructure, keep reporting MQLs, and wonder why the board won't fund the next phase. Meanwhile, 47% of ABM practitioners say proving ROI is their single biggest challenge.
Here's the thesis: if you launched ABM but still report MQLs to your VP, you don't have an ABM program. You have a targeting list with a fancy name.
What You Need (Quick Version)
If you only track five metrics, make them these:
- Pipeline velocity - how fast revenue moves through your funnel, calculated as pipeline value / sales cycle length in days
- Account engagement score - multi-stakeholder weighted, not single-champion activity
- Marketing-influenced pipeline - pipeline where marketing touched at least one contact before the opportunity was created
- Target account win rate - close rate for target accounts vs. everyone else
- Net revenue retention - expansion plus renewals from your ABM book of business
Pick two leading indicators (engagement score and account coverage) and three lagging indicators: velocity, win rate, and ROI. Review monthly.
You need 5 KPIs, not 13. Dashboard paralysis kills more ABM programs than bad strategy ever will.
Leading vs. Lagging: The ABM KPI Framework
Every account-based marketing KPI falls into one of two buckets - leading indicators that tell you if the program is working before revenue shows up, and lagging indicators that prove it after deals close.
| Funnel Stage | KPI Type | Metrics |
|---|---|---|
| Awareness | Leading | Ad engagement, target site visits |
| Engagement | Leading | Engagement score, buying committee coverage |
| Pipeline | Lagging | Pipeline velocity, influenced pipeline |
| Revenue | Lagging | Win rate, deal size, ROAS |
| Retention | Lagging | NRR, expansion revenue |
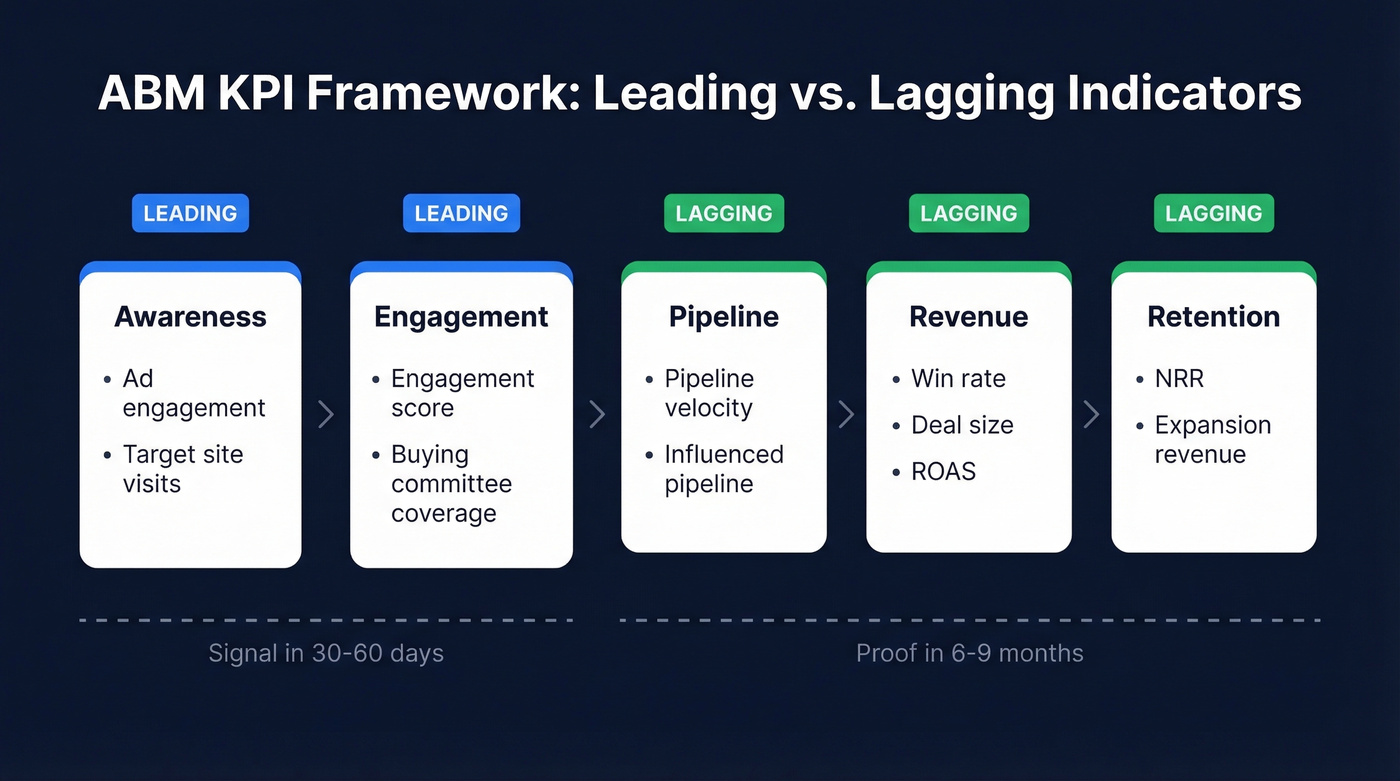
Leading indicators matter because ABM has a long feedback loop. If you wait 6-9 months for revenue data to tell you whether the program works, you've burned half your budget before you can course-correct. Engagement scores and account coverage give you signal within 30-60 days.
12 Account-Based Marketing Metrics That Matter
Engagement KPIs
Account engagement score is the single most misunderstood ABM metric. Most teams calculate it by summing individual contact activity - page views, email clicks, content downloads - and calling it an "account score." That's wrong.
A real engagement score weights multi-stakeholder activity. When three stakeholders from the same company engage with your brand, you're 50% more likely to convert that account from opportunity to closed-won. One champion downloading a whitepaper isn't buying committee engagement. Three people across different roles attending a webinar is.
Target account coverage measures what percentage of your target account list has at least one active contact engaged. If you're targeting 500 accounts and only 80 have any engagement, your coverage is 16% - and your pipeline projections are fiction.
Marketing qualified accounts (MQAs) replace MQLs. An MQA is an account that crosses a composite engagement threshold across multiple contacts, not a single person who filled out a form.
Pipeline KPIs
Pipeline velocity is the metric your CFO actually cares about. Here's the formula:
Pipeline Value / Average Sales Cycle Length (days) = Pipeline Velocity (value per day)
With $2M in pipeline and a 90-day average cycle and a 90-day average cycle, your velocity is roughly $22,222/day. Track this monthly and compare target accounts vs. non-target accounts. The delta is your ABM program's contribution.
Marketing-influenced pipeline captures the pipeline where marketing touched at least one contact before the opportunity was created. Sales cycle length only matters as a comparison - target accounts vs. non-target. ABM programs that work shorten cycles because multi-threading accelerates consensus.
Revenue & ROI KPIs
Target account win rate is the clearest proof of ABM impact. If your overall win rate is 22% but target accounts close at 35%, you've got a story the board will fund.
Average deal size should be larger for target accounts. You picked them because they fit your ICP - they should buy more. Track the spread between target and non-target deals quarterly.
ROAS by channel tells you where to allocate budget. Based on Directive's analysis of 1,200+ B2B campaigns:
| Channel | Avg ROAS |
|---|---|
| Google Search | 2.8 |
| 2.2 | |
| 1.9 |
ABM program ROI is the master metric - total attributed revenue minus total program cost, divided by total program cost. We'll walk through a full calculation below.
Retention KPIs
Net revenue retention (NRR) measures whether your ABM accounts grow after they close. If your ABM accounts churn at the same rate as non-target accounts, your targeting criteria need work.
Expansion revenue from target accounts tracks upsells, cross-sells, and seat expansion specifically within your ABM book. This is where ABM pays compound returns - the accounts you invested in pre-sale should expand faster post-sale.
Match Metrics to Your Account Tiers
Not every account in your target list needs the same KPIs. Tracking pipeline velocity for accounts that don't know you exist is meaningless.
| Tier | Goal | Leading Indicators | KPIs |
|---|---|---|---|
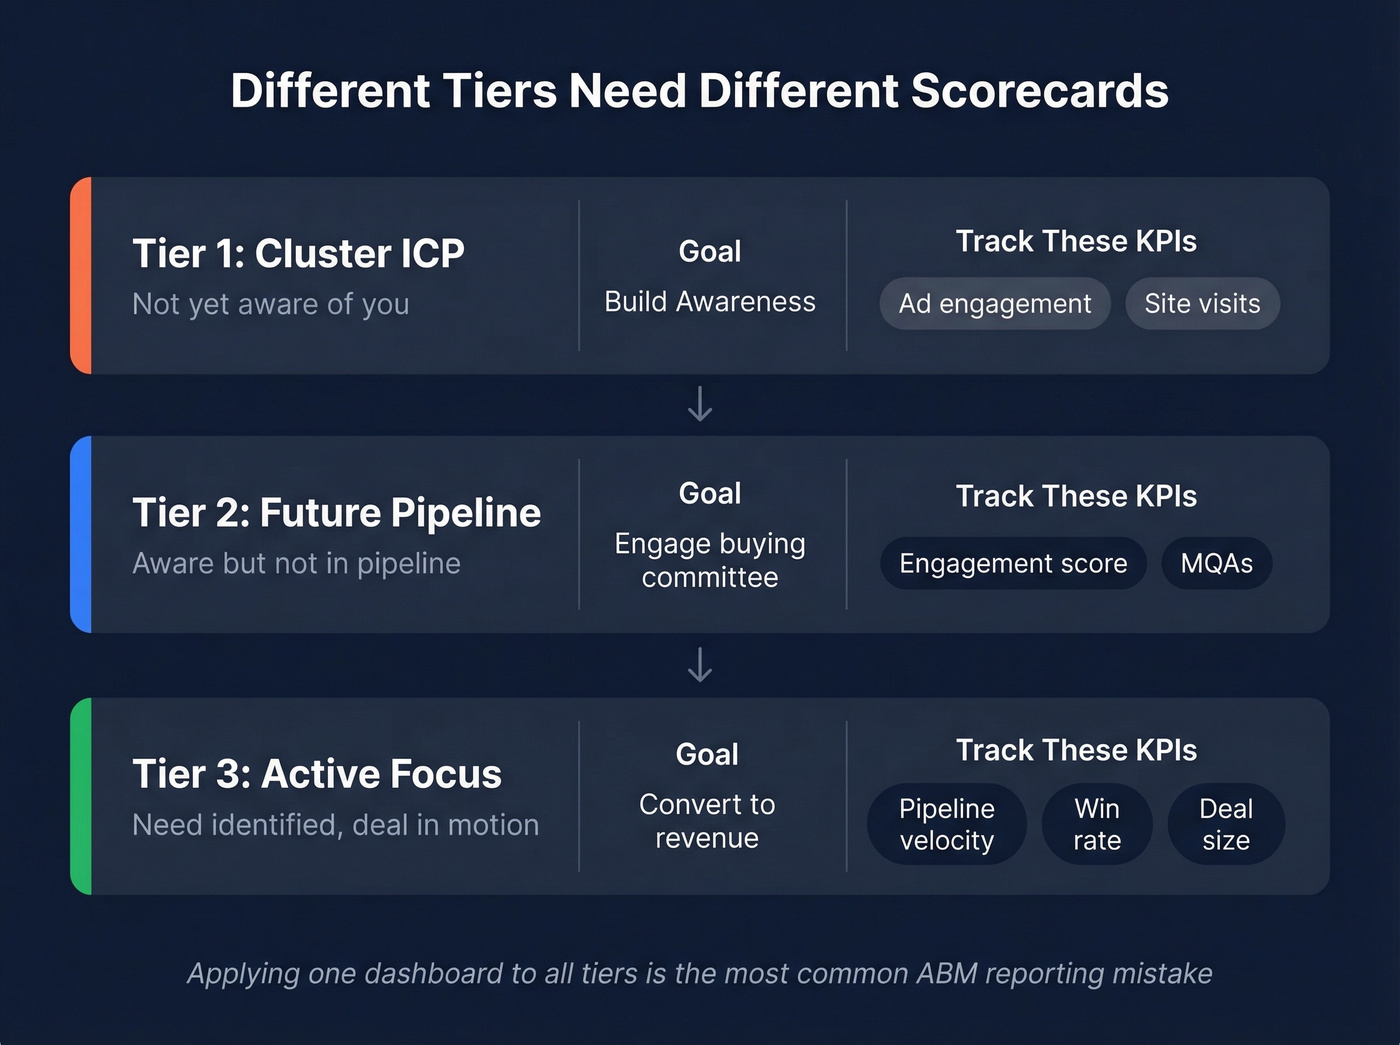
| Cluster ICP (not aware) | Awareness | Non-sales touchpoints, thought-leadership engagement | Ad engagement, site visits |
| Future Pipeline (aware) | Engaged buying committee | Committee members enrolled, insights collected | Engagement score, MQAs |
| Active Focus (need known) | Discovery to pipeline | Personalized offers, signal-based engagement | Velocity, win rate, deal size |
This tiered framework solves the most common ABM reporting failure: teams apply the same dashboard to all 500 target accounts and then can't explain why "engagement is up but pipeline is flat." Engagement is up for Cluster ICP accounts - which is exactly what should happen. Pipeline comes from Active Focus accounts. Different tiers, different scorecards.
Your target account coverage metric is only as good as the contacts behind it. Prospeo gives you 300M+ profiles with 30+ filters - buyer intent, technographics, headcount growth - so you can map entire buying committees, not just champions. 98% email accuracy means your multi-threaded outreach actually lands.
Stop measuring engagement on contacts you can't actually reach.
ABM Benchmarks: What "Good" Looks Like
Most guides give you 13 metrics and zero benchmarks. Here's what your peers actually spend and what returns they see.
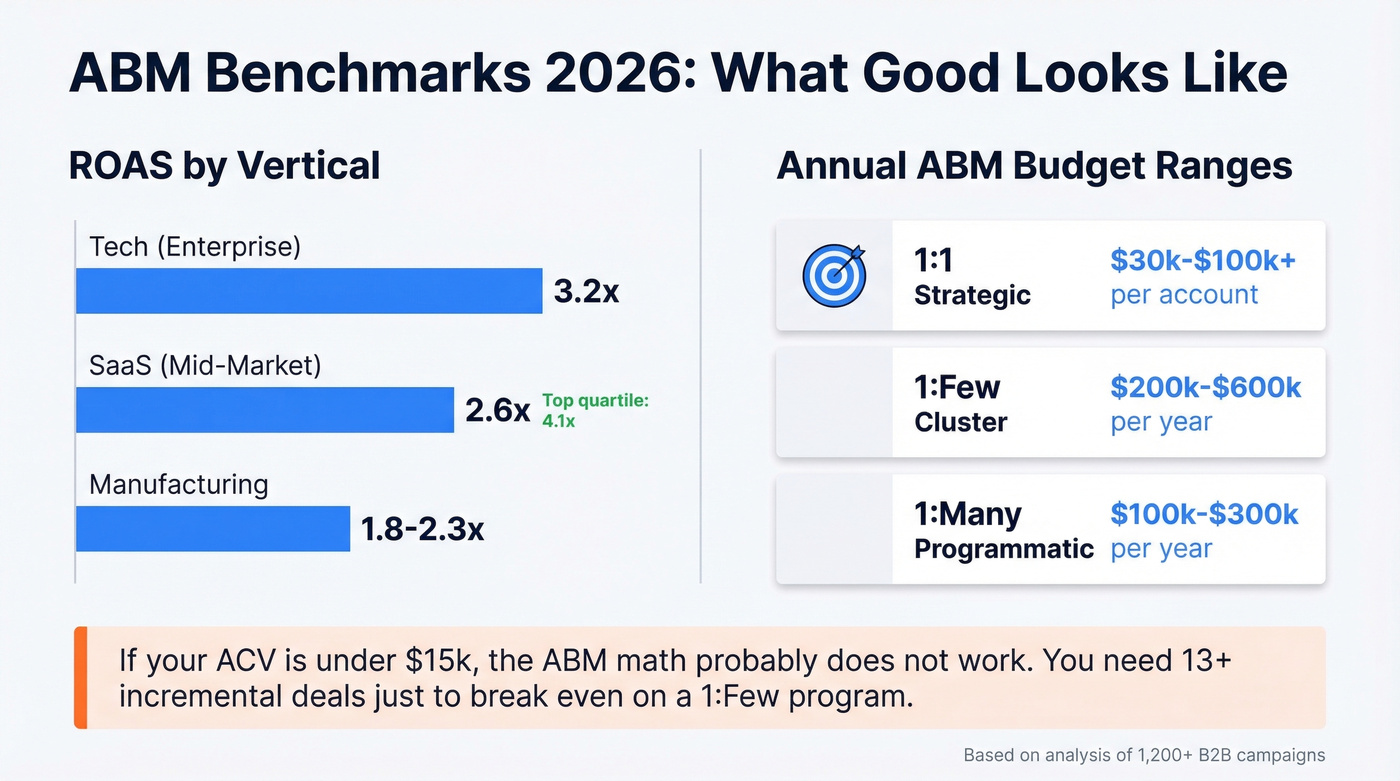
ROAS by vertical from 1,200+ campaigns:
| Vertical | Avg ROAS |
|---|---|
| Tech (Enterprise) | 3.2 |
| SaaS (Mid-Market) | 2.6 (top quartile: 4.1) |
| Manufacturing | 1.8-2.3 |
ABM program budget ranges:
| ABM Model | Annual Budget |
|---|---|
| 1:1 (strategic) | $30k-$100k+ per account |
| 1:Few (cluster) | $200k-$600k/year |
| 1:Many (programmatic) | $100k-$300k/year |
Channel-wise, email (92%) and in-person events (72%) remain the top-performing ABM channels. The AI hype is real but tempered - 45% of practitioners see its promise for personalization, yet nearly 70% find current effectiveness limited. And while 40% of teams now integrate ABM with demand gen programs, the majority still run them as separate motions.
ZenABM's 2026 analysis of 211 companies across 29 countries - covering $5.5M+ in ABM ad spend and 161,000+ ads - represents one of the largest public ABM-specific benchmark datasets available. The full CTR/CPC figures are gated, but the dataset's existence signals how seriously the market now takes ABM-specific measurement.
Here's the thing: if your average contract value is under $15k, you probably don't need a dedicated ABM program at all. The math doesn't work. A 1:few program costs $200k+ per year. You need to close 13+ incremental deals just to break even - and that's before you count the opportunity cost of what your team could have been doing with programmatic demand gen. ABM is a high-ACV play. Stop pretending otherwise.
Why ABM Attribution Breaks
58% of B2B companies say their ability to analyze marketing performance needs improvement or worse. Attribution isn't just hard - it's structurally broken for most ABM teams.
In B2B marketing communities, the most common complaint about ABM measurement isn't "we don't know what to track." It's "we can't get sales to care about the same numbers we do." Sales leaders look at account engagement dashboards and see marketing vanity metrics. Marketing leaders look at CRM pipeline reports and see incomplete attribution. Both are right, and the disconnect usually traces back to five structural problems:
- Data lives in 5+ systems - CRM, MAP, intent platform, ads, event tools, SDR outreach
- CRMs are lead-first, not account-first - Salesforce campaign members tie to people, not accounts
- Offline interactions are invisible - sales dinners, field events, hallway conversations
- The dark funnel is real - Slack communities, peer DMs, and podcasts influence deals but leave no trackable footprint
- Manual stitching breaks - connecting campaign to contact to account to opportunity requires brittle custom logic
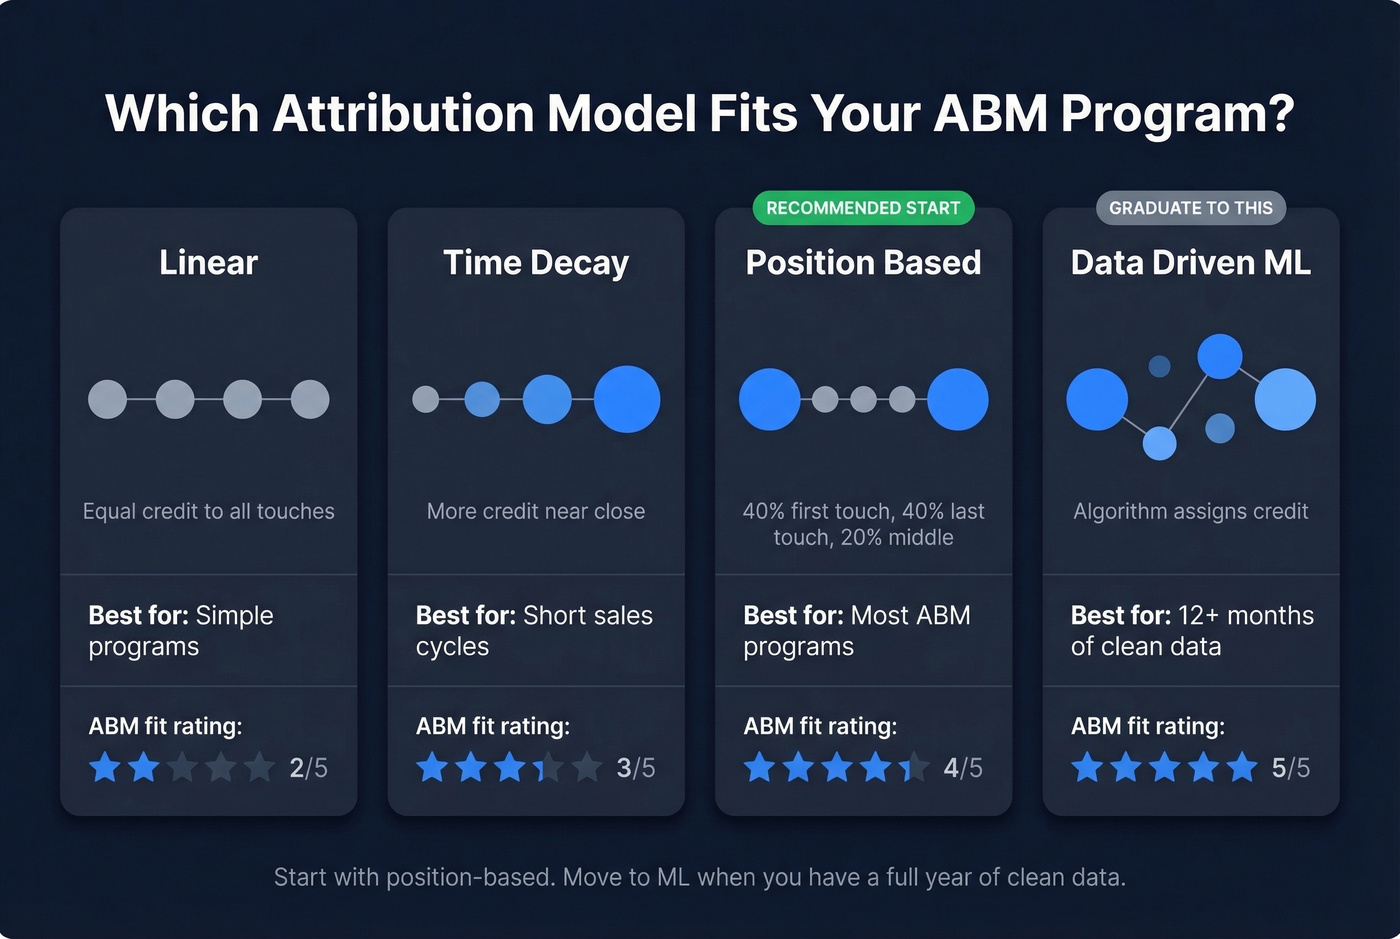
The fix starts with picking the right attribution model:
| Model | How It Works | Best For | ABM Fit |
|---|---|---|---|
| Linear | Equal credit all touches | Simple programs | ⭐⭐ |
| Time-decay | More credit near close | Short cycles | ⭐⭐⭐ |
| Position-based | 40% first + last, 20% middle | Most ABM programs | ⭐⭐⭐⭐ |
| Data-driven ML | Algorithmic | 12+ months of data | ⭐⭐⭐⭐⭐ |
Start with position-based. It gives appropriate weight to the first touch (awareness) and the last touch (conversion) while still crediting the nurture in between. Graduate to data-driven ML when you have a full year of clean data to train on.
CRM Setup for ABM KPI Tracking
Here's the minimum viable setup in HubSpot. Salesforce follows similar logic with custom fields instead of default properties.
1. Create the right properties. HubSpot ships with three default ABM properties: Buying role, Target account, and Ideal customer profile tier. Use HubSpot's ABM workflow template to auto-tier companies by firmographic criteria.
2. Build account lifecycle stages with triggers. Map your funnel: Identified, Aware, Engaged, Considering, Opportunity, Won. Each transition should fire via workflow, not manual updates.
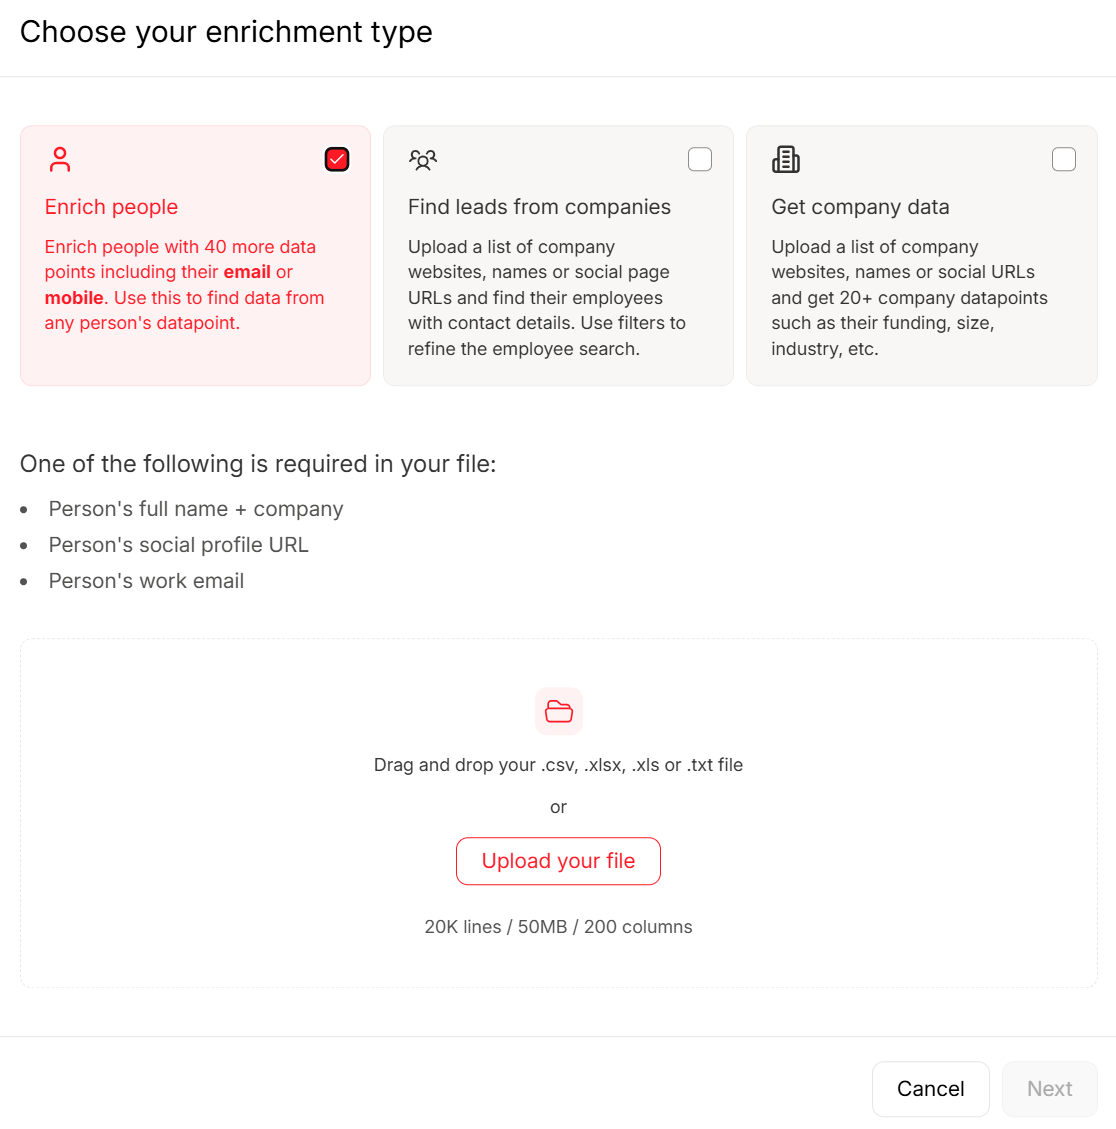
3. Enrich target account contacts. Your account-based marketing KPIs are only as accurate as the contact data underneath them. We've seen teams report 70% account engagement rates that drop to 40% after cleaning their contact records - the KPIs didn't change, the data underneath them did. Prospeo's enrichment returns 50+ data points per contact with an 83% match rate, and its 7-day refresh cycle keeps those records current so your engagement scores and coverage metrics start from a clean baseline.
4. Sync company segments to paid audiences. If you're running ads against target accounts, sync your ICP tier segments as matched audiences directly from HubSpot.
5. Build the dashboard. Three panels: firmographic overview, account funnel stage distribution, and campaign performance by tier. Review weekly with sales, monthly with leadership.
How to Calculate ABM ROI
Let's run the numbers on a realistic 1:few program.
Setup: 50 target accounts, 12-month program, position-based attribution.
Costs:
- ABM platform: $36,000
- Data and verification: $6,000
- Paid media: $120,000
- Content production: $48,000
- Headcount allocation (partial FTEs): $90,000
- Total: $300,000
Results:
- 12 closed-won deals from target accounts
- $1.2M in attributed revenue (position-based, weighted by engagement depth)
- ROI: ($1.2M - $300K) / $300K = 300%
Now here's where data quality makes or breaks this calculation. If 40% of the contacts in your target account list have outdated emails, your engagement scores have been inflated by bounces counted as "sends." In our experience, the teams that clean their data first and measure second consistently report more accurate - and often higher - true ROI because they aren't wasting budget on dead contacts. A weekly data refresh cycle versus the 6-week industry average is the difference between measuring signal and measuring noise.
What to Stop Tracking
The 6sense survey of 600+ marketers found that most teams "layer" ABM on top of lead-centric infrastructure. That means they're still reporting metrics that actively undermine account-based thinking. Kill these:
MQLs. MQLs reward individual form fills, not buying committee engagement. If your ABM dashboard still has an MQL column, delete it today.
Dials/sequences per week. This incentivizes volume over account penetration. An SDR blasting 80 dials across 80 accounts is doing the opposite of ABM.
Cost-per-lead. ABM targets accounts, not leads. CPL penalizes the deep, multi-threaded engagement that actually wins deals.
Total lead volume. 500 leads from non-target accounts is worse than 50 engaged contacts across 10 target accounts. Stop celebrating the wrong number.
Sales cycle length in isolation. Only meaningful when compared target vs. non-target. Without that comparison, it's just a number on a slide.
Let's be honest - if you're still presenting CPL to your board alongside an "ABM strategy" deck, you're sending mixed signals about what your team actually does. Pick a lane.
Pipeline velocity depends on reaching the right stakeholders fast. Prospeo's 125M+ verified mobiles (30% pickup rate) and 7-day data refresh mean your Active Focus accounts get real conversations, not bounced emails from stale databases. Teams using Prospeo book 26% more meetings than ZoomInfo users.
Fix your ABM data layer before you optimize another dashboard.
FAQ
What's the single most important ABM KPI?
Pipeline velocity. It combines pipeline value and cycle time into one number that your CFO actually cares about. Track it monthly, compare target accounts vs. non-target, and the delta tells you exactly what your ABM program is worth.
How long before ABM metrics show results?
Leading indicators like engagement scores and account coverage should move within 30-60 days. Pipeline and revenue KPIs typically need 2-3 full sales cycles to mature - that's 6-12 months for most B2B companies. Don't kill a program at month three because revenue hasn't appeared yet.
How many KPIs should an ABM team track?
Five, max. Two leading indicators - account engagement score and target account coverage - and three lagging: pipeline velocity, win rate, and ROI. More than that creates dashboard paralysis that slows decision-making without improving outcomes.
What tools do I need for ABM KPI tracking?
A CRM with account-level reporting like HubSpot or Salesforce, a data quality layer like Prospeo to keep contact records accurate on a weekly refresh cycle, and optionally an intent data platform like 6sense or Demandbase for buying signal detection.
Should I track different metrics for different account tiers?
Yes. Awareness-stage accounts need engagement metrics like ad interaction rates and website visits. Active pipeline accounts need velocity and win rate. Applying the same dashboard to every tier is why most ABM reporting feels disconnected from reality.