How to Analyze Sales Data in 2026 (With Benchmarks)
Your VP asks why Q1 pipeline is down 20%. You pull up the CRM, stare at a dashboard that hasn't been touched since onboarding, and realize you don't actually know how to answer the question with data. You're not alone - but companies that figure out sales data analysis see up to 20% higher sales productivity and 10%+ revenue gains.
Here's the entire process, from raw CRM data to decisions that move pipeline.
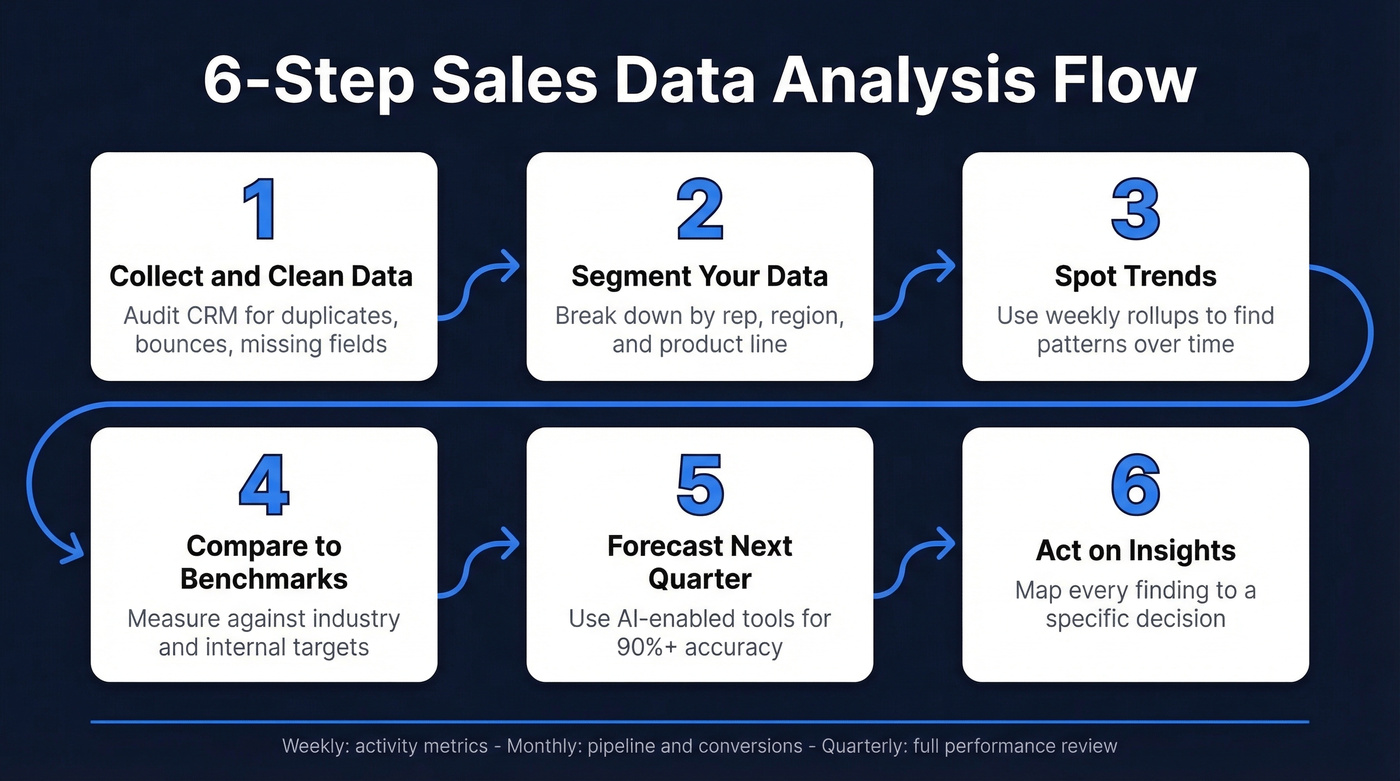
The short version: collect and clean your data, segment it by rep, region, and product, spot trends, compare against benchmarks, forecast, then act. Those six steps cover 90% of what sales performance analysis actually means. The rest of this guide gives you the formulas, benchmarks, tools, and mistakes to avoid so you can do each step well.
What Is Sales Analysis?
Sales analysis is the process of examining past and current sales performance to understand what happened and why. Did revenue dip in March? Which rep closed the most in the Southeast? Where are deals stalling in the pipeline?
Sales analytics goes further - it uses predictive modeling to forecast what happens next, identifying which deals are likely to close, which accounts are at risk, and where to allocate resources next quarter. The distinction matters because the tools, skills, and cadences are different for each.
The analytics world breaks into four levels: descriptive (what happened), diagnostic (why), predictive (what will happen), and prescriptive (what to do about it). Most sales teams live in descriptive and diagnostic. The best ones are pushing into predictive. This guide covers all four.
Why Sales Data Analysis Matters
The case for data-driven sales isn't theoretical anymore. High-performing sales organizations are 1.5x more likely to use data-driven forecasting than underperforming teams. That gap compounds every quarter.
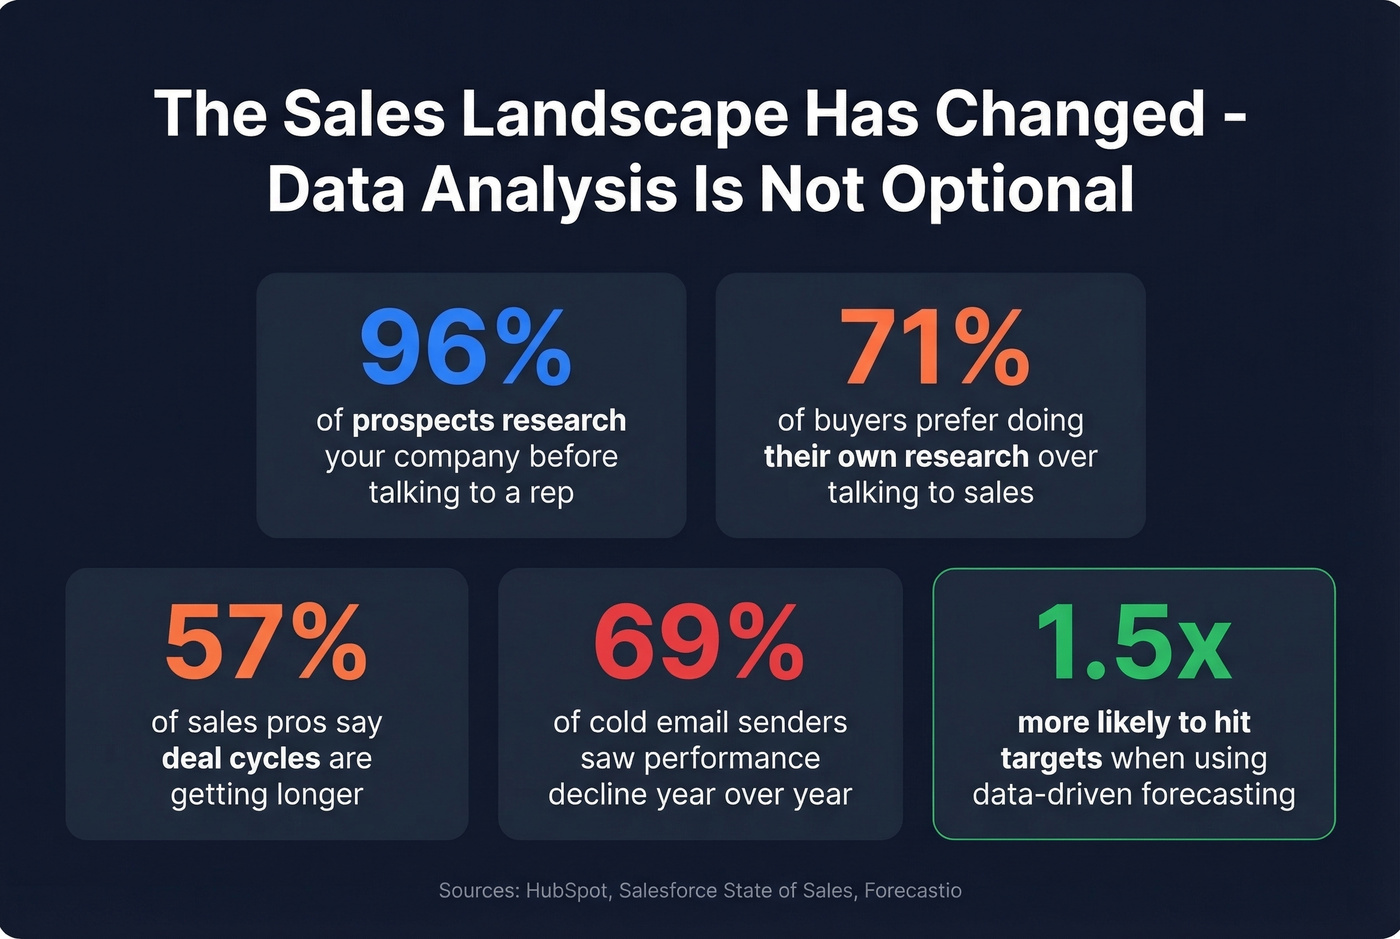
Here's what makes it urgent: 96% of prospects research your company before engaging a rep, and 71% prefer doing their own research over talking to sales at all. Meanwhile, 57% of sales professionals say cycles are getting longer, and 69% of cold email senders report performance declined year-over-year. Buyers are more informed, more skeptical, and slower to commit. If you're not examining sales trends to understand where deals stall and why, you're guessing - and reps spend 60% of their time on non-selling tasks, which means the selling time they do have needs to be aimed precisely.
Let's be honest: most teams don't have an analytics problem. They have a data quality problem dressed up as an analytics problem. You can buy the fanciest BI tool on the market, but if a big chunk of your contact emails bounce, your dashboards are just beautiful fiction. Fix the inputs first.
The 6-Step Sales Analysis Process
Step 1: Collect and Clean Data
Everything downstream depends on this step. If your CRM is full of duplicates, outdated contacts, and inconsistent formatting, every metric you calculate will be wrong. 84% of data and analytics leaders agree that AI outputs are only as good as data inputs, and 74% of sales teams with AI are prioritizing data hygiene to support it. Salesforce also found that 70% of sales leaders believe their most valuable insights are [trapped in unstructured data](https://www.bain.com/about/media-center/press-releases/20252/70-of-companies-struggle-to-integrate-their-sales-plays-into-crm-and-revenue-technologies-finds-bain - company-survey/) - data that never gets analyzed because it's too messy to use.
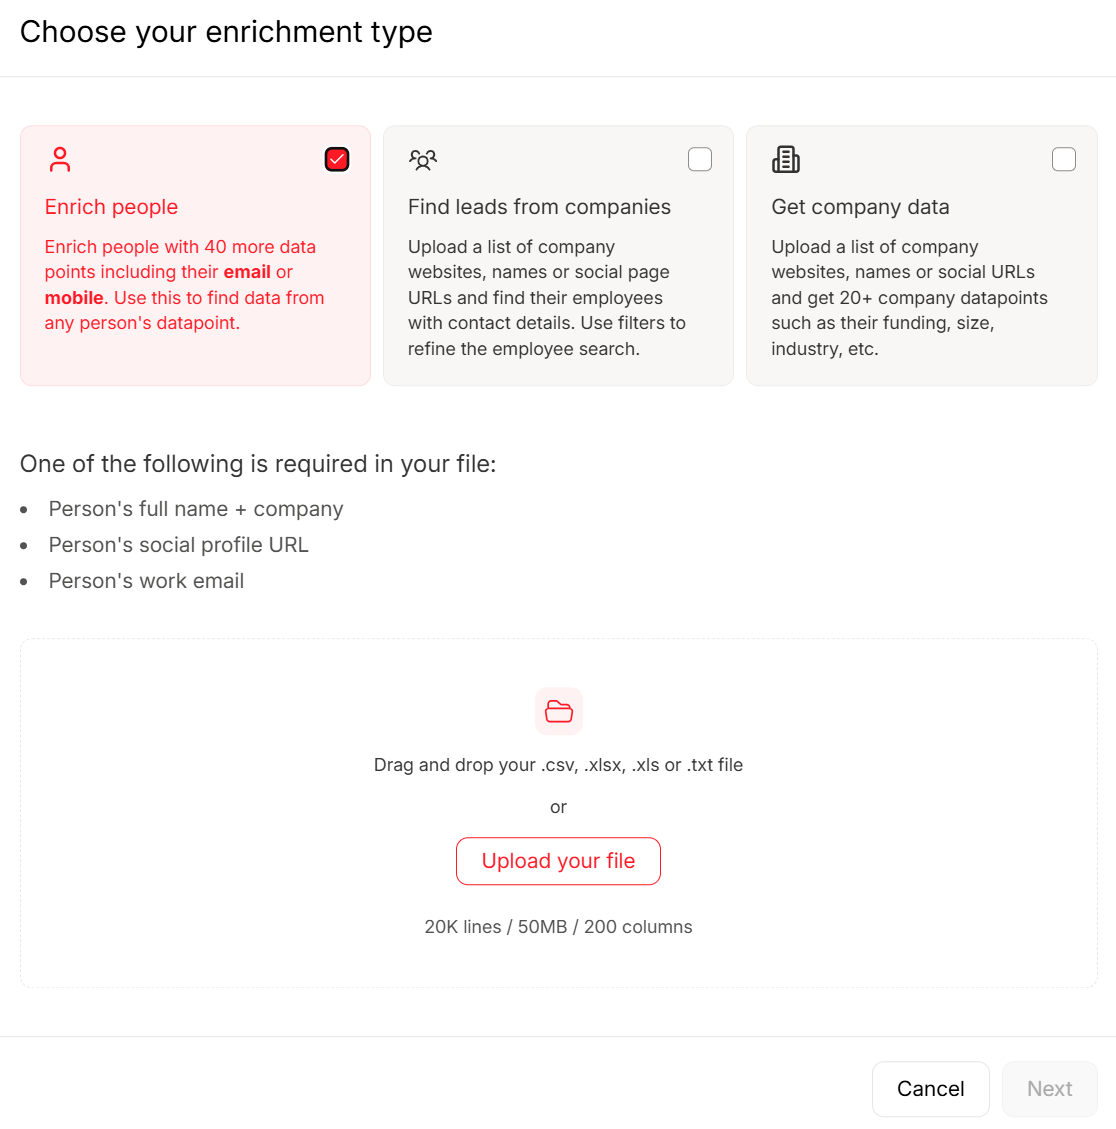
Start by auditing your CRM for bounce rates, missing fields, and duplicate records. If you're seeing bounce rates around 35%, your outreach metrics and pipeline assumptions get distorted fast. This is where data enrichment tools earn their keep - Prospeo's CRM enrichment returns 50+ data points per contact with emails verified at 98% accuracy on a 7-day refresh cycle. That's the kind of foundation you need before any analysis makes sense.
Step 2: Segment by Rep, Region, Product
Raw totals hide everything interesting. A flat "we closed $2M this quarter" tells you nothing about whether that's concentrated in one rep, one region, or one product line.
Segment your data by at least three dimensions: individual rep performance, geographic region, and product or service line. This is where patterns emerge. Your West Coast team crushes mid-market but struggles with enterprise. One product line has a 45% win rate while another sits at 12%. You can't fix what you can't see.
Step 3: Spot Trends and Patterns
Look for consistent patterns over time, not just snapshots. Seasonality, campaign impact, pricing changes - these all show up in trend data.
A common practitioner problem is granularity: daily data is often too noisy to be useful. Weekly rollups or 7-day rolling averages smooth out the noise while still showing the impact of specific events like product launches or pricing changes. We've seen teams waste hours debating whether a Tuesday dip means something when it's just normal variance. Aggregate at the right level for your sales cycle length. If your average deal takes 60 days, daily pipeline snapshots are noise. Weekly or biweekly views tell the real story.
Step 4: Compare Against Benchmarks
Numbers without context are just numbers. A 35% win rate sounds decent - until you learn the B2B SaaS benchmark for SQL-to-Closed is 37%. A 20% lead-to-MQL conversion sounds low - until you see that some industries run at 15%.
The benchmarks section below gives you the specific numbers to compare against. Pick 4-5 metrics that matter for your business and track them consistently against both internal targets and industry benchmarks. Don't try to track everything. Track what drives revenue.
Step 5: Forecast What's Next
Traditional sales forecasting - reps calling their deals, managers applying gut-feel haircuts - rarely exceeds 60-70% accuracy. AI-enabled forecasting tools are pushing that to 90%+ for 30-90 day windows by examining deal characteristics, engagement patterns, and external signals simultaneously. No human can do that across hundreds of opportunities.
If you're still forecasting in a spreadsheet, you're leaving accuracy on the table. Start with your CRM's native forecasting features before investing in standalone software.
Step 6: Act on What You Find
Analysis without action is expensive curiosity. Every insight should map to a specific decision: reallocate territory, adjust pricing, coach a rep, kill an underperforming campaign, or double down on what's working.
Build a cadence. Track activity metrics weekly. Review pipeline and conversion metrics monthly. Run a full performance evaluation quarterly. Match the cadence to your sales cycle - if deals take 6 months, monthly pipeline reviews matter more than weekly ones.
Step 1 of your sales analysis process is data quality - and it's where most teams fail. Prospeo's CRM enrichment returns 50+ data points per contact at 98% email accuracy, refreshed every 7 days. Teams using Prospeo cut bounce rates from 35% to under 4%.
Stop analyzing bad data. Start with inputs you can trust.
Key Metrics and Benchmarks
Core Formulas
| Metric | Formula |
|---|---|
| Pipeline Velocity | (Qualified Opps x Avg Deal Size x Win Rate) / Avg Cycle Length |
| Conversion Rate | (Conversions / Total Leads) x 100 |
| Win Rate | (Closed Won / Total Opps) x 100 |
| Avg Transaction Value | Total Revenue / Number of Deals |
| MRR | Sum of All Monthly Subscriptions |
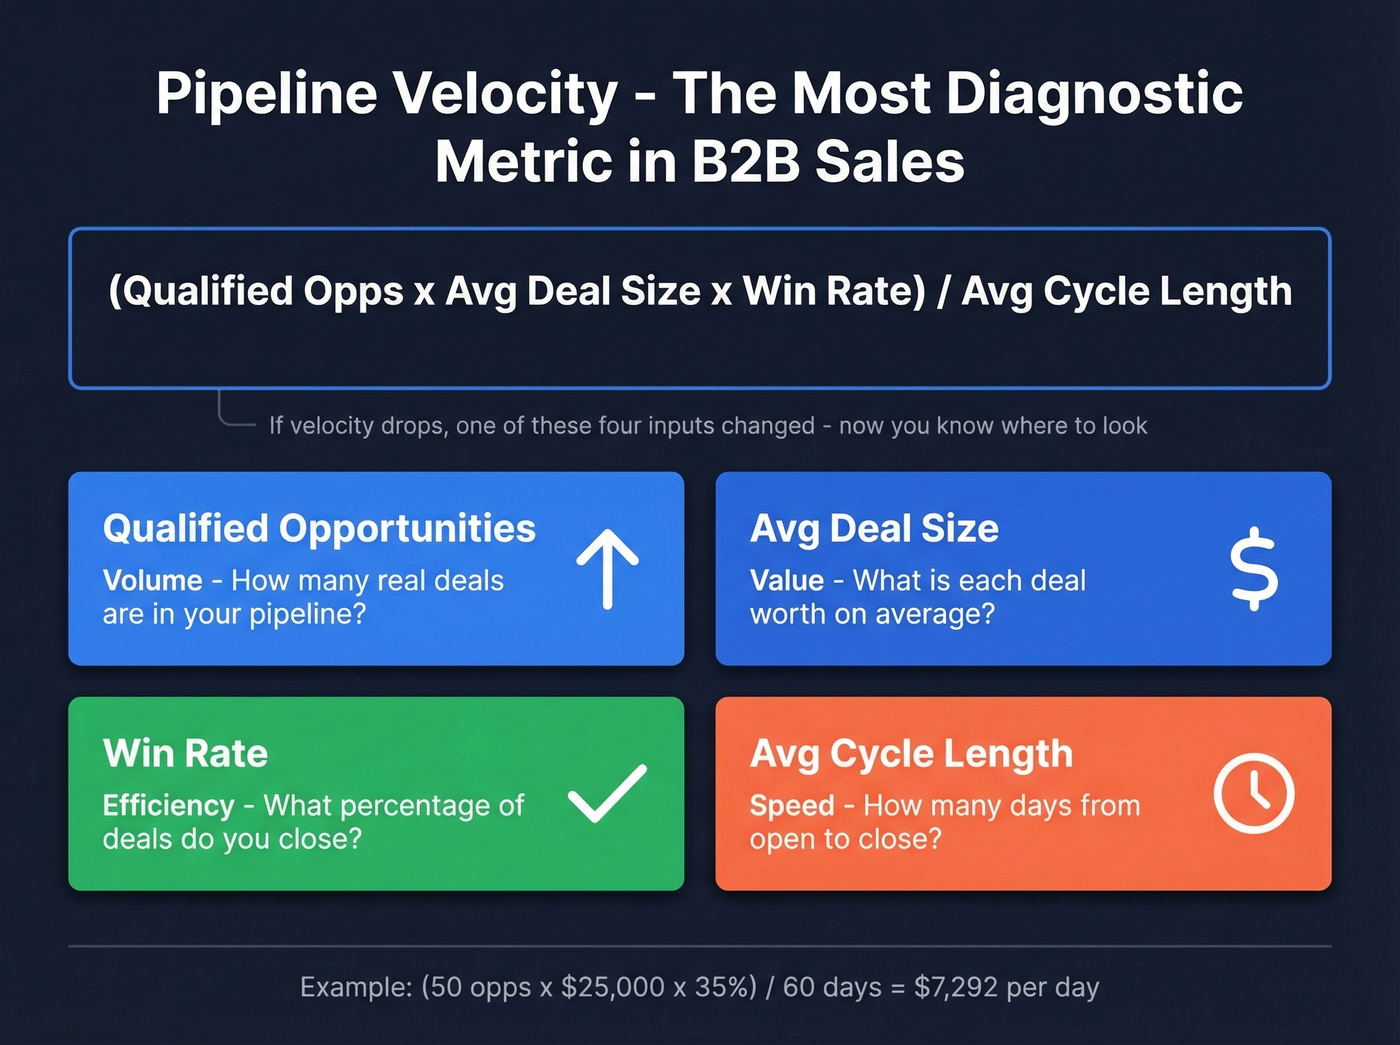
Pipeline velocity is the single most diagnostic metric in B2B sales. It captures volume, value, efficiency, and speed in one number. If velocity drops, one of those four inputs changed - and now you know where to look.
Funnel Conversion Benchmarks
These benchmarks come from First Page Sage's latest funnel conversion report, drawn from anonymized client data.
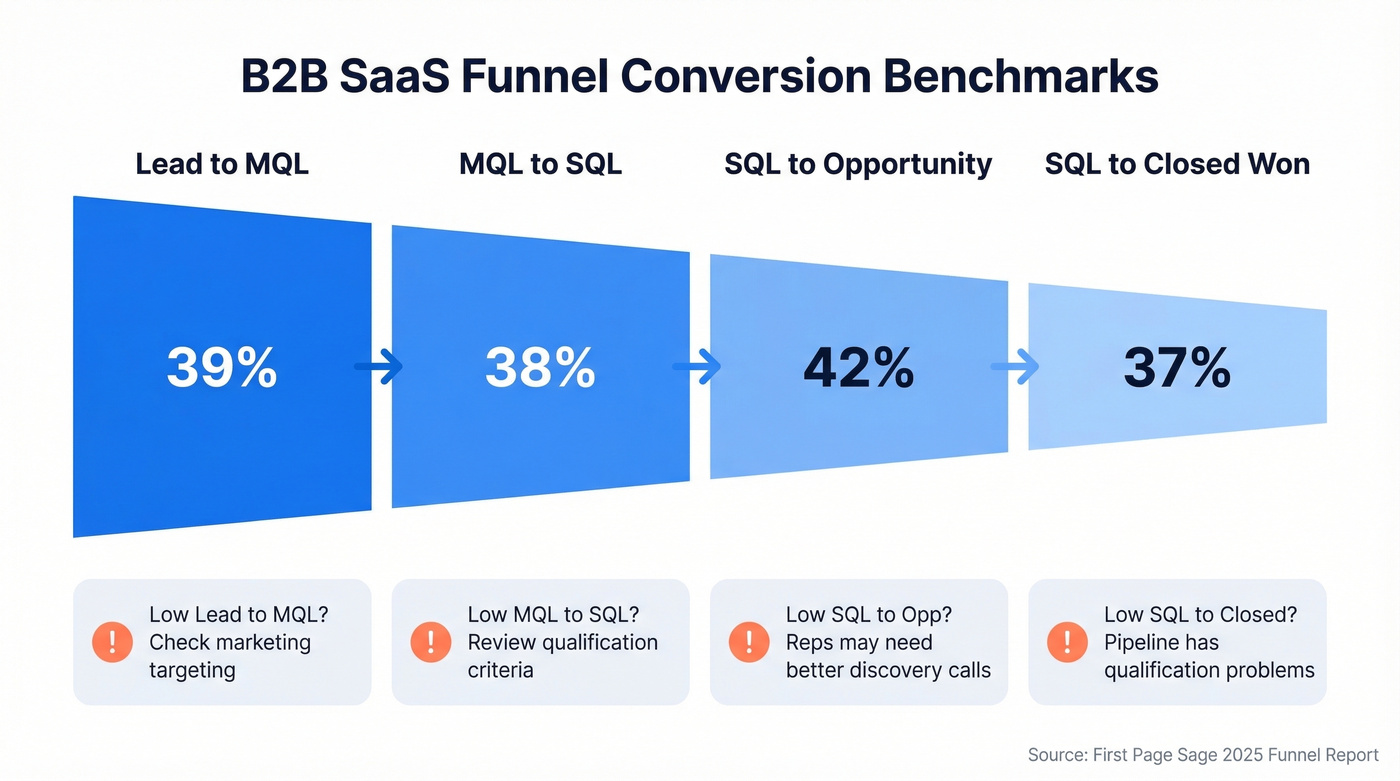
| Industry | Lead-MQL | MQL-SQL | SQL-Opp | SQL-Closed |
|---|---|---|---|---|
| B2B SaaS | 39% | 38% | 42% | 37% |
If your SQL-to-Closed rate is significantly below your industry benchmark, the problem is usually qualification - you're letting unqualified deals into the pipeline. If Lead-to-MQL is low, it's a marketing targeting issue. These benchmarks aren't gospel, but they're strong directional data.
Pipeline coverage deserves its own callout. Most B2B teams target 3-5x quota. If you need $1M in closed revenue this quarter, you want $3-5M in qualified pipeline. Below 3x and you're relying on heroics. Above 5x and your pipeline is probably bloated with dead deals dragging down your forecasting accuracy. Track this number monthly - it's the earliest warning signal you'll get.
How to Do It in Excel
Excel works for very small teams. Beyond that, you'll want CRM reporting or a real analytics tool. But if you're starting small, here's the workflow.
Clean first: Data - Remove Duplicates to eliminate duplicate rows. Then build pivot tables - drag rep names into Rows, deal values into Values, and months into Columns. You'll have a rep-by-month revenue view in 30 seconds.
For formulas, you need three: SUM for totals, AVERAGE for means, and COUNTIF for conversion rates (count deals at Stage X divided by count at Stage X-1). For basic forecasting, create a line chart of monthly revenue, right-click the data series, and select Add Trendline - choose linear for steady growth or exponential for accelerating markets.
Here's the thing: Excel doesn't scale. It doesn't update automatically, it doesn't catch data entry errors, and it breaks the moment two people edit the same file. Use it to learn the concepts, then graduate to dedicated tools or CRM-native analytics.
Best Sales Analysis Tools
| Category | Tool | Starting Price | Best For |
|---|---|---|---|
| Data Quality | Prospeo | Free tier / ~$0.01 per email | Clean data foundation for analysis |
| CRM-Native | Salesforce | From $25/user/mo | Enterprise teams with complex workflows |
| CRM-Native | HubSpot Sales Hub | $45-150/user/mo | Teams under 50 reps |
| CRM-Native | Pipedrive | From $14/user/mo | Small teams wanting simplicity |
| CRM-Native | Zoho CRM | $14-40/user/mo | Budget-conscious mid-market |
| BI / Dashboards | Power BI | Included with M365 E5 / from $10/user/mo | Microsoft shops |
| BI / Dashboards | Tableau | From $15/user/mo | Advanced data visualization |
| Revenue Intelligence | Clari | ~$100-120/user/mo | Revenue teams 50+ reps |
| Revenue Intelligence | Gong | ~$250/user/mo (bundled) | Conversation intelligence at scale |
| AI Forecasting | Salesforce Einstein | $50-220/user/mo | Salesforce-native AI |
| AI Forecasting | Forecastio | $49-99/user/mo | Standalone forecasting |
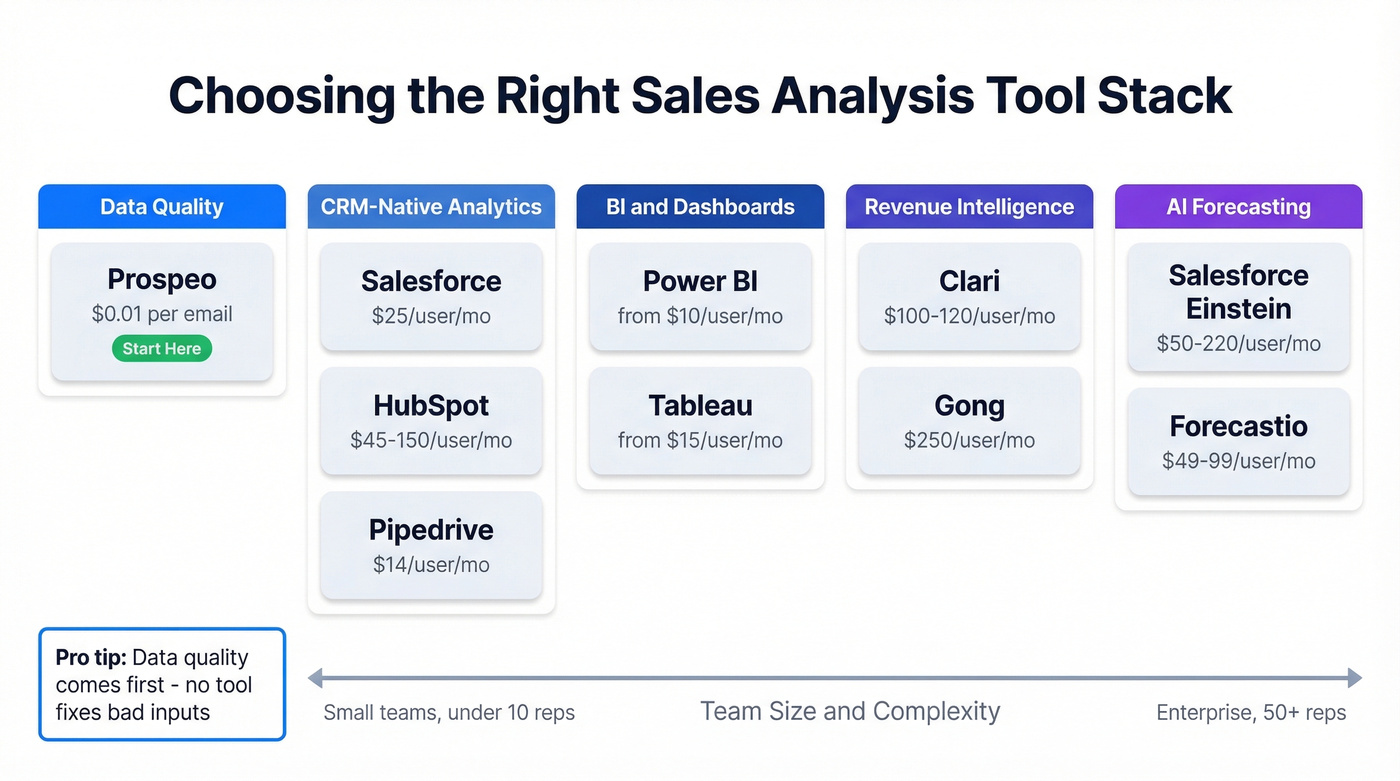
Our recommendations: for teams under 50 reps, HubSpot's native analytics cover what most teams need without buying separate software. For mid-market teams that want dashboards beyond CRM-native, Power BI is a strong value play at a lower starting price than Tableau. Start with your CRM's built-in forecasting features before paying for Clari or Gong - those tools earn their price at scale, but they're overkill for a 10-person team.
Skip Gong entirely if your team is under 20 reps. The per-seat cost only makes sense when you have enough call volume to train the models on your specific sales motion.
Mistakes That Ruin Your Analysis
Inconsistent data entry. When "T-shirt," "TShirt," and "tee" are three separate products in your CRM, your product analysis is useless. Standardize naming conventions and enforce them with picklists.
Ignoring returns and refunds. Counting gross revenue without netting out returns inflates your metrics. This is especially common in teams that celebrate bookings without tracking churn. (If you're in SaaS, pair this with churn analysis so you don't optimize the wrong number.)
No rep-level tracking. Team averages hide individual performance gaps. If one rep closes at 45% and another at 15%, the "team win rate" of 30% tells you nothing useful. You need the granularity to coach the 15% rep - or reassign their accounts.
Wrong tool complexity. I've watched a 5-person team buy Tableau for basic pipeline reports. Six months later, nobody used it. Match the tool to the team's actual skill level.
No analysis cadence. Running analysis once a quarter is an autopsy, not a diagnostic. Build weekly, monthly, and quarterly review rhythms.
No benchmarks. A 25% win rate means nothing without context. Use the benchmarks above or build internal baselines from your last four quarters.
Dirty contact data corrupting pipeline metrics. Every "opportunity" tied to an invalid contact is a ghost deal that wastes rep time and distorts your forecast. The consensus on r/sales is pretty clear on this - garbage in, garbage out isn't just a cliche, it's the number one reason forecasts miss. Fix the data layer first. Everything else depends on it.

Every benchmark in this guide assumes your pipeline data reflects reality. If your contacts bounce at 35%, your win rates, conversion metrics, and forecasts are all fiction. Prospeo verifies emails through a 5-step process and refreshes records weekly - not every 6 weeks like competitors.
Accurate analysis starts at $0.01 per verified email.
FAQ
What's sales analysis vs. sales analytics?
Sales analysis examines past and current performance - what happened and why. Sales analytics uses predictive modeling to forecast what happens next. Most teams need both: analysis to diagnose problems, analytics to anticipate them. Start with descriptive analysis before investing in predictive tools.
How often should you review sales data?
Track activity metrics like calls and emails weekly. Review pipeline and conversion metrics monthly. Run a full performance analysis quarterly. If your average deal closes in under 30 days, tighten each cadence by one interval - weekly pipeline reviews instead of monthly.
What four metrics should I track first?
Start with conversion rate, average deal size, win rate, and sales cycle length. These four reveal most pipeline problems and they're easy to calculate from standard CRM data. Add pipeline velocity once you're comfortable - it combines all four into one diagnostic number.
How does data quality affect sales analysis?
Bad data corrupts every downstream metric. If 30%+ of your contact emails bounce, conversion rates, pipeline forecasts, and rep performance scores all drift. Enrichment tools that verify on a weekly refresh cycle prevent this kind of decay, while free alternatives typically cap at 25 searches per month - choose based on your volume needs.
Can I start analyzing sales without a CRM?
Yes, with Excel or Google Sheets - but it breaks down fast beyond 5-10 reps. CRM-native analytics from HubSpot or Salesforce scale better and eliminate the manual errors that corrupt spreadsheet analysis. Most teams outgrow spreadsheets within one quarter.