B2B Conversion Rates: Every Benchmark You Need in 2026
The average B2B conversion rate is 2.9%. That single number, pulled from 100M+ data points by Ruler Analytics, gets cited everywhere - and it tells you almost nothing. A 2.9% visitor-to-lead rate for a legal services firm would be well below the 7.4% benchmark. The same 2.9% for cybersecurity would be far above the 1.0% benchmark.
Context is everything.
Find your industry below, check your weakest funnel stage, and focus there. That's where the biggest gains are. The headline number is just the starting line.
What "Conversion Rate" Actually Means in B2B
The formula is simple: conversions divided by total interactions, times 100. The tricky part is that "conversion" changes meaning at every funnel stage.
A visitor-to-lead rate and an MQL-to-SQL rate are both conversion metrics, but they measure completely different things. When someone tells you their rate is 5%, your first question should be: "conversion from what to what?" A 5% visitor-to-lead rate is strong. A 5% opportunity-to-close rate is a problem. Every benchmark in this guide specifies the stage, because a number without context is just noise.
The Headline Number (And Why It's Almost Useless)
That 2.9% average breaks down into a 1.7% form rate and a 1.2% call rate across 14 industries. Ruler defines "conversion" as a qualified lead - not just any form fill - which makes it more useful than most benchmarks that count every newsletter signup.
Here's the thing: a 2% rate for enterprise SaaS selling six-figure contracts is solid. A 2% MQL-to-SQL rate means your qualification process is broken. Same number, two completely different diagnoses. Let's get into the segmented data that actually helps you make decisions.
Benchmarks by Industry
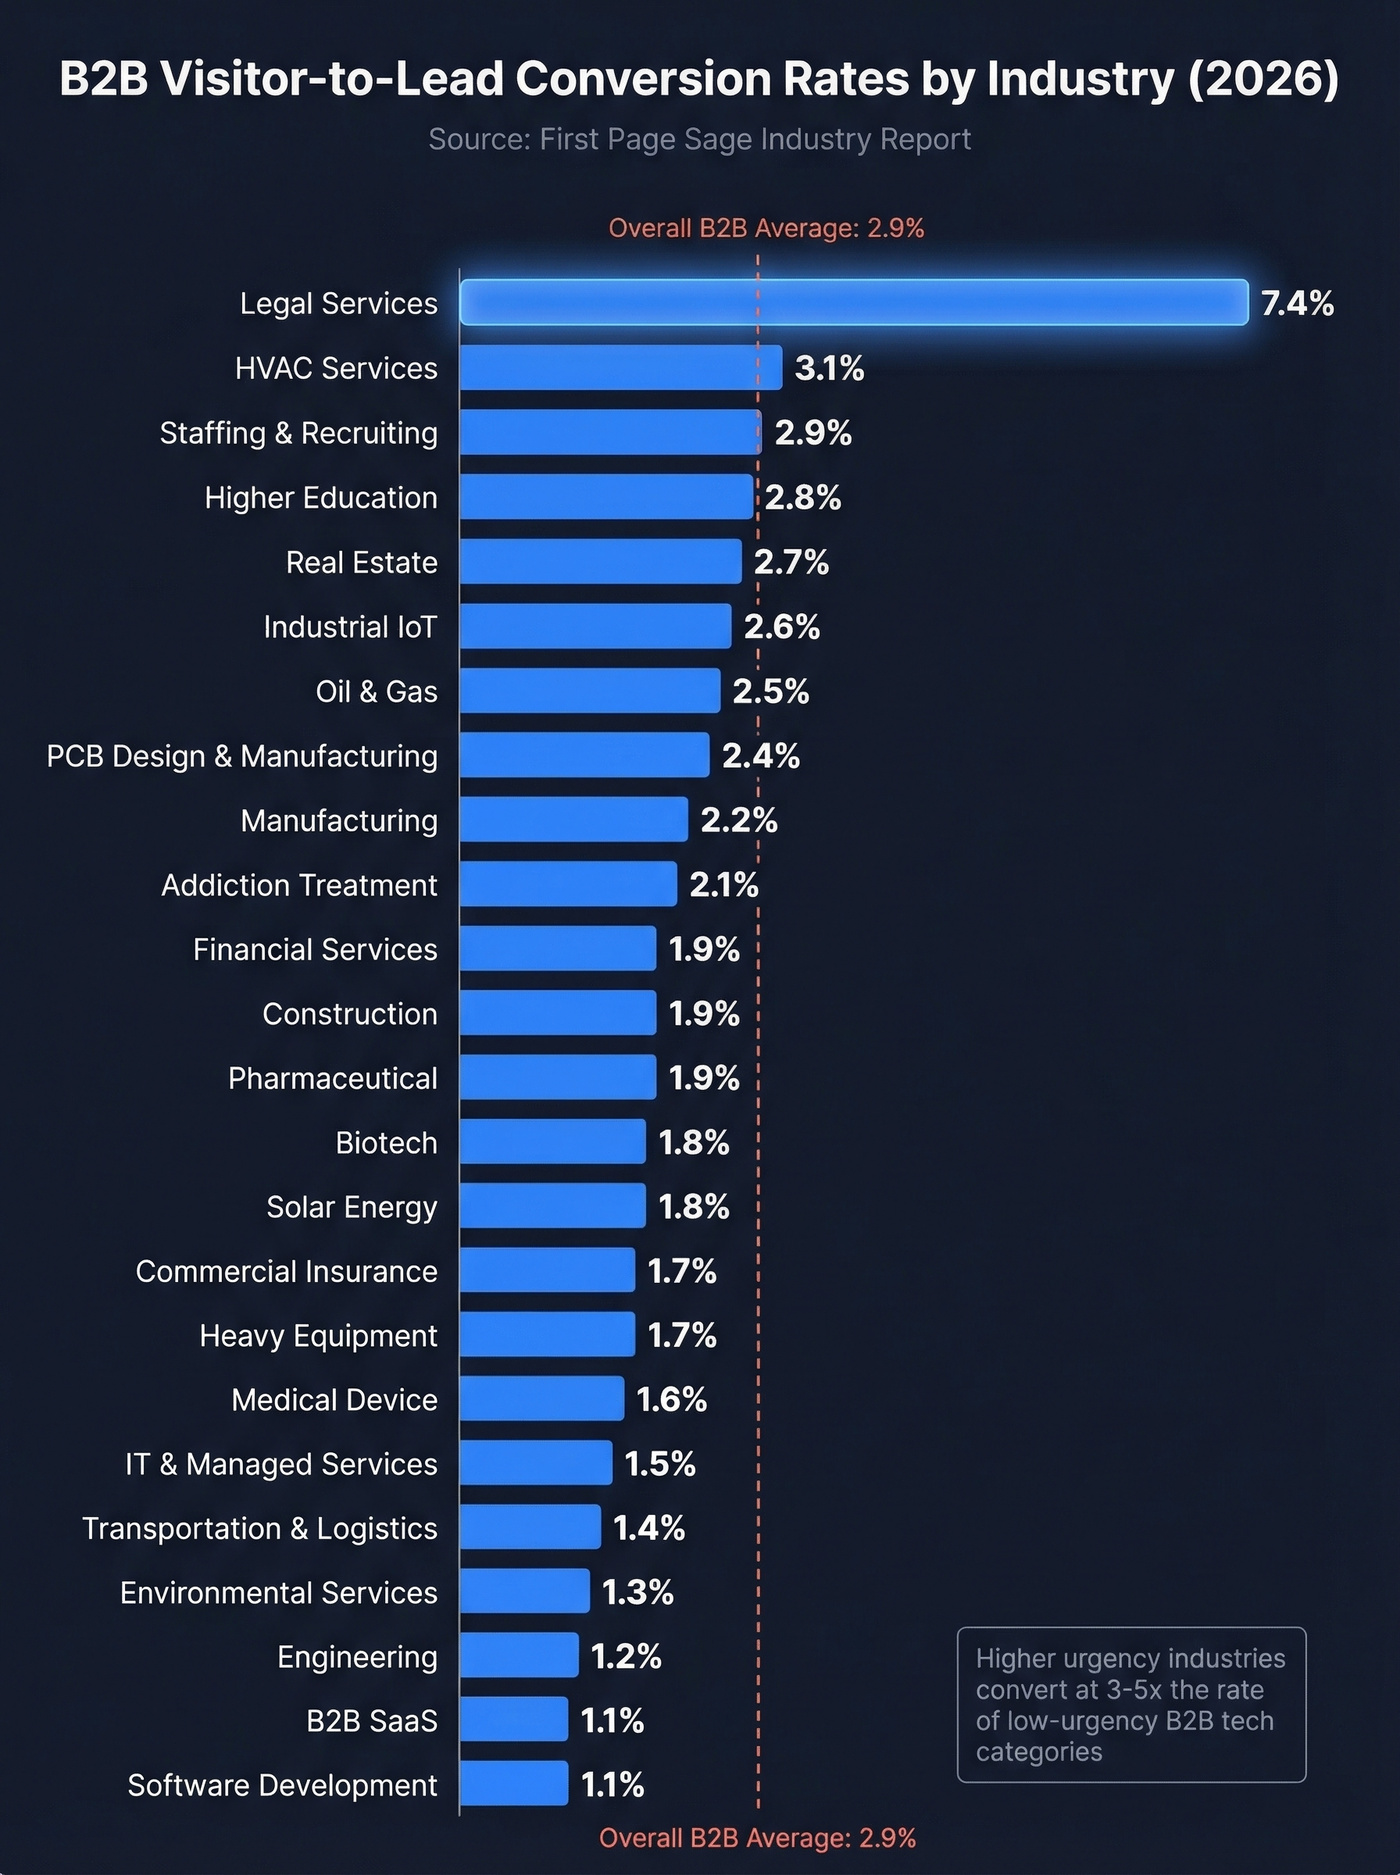
Visitor-to-lead rates vary wildly by vertical. The First Page Sage industry report shows just how wide the spread is:
| Industry | Visitor-to-Lead |
|---|---|
| Legal Services | 7.4% |
| HVAC Services | 3.1% |
| Staffing & Recruiting | 2.9% |
| Higher Education & College | 2.8% |
| Real Estate | 2.7% |
| Industrial IoT | 2.6% |
| Oil & Gas | 2.5% |
| PCB Design & Manufacturing | 2.4% |
| Manufacturing | 2.2% |
| Addiction Treatment | 2.1% |
| Financial Services | 1.9% |
| Construction | 1.9% |
| Pharmaceutical | 1.9% |
| Biotech | 1.8% |
| Solar Energy | 1.8% |
| Commercial Insurance | 1.7% |
| Heavy Equipment | 1.7% |
| Medical Device | 1.6% |
| IT & Managed Services | 1.5% |
| Transportation & Logistics | 1.4% |
| Environmental Services | 1.3% |
| Engineering | 1.2% |
| B2B SaaS | 1.1% |
| Software Development | 1.1% |
Why is legal so much higher than SaaS? Urgency and intent. Someone searching for a business attorney usually needs one now. Someone browsing a SaaS product page is six months from a purchase decision, comparing five vendors, and looping in three stakeholders. The lower your buyer's urgency, the lower your top-of-funnel conversion - and that's fine, as long as your mid-funnel rates compensate.
One poster on r/b2bmarketing shared that their cybersecurity marketing agency sees roughly 1% organic conversion, right in line with the benchmark range for most B2B tech categories. These industry-level numbers confirm that a "low" figure in one vertical can be perfectly healthy when viewed in the right context.
Benchmarks by Funnel Stage
This is where benchmarks get genuinely useful. Stage-by-stage rates from First Page Sage's funnel report show how leads compound down through the pipeline:
| Stage | B2B SaaS | Cybersecurity | eCommerce | Higher Ed |
|---|---|---|---|---|
| Lead to MQL | 39% | 24% | 23% | 45% |
| MQL to SQL | 38% | 40% | 58% | 46% |
| SQL to Opp | 42% | 43% | 66% | 61% |
| Opp to Won | 37% | 46% | 60% | 66% |
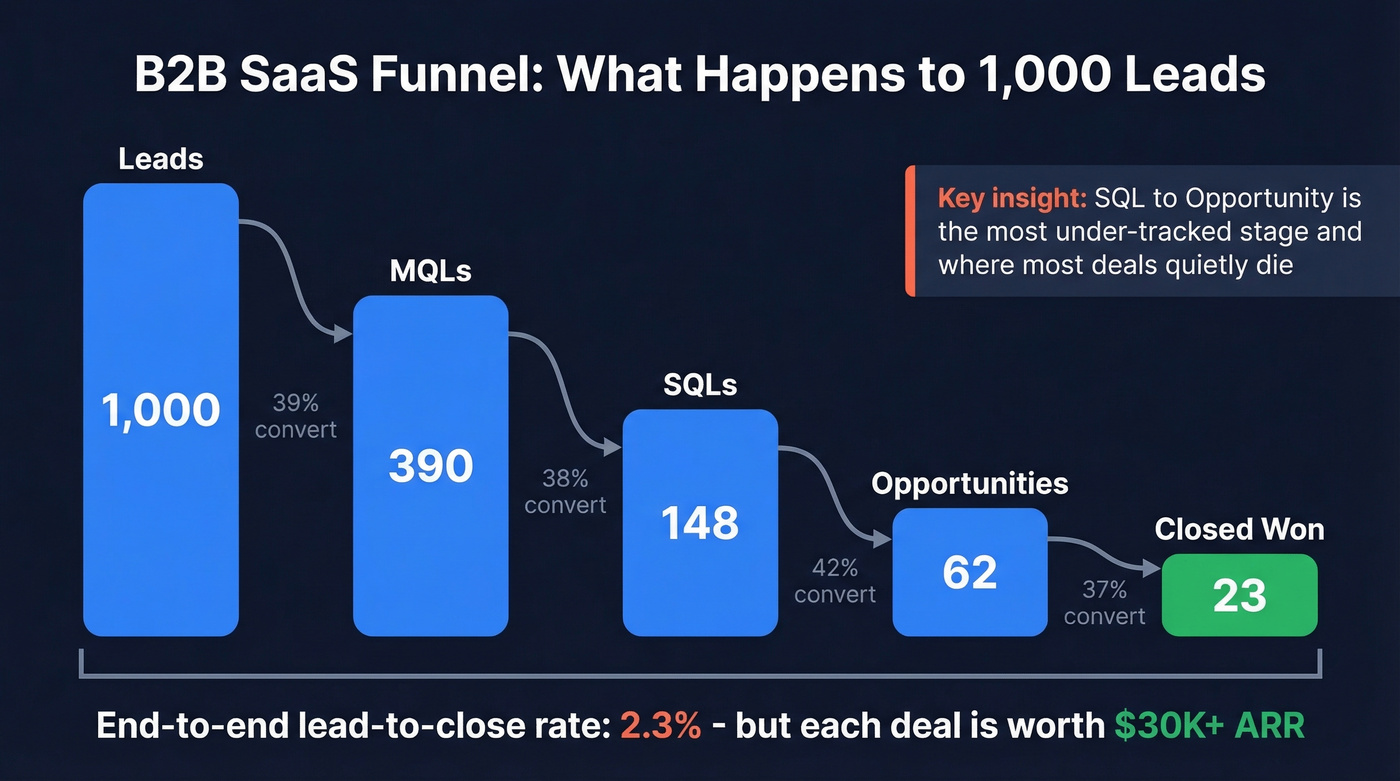
Let's run the math for B2B SaaS. Start with 1,000 leads: 390 become MQLs, 148 become SQLs, 62 become opportunities, and roughly 23 close. That's a 2.3% lead-to-close rate - which sounds terrible until you realize each deal is worth $30K+ ARR. Understanding the sales conversion rate at each stage helps you pinpoint exactly where deals stall.
RevenueHero's 2026 benchmark adds a critical mid-funnel data point: the median qualified-to-booked-meeting rate is 62%, with the top 10% hitting 78%+. If your qualified leads aren't converting to meetings at 60%+, the problem is routing and scheduling friction, not lead quality.
If you only track one metric, make it SQL-to-Opportunity. That's where sales execution meets pipeline reality, and it's a stage many teams under-instrument.
PLG Changes the Math Entirely
If you're running a product-led growth motion, the funnel stages above don't apply. PLG has its own conversion benchmarks, and they look nothing like sales-led numbers. Free trial to paid conversion runs 15-25% for well-optimized products. Freemium to paid is much lower at 5-10%, because the free tier attracts a broader, less purchase-ready audience. Activation rate sits at 25-40%.
Look, if your annual contract value is below $10K and you're running a sales-led motion with MQL handoffs and SDR qualification, you're probably leaving money on the table. PLG customer acquisition costs run under $200, while sales-led CAC ranges from $500 to $2,000+. The math favors self-serve at lower price points.
Every funnel stage you just benchmarked leaks when contact data is wrong. Bad emails tank your MQL-to-SQL rate. Wrong numbers kill your SQL-to-Opportunity rate. Prospeo delivers 98% email accuracy and 30% mobile pickup rates - so your pipeline math actually works.
Stop losing conversions to bad data at $0.01 per verified email.
Channel-Level Benchmarks
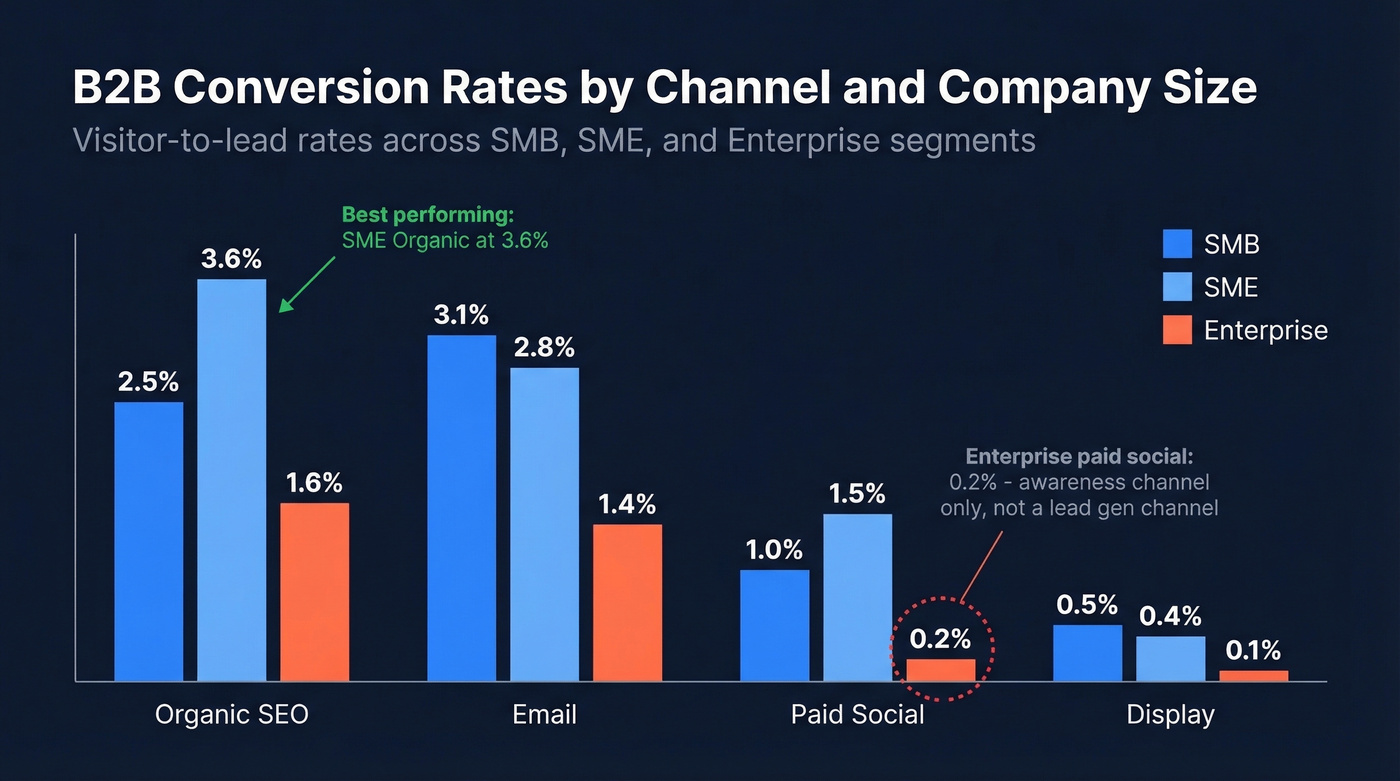
Not all traffic converts equally. First Page Sage's channel data breaks it down:
| Channel | Overall | SMB | SME | Enterprise |
|---|---|---|---|---|
| Organic (SEO) | 2.6% | 2.5% | 3.6% | 1.6% |
| 2.4% | 3.1% | 2.8% | 1.4% | |
| Direct | 1.9% | - | - | - |
| Organic Social | 1.7% | - | - | - |
| Paid Search | 1.5% | - | - | - |
| Paid Social | 0.9% | 1.0% | 1.5% | 0.2% |
| Display | 0.3% | 0.5% | 0.4% | 0.1% |
Organic converts nearly 3x better than paid social. If budget is limited, invest in SEO content first - it's not even close.
Email is the quiet overperformer, especially for SMBs at 3.1%. The enterprise column is striking, though. Enterprise paid social converts at 0.2%. Display at 0.1%. These channels can build awareness for enterprise buyers, but expecting them to generate leads directly is a losing bet.
One counterintuitive finding from Default's inbound benchmark data: sites with more than 25,000 monthly visitors often see visitor-to-demo request rates fall below 1%. More traffic doesn't mean more demos - broader traffic dilutes intent. If your visitor count is climbing but demo requests are flat, you don't have a conversion problem. You have a targeting problem.
How Company Size Changes Everything
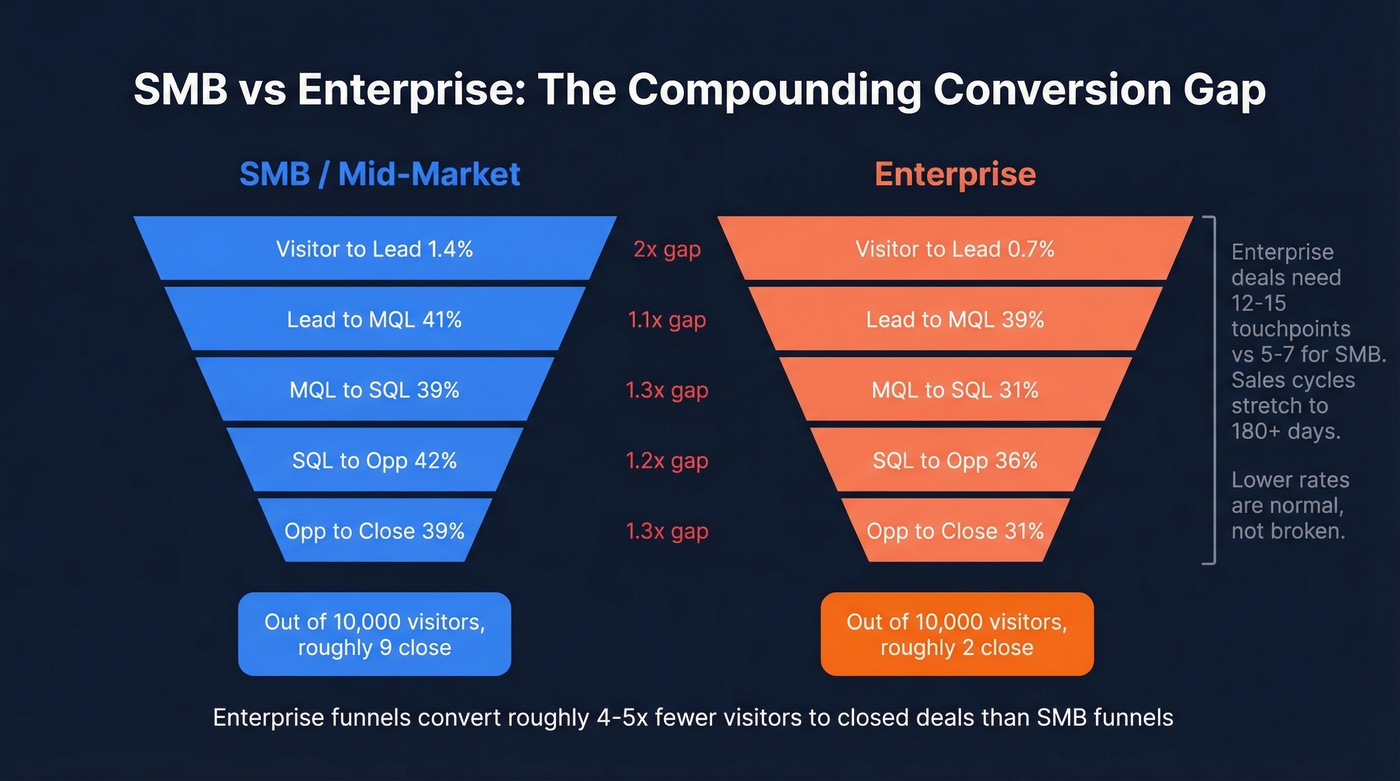
SMB and enterprise funnels behave like different sports entirely. The Digital Bloom benchmark compilation quantifies the gap:
| Stage | SMB / Mid-Market | Enterprise |
|---|---|---|
| Visitor to Lead | 1.4% | 0.7% |
| Lead to MQL | 41% | 39% |
| MQL to SQL | 39% | 31% |
| SQL to Opp | 42% | 36% |
| Opp to Close | 39% | 31% |
Enterprise rates are lower at every single stage. The compounding effect is brutal - an enterprise funnel converts roughly half as many visitors to closed deals as an SMB funnel.
The reason is complexity. Optifai's benchmark across 939 B2B companies found the average deal requires 8 touchpoints, but SMB deals need 5-7, mid-market 8-10, and enterprise 12-15. Sales cycles scale accordingly: sub-$20K ACV deals close in about 75 days, $20-60K deals take roughly 115 days, and $60K+ deals stretch to 180 days per ThriveStack's data. If you're selling enterprise and comparing your numbers to SMB benchmarks, you'll think your funnel is broken when it's actually performing normally.
RevenueHero's data adds another dimension: enterprise companies deliberately disqualify 71.2% of inbound leads, compared to just 21.8% for SMBs. Enterprise funnels don't just convert less - they filter harder. That's by design, not dysfunction.
One r/sales poster put it bluntly: they needed a 15% conversion rate on qualified opportunities to make their SMB/mid-market SaaS numbers work. That's a realistic target for SMB. Apply that same expectation to enterprise and you'll fire your entire sales team for underperforming.
Outbound Sales Benchmarks
Outbound has its own funnel, and the drop-offs look different from inbound. EngageTech's benchmarks paint the picture:
| Stage | Rate |
|---|---|
| Meeting booked to Attended | 67% |
| Meeting attended to SAL | 88% |
| SAL to Opportunity | 46% |
| Opp to Deal | 33% |
PhoneWagon's data puts it at roughly 100 dials per sale - a 1% dial-to-close rate. That's the reality of cold outbound.
These benchmarks assume clean data. If your email bounce rate is above 5%, your real conversion rate is lower than you think because you're dividing by a denominator full of dead addresses. We've seen teams celebrate a "3% reply rate" that's actually 2.1% when you account for the 30% of emails that never reached an inbox.
How to Actually Improve Your Rates
Benchmarks tell you where you stand. Here's what moves the numbers.
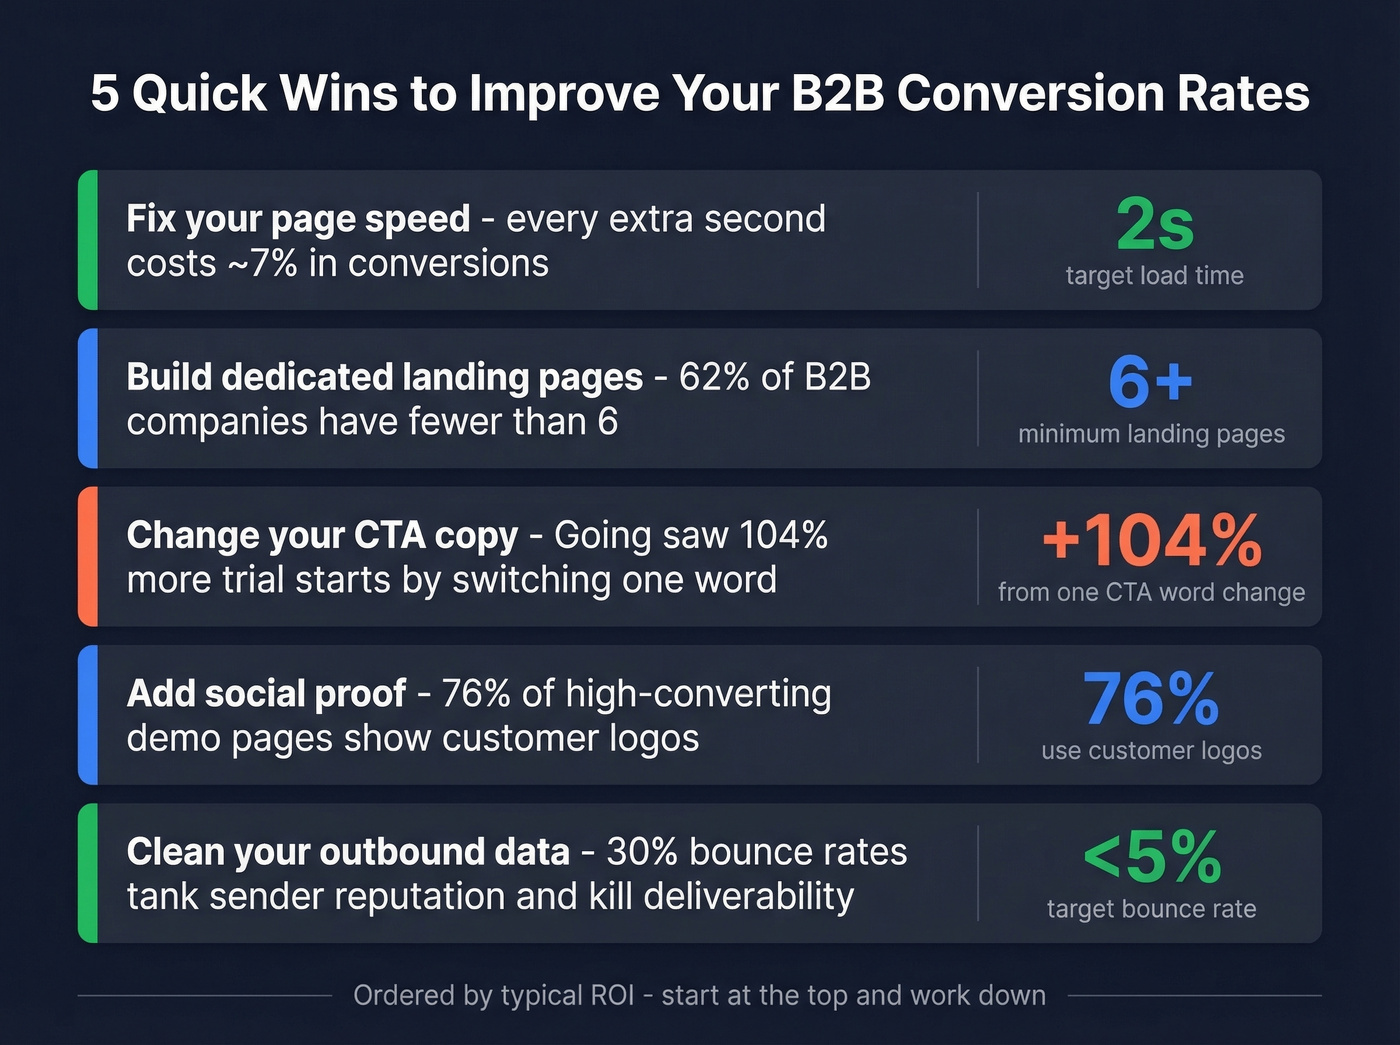
Fix Page Speed First
47% of users expect a page to load in 2 seconds. Every additional second of delay costs you roughly 7% in conversions. Before you A/B test headlines or redesign your demo page, check your Core Web Vitals. This is the highest-ROI fix most B2B sites ignore because it feels like an engineering problem, not a marketing one.
Build More Landing Pages
MarketingSherpa found that 62% of B2B companies have fewer than 6 landing pages. That's a problem, because dedicated landing pages consistently outperform generic product pages. In one Unbounce case study, Later hit roughly 60% conversion rates on gated content landing pages and generated 100,000+ leads - largely because each piece of content got its own optimized page instead of pointing to a catch-all form.
Add social proof while you're at it. RevenueHero's data shows 76% of high-converting demo pages display customer logos and 57% feature testimonials. If your landing page has neither, that's a quick win.
Change Your CTA Copy
Small words, big impact. "Book a Demo" and "Schedule a Demo" outperform "Request a Demo" and "Submit." Going saw a 104% increase in premium trial starts just by changing CTA copy from "Sign up for free" to "Trial for free." Test your CTA text before you test anything else. It's the cheapest experiment you can run.
Stop Obsessing Over Form Fields
Here's a counterintuitive finding from RevenueHero's 1M+ submission dataset: 2-field forms convert at 77%, and 13-field forms convert at 76%. The difference is negligible. What matters isn't field count - it's whether those fields enable better routing and personalization downstream. If an extra field lets you route enterprise leads to the right AE instantly, it's worth adding.
Clean Your Outbound Data
Data quality is the hidden variable killing most outbound conversion rates. If 30% of your emails bounce, your sender reputation tanks and deliverability drops for every subsequent campaign. We've watched teams optimize sequences, test subject lines, and rewrite copy while sitting on a list that's 30% invalid. All that effort, wasted on contacts that don't exist.

The Snyk team learned this the hard way. Their bounce rates ran 35-40% before switching to Prospeo's 7-day refresh cycle and verified contact data. After the switch, bounces dropped under 5%, AE-sourced pipeline jumped 180%, and they generated 200+ new opportunities per month across 50 AEs. Verifying 5,000 emails costs about $50. Sending 5,000 unverified emails and bouncing 30% costs you your domain reputation - and that's a hole that takes months to dig out of.
Skip this step if you're purely inbound. But if outbound is any part of your pipeline, data hygiene isn't optional - it's the foundation everything else sits on.
Where These Benchmarks Are Heading
As AI-driven personalization and intent-based targeting mature, expect these benchmarks to shift upward. Static forms and generic CTAs are already being replaced by dynamic experiences that adapt to visitor behavior in real time. Some forecasts project the average website conversion rate will climb closer to 20-50% in the next few years. We're not there yet, but if your current rates sit below the benchmarks above, the gap will only widen.
Email converts at 3.1% for SMBs - the highest of any channel. But only if you're reaching real inboxes. Prospeo's 5-step verification and 7-day data refresh keep bounce rates under 4%, turning your best-converting channel into a reliable pipeline engine.
Turn your highest-converting channel into your most reliable one.
FAQ
What is a good B2B conversion rate?
For visitor-to-lead, 2.9% is the cross-industry average, but B2B SaaS sits at 1.1% while legal services hits 7.4%. For MQL-to-SQL, 35-45% is typical. Always compare against your industry and funnel stage - the tables above give you a more accurate target than any single number.
Why are B2B conversion rates lower than B2C?
B2B purchases involve multiple decision-makers, longer sales cycles of 75-180 days, and higher price points. The average deal requires 8 touchpoints. B2C buyers often convert in a single session, which is why B2B trails B2C across nearly every channel.
How does data quality affect outbound conversion rates?
A 30%+ bounce rate tanks sender reputation and kills deliverability for every subsequent campaign. Keeping bounces under 5% through verified data ensures your metrics reflect real engagement rather than phantom contacts. In our experience, this single fix moves outbound reply rates more than any copy change.
Where can I find benchmarks for my specific industry?
The industry table in this guide covers 24 verticals. For more granular data, check First Page Sage's annual report and Ruler Analytics' benchmark tool - both segment by industry, channel, and company size so you can compare against peers rather than a meaningless cross-industry average. RevenueHero's inbound benchmarks are also worth bookmarking for mid-funnel data.