50+ B2B Marketing Statistics for 2026 - Every Stat Sourced and Dated
You're building a board deck. Or justifying headcount. Or trying to convince your CFO that marketing deserves a bigger slice of a budget that's already under pressure. So you search for B2B marketing statistics and get a wall of unsourced numbers from 2021. That "91% of B2B companies use content marketing" stat? No sample size, no survey date, no definition of what counts as "content marketing."
We got tired of citing numbers we couldn't defend in a meeting. Every stat below includes a source, sample size or dataset description, and date. If a number comes from a Reddit practitioner, you'll know. If it's a vendor survey, you'll see the methodology.
The Stats That Actually Matter
If you're building a board deck or justifying budget, these are the numbers worth citing.
| Stat | Source | Sample / Dataset | Year |
|---|---|---|---|
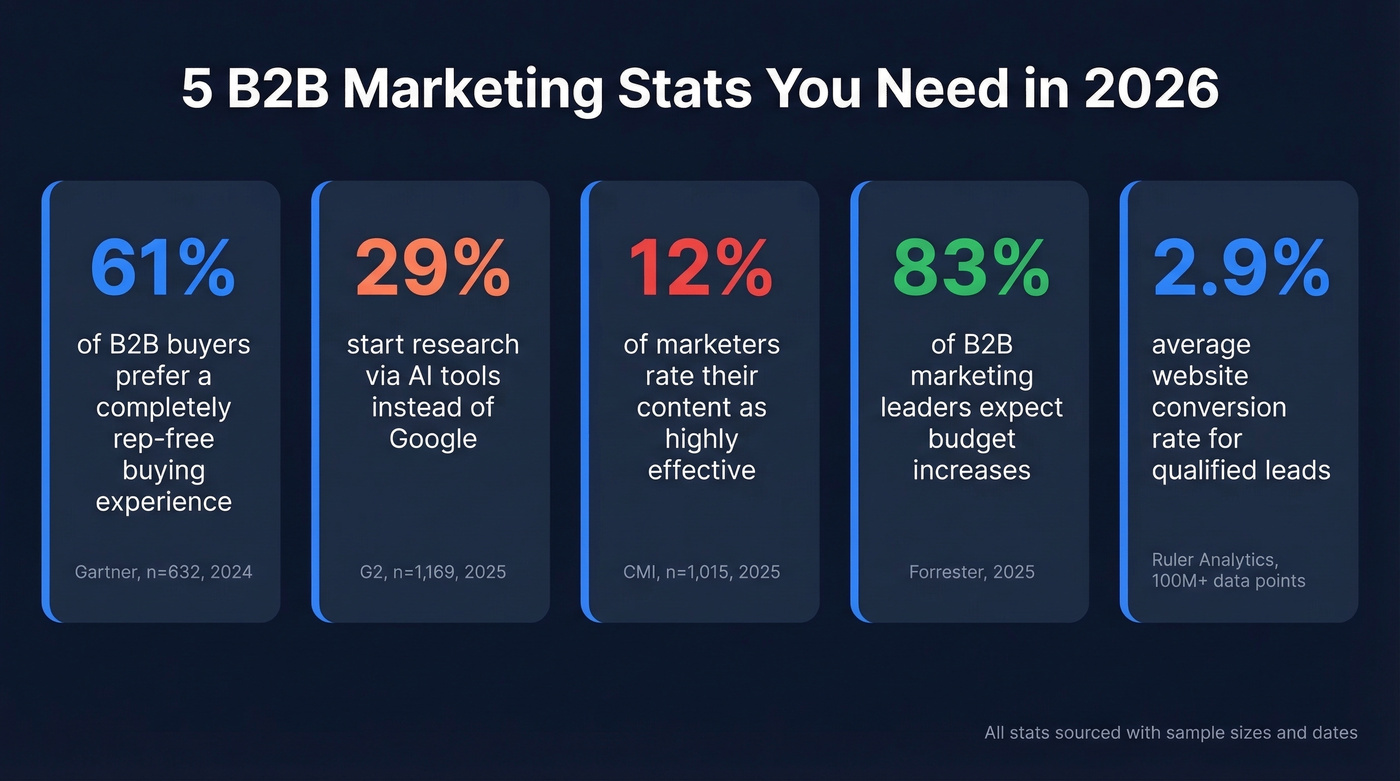
| 61% prefer rep-free buying | Gartner | n=632 buyers | 2024 (fielded Aug-Sep) |
| 29% start research via AI over Google | G2 | n=1,169 decision-makers | 2025 (fielded Apr) |
| Only 12% rate content highly effective | CMI | n=1,015 marketers | 2026 insights (released Oct 2025) |
| 83% expect budget increases | Forrester | Budget Planning Survey (NA/EU/APAC) | 2025 (for 2026 planning) |
| Website CVR: 2.9% | Ruler Analytics | 100M+ data points | 2025 |
| Lead-to-MQL rate: 31% | First Page Sage | Agency dataset | 2025 |
| Email open rate: 43.46% median | MailerLite | 3.6M campaigns / 181k accounts | 2025 (Dec 2024-Nov 2025) |
| Sales cycle: 10.1 months | Corporate Visions (citing 6sense) | Aggregated/proprietary data | 2025 |
| 73% avoid irrelevant outreach | Gartner | n=632 buyers | 2024 (fielded Aug-Sep) |
| B2B ecommerce: $36.16T projected | SellersCommerce | Market research roundup | 2026 |
B2B Market Size & Growth
The B2B ecommerce market hit an estimated $32.11T in 2025, with projections pushing to $36.16T in 2026 at a 14.5% CAGR.
B2B transactions are bigger, more complex, and increasingly happening without a sales rep in the loop - which reshapes where marketing dollars need to go. The companies capturing this growth aren't just running ads. They're building buying experiences that work without human intervention, and if your marketing strategy still assumes a rep will close the gap between a mediocre website and a signed contract, you're betting against the trajectory of a $36 trillion market.
B2B Marketing Budget Statistics
Here's the thing about 2026 budgets: they're going up, but not uniformly. Forrester's Budget Planning Survey found 83% of B2B marketing decision-makers expect increased investment over the next 12 months. The regional picture tells a more nuanced story.
| Region | Marketing as % of Revenue | % Expecting 5%+ Increase |
|---|---|---|
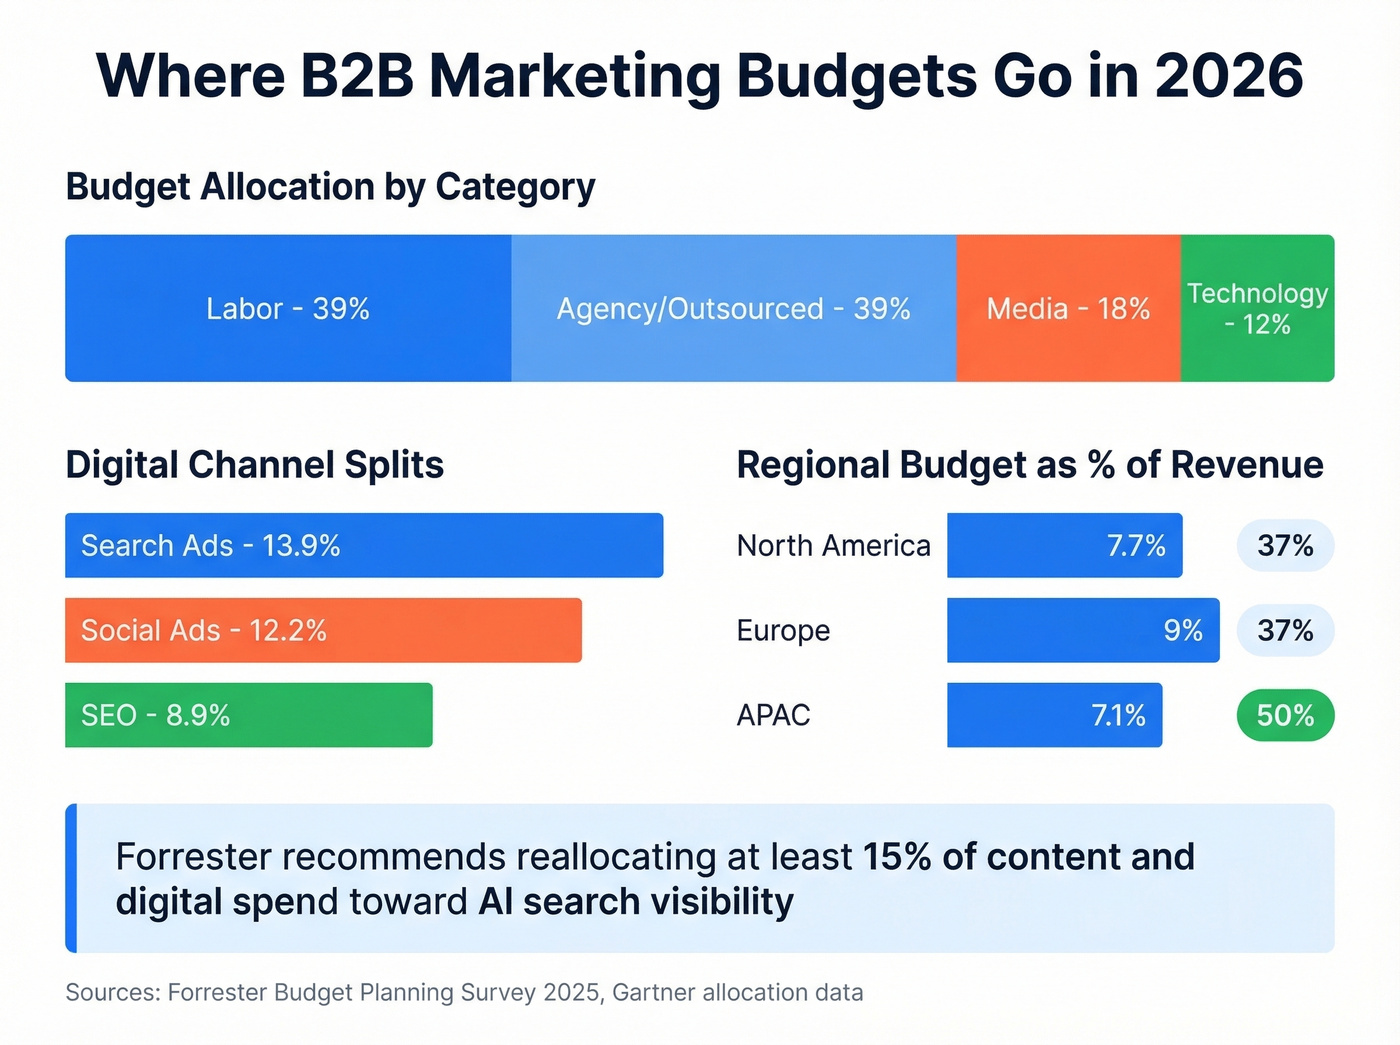
| North America | ~7.7% | 37% |
| Europe | ~9% | 37% |
| APAC | 7.1%+ | ~50% |
A widely cited Gartner-based allocation breakdown shows where those dollars land. Note that categories overlap since some spend falls into multiple buckets: roughly 39% on labor, 39% on outsourced agency services, 18% on media, and 12% on technology. The digital channel splits are telling too - search ads take 13.9%, social ads 12.2%, and SEO 8.9%.
The most forward-looking signal comes from Forrester's recommendation to reallocate at least 15% of content and digital spend toward AI search visibility - modular content, schema markup, expert profile optimization. That's not a small shift.
Carilu Dietrich's conversations with dozens of CMOs point in the same direction: marketing budgets are down as a percentage of revenue, but tech budgets within marketing are climbing 2-3% year-over-year. Headcount is frozen rather than cut. The money is moving from people to platforms. BCG's research on B2B waste reinforces this - their analysis found that a significant share of marketing spend is lost to inefficiency, poor targeting, and misaligned channels, which helps explain why leaders are shifting dollars toward automation and data infrastructure.
Buyer Behavior in 2026
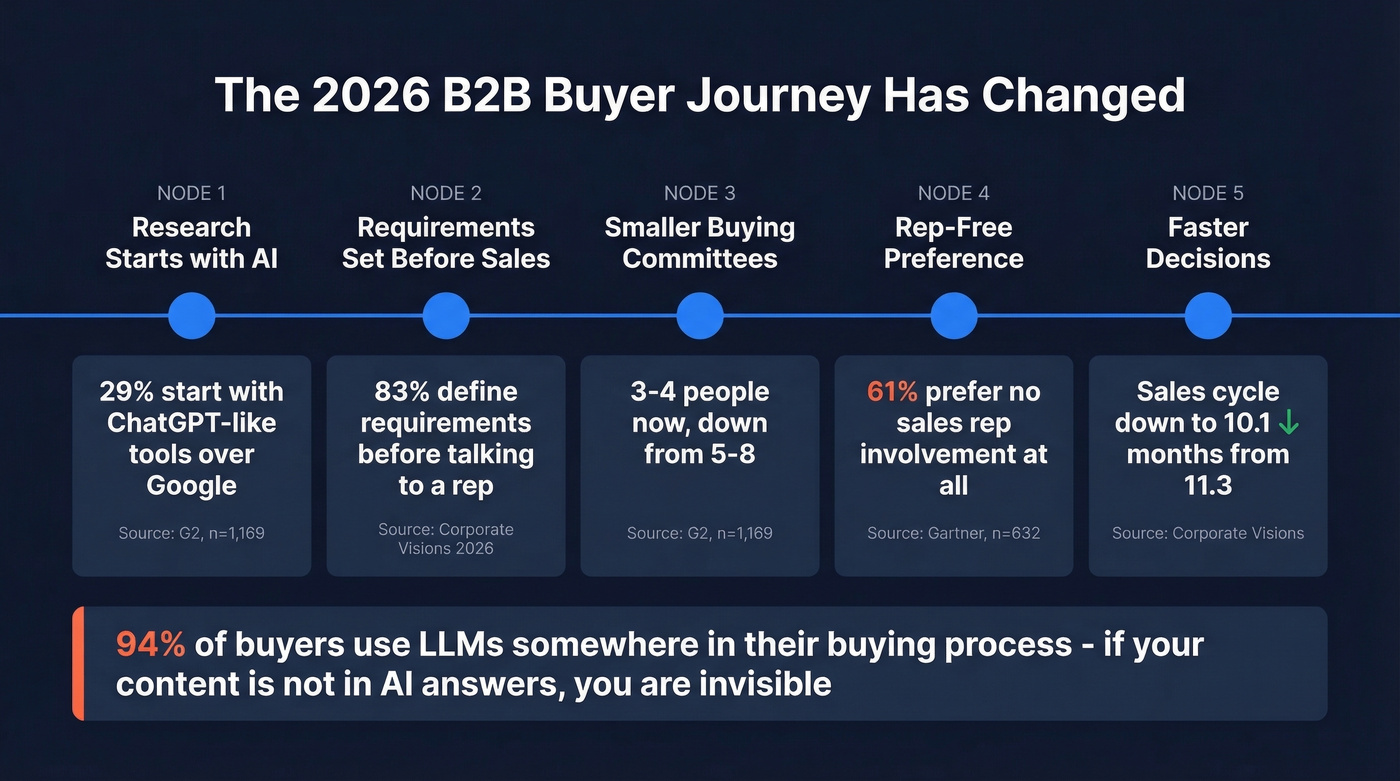
Gartner's survey of 632 B2B buyers, fielded between August and September 2024, produced the stat that should be on every sales leader's wall: 61% of B2B buyers prefer an overall rep-free buying experience. Not "prefer digital for early research." Rep-free for the entire journey.
That same survey found 73% of buyers actively avoid suppliers who send irrelevant outreach, and 69% report inconsistencies between what a company's website says and what sellers tell them. If your marketing and sales aren't aligned on messaging, buyers notice - and they walk.
The buying committee is shrinking too. G2's survey of 1,169 B2B decision-makers shows the once-dominant 5-8 member committees are giving way to 3-4 person groups for software decisions. Smaller committees move faster, but each stakeholder carries more weight. G2 also found 57% of buyers anticipate spending more on technology and software next year, an 8-point jump from 2024, and IT is now involved in nearly 50% of purchase decisions.
Sales cycles are compressing. Corporate Visions' 2026 buying behavior roundup puts the average B2B sales cycle at 10.1 months in 2025, down from 11.3 months in 2024. First contact has moved from 69% of the journey to 61%, 83% of buyers define requirements before speaking to sales, and 94% use LLMs somewhere in their buying process.
If your content doesn't show up in AI-generated answers, you're invisible during the phase where buyers are actually making decisions.
Content Marketing Effectiveness
The lazy stat you'll see everywhere: "91% of B2B companies use content marketing." It tells you nothing. Adoption isn't the problem - effectiveness is.
The CMI 2026 report surveyed 1,015 B2B marketers and painted a more honest picture. Only 12% rated their content marketing as highly effective over the past 12 months. Another 47% said "somewhat effective." That means roughly 4 in 10 marketers are neutral or negative about their own content programs.
Among the teams that are working, the top drivers aren't surprising but they're worth internalizing: content relevance and quality at 65%, team skills and capabilities at 53%, and sales alignment at 45%. Technology ranked fourth at 43%. CMI's framing for 2026 is fundamentals-first - AI supports execution but doesn't replace capability. We've watched this play out at multiple companies: teams that buy AI writing tools before fixing their content strategy just produce mediocre content faster.
Only 12% of B2B marketers rate their content highly effective - and misaligned targeting is the top reason. Prospeo's 300M+ profiles with 30+ filters (intent data, technographics, job changes) let you reach the exact buyers your content was built for. 98% email accuracy means your campaigns actually land.
Stop wasting budget on bad data. Start with 75 free verified emails.
Email Marketing Benchmarks
Email benchmarks are a minefield of bad data. We've seen articles cite "80% open rates" for B2B email with zero methodology. Let's use numbers that actually hold up.
MailerLite's 2025 benchmarks draw from 3.6M campaigns across 181,000 accounts, spanning December 2024 through November 2025. They report median performance: 43.46% open rate, 2.09% click rate, 6.81% click-to-open rate, and 0.22% unsubscribe rate. They use medians, not averages, which is methodologically stronger for skewed distributions.
PoweredBySearch's numbers corroborate this: 42.35% open rate, 2.00% click rate. Close enough to trust the range.
The Apple Mail Privacy Protection caveat matters here. Apple pre-fetches email content, inflating open rates across the board. Every sender is affected equally, so the benchmarks are still useful for relative comparison - but don't treat a 43% open rate as meaning 43% of humans read your email. For B2B tech specifically, the conversion rate from email to qualified action sits around 2.5%.
Lead Generation & Conversion
Ruler Analytics analyzed 100M+ data points across 14 industries and found an average website conversion rate of 2.9%. They define conversion as a qualified lead, not just a form fill. That distinction matters enormously - if your conversion rate looks higher than 2.9%, check whether you're counting newsletter signups and content downloads as "conversions."
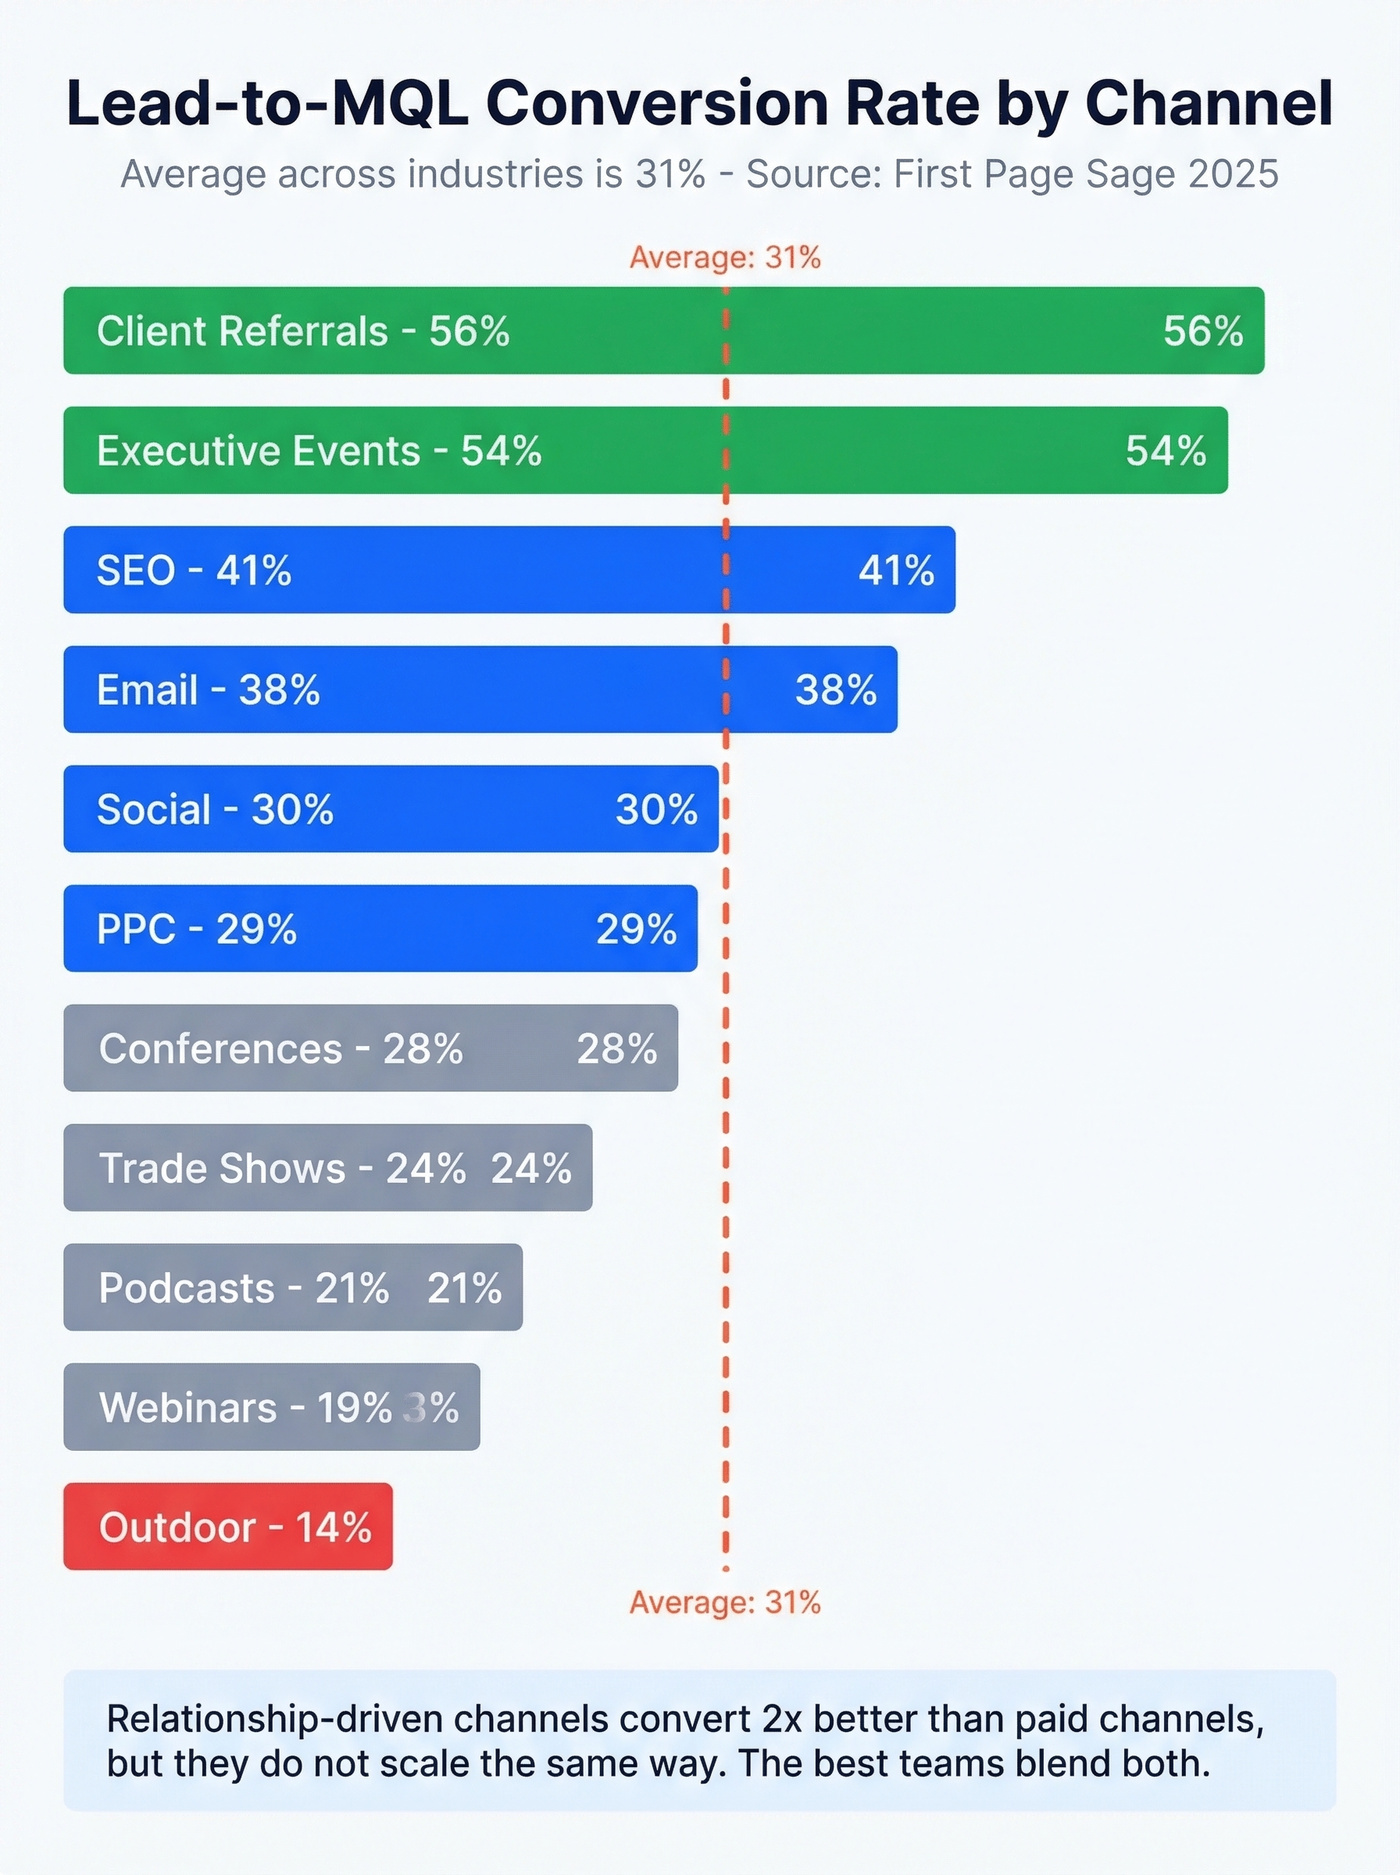
The funnel gets more interesting at the lead-to-MQL stage. First Page Sage reports an average lead-to-MQL conversion rate of 31%, with massive variation by channel:
| Channel | Lead-to-MQL Rate |
|---|---|
| Client referrals | 56% |
| Executive events | 54% |
| SEO | 41% |
| 38% | |
| Social | 30% |
| PPC | 29% |
| Conferences | 28% |
| Trade shows | 24% |
| Podcasts | 21% |
| Webinars | 19% |
| Outdoor | 14% |
Industry variation is just as dramatic:
| Industry | Lead-to-MQL Rate |
|---|---|
| Biotech | 42% |
| B2B SaaS | 39% |
| Cybersecurity | 39% |
| Manufacturing | 26% |
| IT & Managed Services | 25% |
Skip the channel optimization if your underlying data is broken. A 31% lead-to-MQL rate assumes those leads have valid contact data. Prospeo's enrichment returns a 92% API match rate with 50+ data points per contact, which means your conversion benchmarks are built on clean records rather than bounced emails and disconnected numbers. If you're evaluating vendors, start with a clear view of data enrichment services and how they define match rates.
Channel Performance
Stop me if this sounds familiar: your team runs a LinkedIn campaign, the CPC looks brutal, and someone on the leadership team asks why you're "wasting money on LinkedIn."
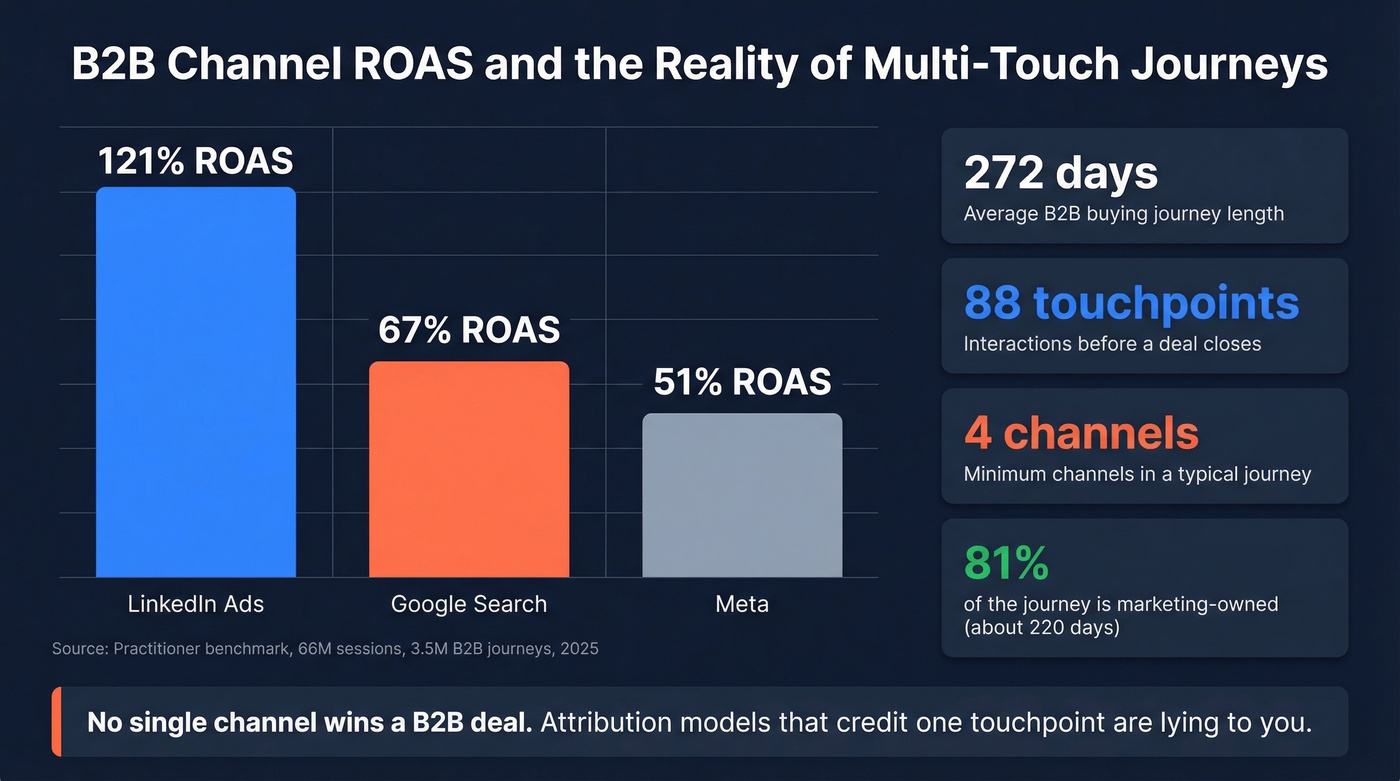
That framing is wrong. A practitioner on r/LinkedinAds shared a detailed benchmark based on 66M sessions across 3.5M B2B customer journeys. Treat these as a practitioner benchmark, not industry gospel - but the numbers are worth flagging:
- LinkedIn Ads: 121% ROAS
- Google Search: 67% ROAS
- Meta: 51% ROAS
- Average journey: 272 days, 88 touchpoints, 4 channels, 10 stakeholders
- Marketing "owns" ~81% of the journey (~220 days)
Those 88 touchpoints across 272 days should reframe how you think about attribution. No single channel "wins" a B2B deal. The budget data reflects this reality - search ads take 13.9% of digital budgets, social ads 12.2%, and SEO 8.9%. The spread is intentional. If you're trying to operationalize this, it helps to map your funnel metrics to the buying journey instead of channel-by-channel vanity KPIs.
AI Adoption in B2B Marketing
G2's survey found 29% of B2B decision-makers now start research via ChatGPT-like tools more often than Google. That's not a trend. It's a structural shift in how buyers discover vendors.
Trust in AI tools is climbing fast. Corporate Visions' 2026 buying behavior roundup says 80% of buyers trust AI tools at least sometimes, up 19 points year-over-year. It also cites 72% encountering Google AI Overviews during their research, with 90% clicking at least one cited source. On the buyer side, 89% now specifically seek solutions with AI features built in.
On the vendor side, SellersCommerce's stats roundup lists AI adoption across operations: 67% use AI for product recommendations and 42% for pricing optimization and customer segmentation. Forrester's recommendation to reallocate 15% of content and digital spend toward AI search visibility isn't aspirational - it's catching up to where buyers already are. If you're building pipeline from this shift, align AI visibility with lead generation trends rather than treating it as a standalone SEO project.
Why These Benchmarks Can Mislead
A thread on r/b2bmarketing captured something that benchmark articles never address: B2B marketing increasingly feels like systems engineering. Broken enrichment, misrouted leads, late intent signals, automation workflows that don't match reality. Campaign performance drops when upstream systems are wrong, and more tools means more integration failure points.
The measurement problem runs deep. LinkedIn B2B Institute found that 42% of lead-gen marketers still use CPC as their primary ROI metric - that's measuring the wrong thing entirely. CPC tells you what a click costs, not what it produces. Another 52% of marketers focus primarily on reach and frequency. The Forbes B2B benchmarking analysis emphasizes going beyond these surface-level metrics for exactly this reason.
The downstream consequences are severe. 86% of B2B purchases stall, and 81% of buyers end up dissatisfied with the provider they chose. These aren't marketing failures - they're data and alignment failures that compound through the funnel.
Your conversion rate is a data quality problem before it's a strategy problem. If 35% of your email list bounces, every downstream metric - open rates, click rates, MQL conversion - is built on garbage. In our experience, the single biggest lever for improving conversion benchmarks is upstream data quality, not campaign optimization. Prospeo's 98% email accuracy and 7-day refresh cycle exist because stale data cascades through your entire funnel. Your benchmarks mean nothing if a third of your contacts aren't reachable. If you're diagnosing this, start with email bounce rate and work backward into list sources and verification.

Sales cycles dropped from 11.3 to 10.1 months - but only for teams reaching real decision-makers early. With 83% of buyers defining requirements before talking to sales, your outbound data has to be current. Prospeo refreshes every 7 days, not every 6 weeks like the industry average.
Reach buyers while they're still deciding, not after they've signed elsewhere.
FAQ
What percentage of revenue should B2B companies spend on marketing?
Most B2B companies spend 7-10% of revenue on marketing. Gartner's 2026 benchmark puts the average at 7.7%, while Deloitte's sits at 9.1%. Early-stage companies often invest 15-20%; mature enterprises trend closer to 5-8%. These figures vary significantly by industry, growth stage, and region, so treat any single number as a starting point rather than a target.
What's the average B2B website conversion rate?
The average is 2.9% across 14 industries, based on Ruler Analytics' analysis of 100M+ data points. They define conversion as a qualified lead, not a form fill - making this benchmark more conservative and more useful than inflated numbers you'll find elsewhere.
How do you verify B2B marketing stats are reliable?
Check three things: sample size, survey date, and how key terms are defined. A stat drawn from 100M data points is more trustworthy than one from an unnamed "industry report." Also validate your own data - if your email list has a 20% bounce rate, your internal benchmarks are built on flawed numbers. Clean contact data is the foundation everything else sits on.