Bottom-Up Forecasting: How to Build a Forecast You Can Actually Defend
Four in five sales and finance leaders missed a quarterly forecast in the past year. Over half missed two or more. And 66% say their reporting systems can't even access the historical CRM data they'd need to do better. That's not a forecasting problem - it's a foundation problem.
This is the practitioner's operating manual for bottom-up forecasting: the actual build process, industry-specific driver trees, accuracy benchmarks, and the pitfalls that turn a promising model into a fiction factory. If you're an FP&A analyst with 10 days to deliver a board deck or a founder prepping for a Series A, start with the step-by-step section and work outward.
What Is Bottom-Up Forecasting?
Bottom-up forecasting starts at the unit level and builds upward. Instead of saying "the market is $10 billion and we'll capture 1%," you're answering a much harder question: how will customers actually find you, and how many will buy?
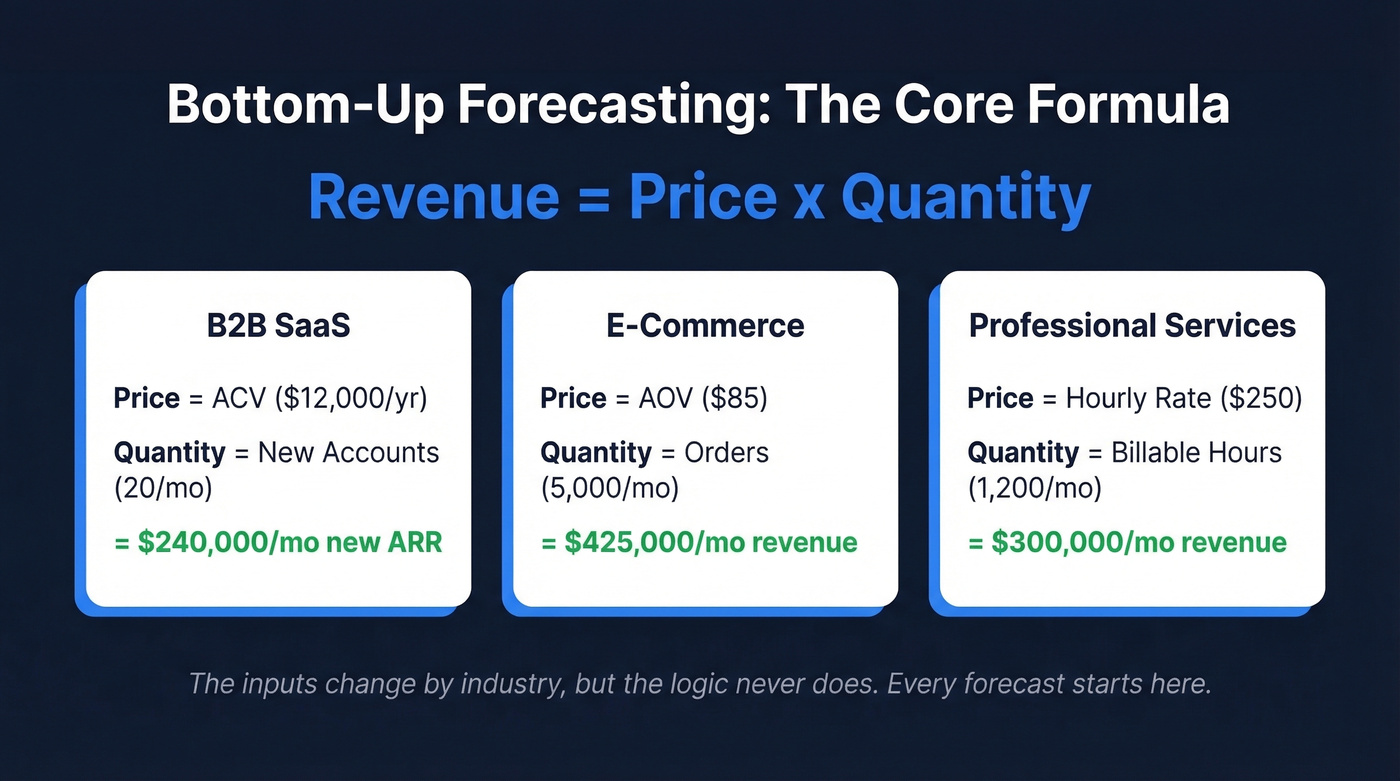
The core formula is Revenue = Price x Quantity. For a SaaS company, that's ACV x new accounts. For an e-commerce brand, it's AOV x orders. For a consulting firm, it's hourly rate x billable hours. The inputs change by industry, but the logic doesn't.
Practitioners prefer this approach because it forces you to defend every assumption. "We'll capture 1% of TAM" is a number pulled from thin air - untethered from an acquisition plan, a conversion rate, or a capacity constraint. A bottom-up forecast makes you answer "what's your customer acquisition strategy?" before you project a single dollar. That discipline is what makes the output defensible, and it's why investors and board members trust it more than a top-down guess dressed up in a spreadsheet.
Bottom-Up vs. Top-Down
These aren't competing methods. They answer different questions.
| Criteria | Favors Top-Down | Favors Bottom-Up |
|---|---|---|
| Business maturity | Pre-revenue | 2+ quarters of data |
| Market stability | Stable, predictable | Volatile, shifting |
| Sales cycle | Short, transactional | Long, complex |
| Product portfolio | Single product | Diverse lines |
| Data availability | Market research only | Rich CRM/activity data |
| Planning horizon | 1-3 year strategic | Next quarter operational |
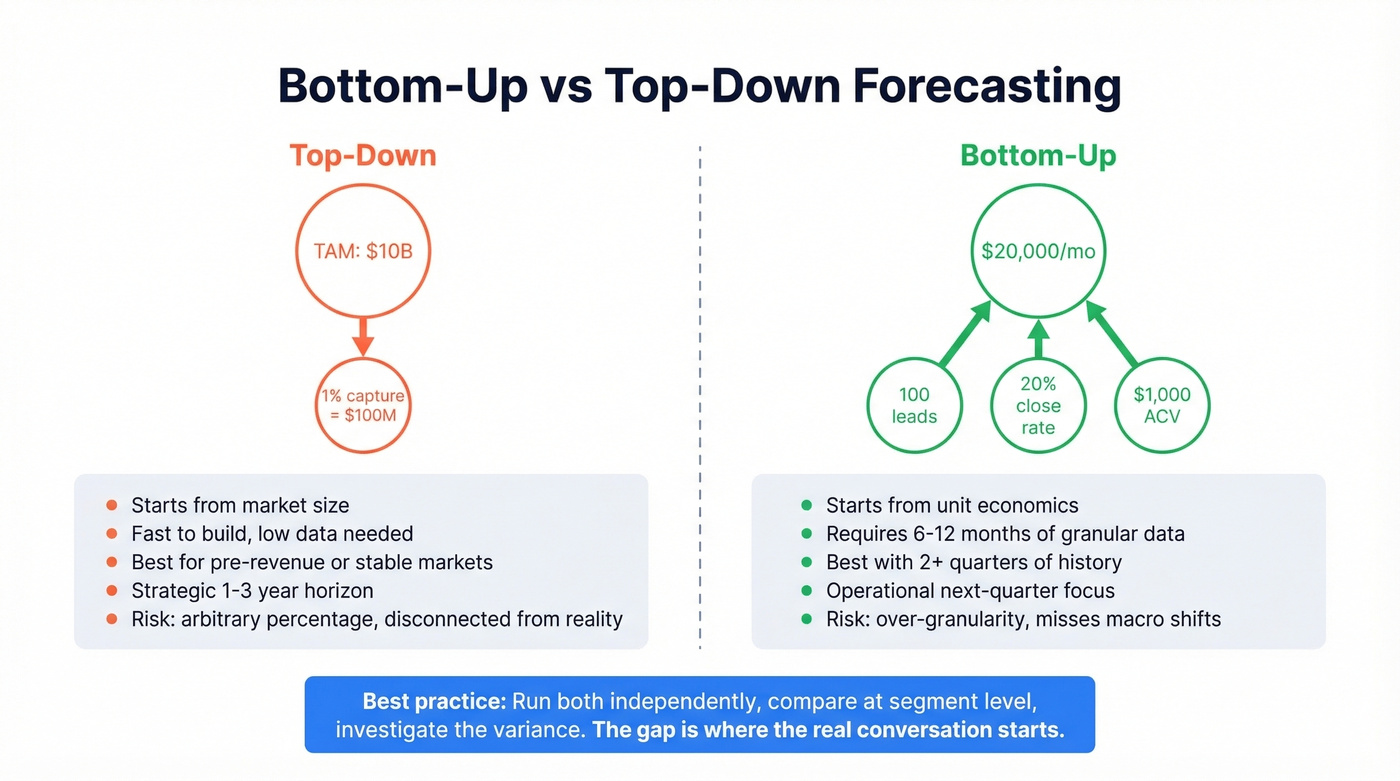
Top-down works when you need a directional number fast and don't have granular data. Bottom-up works when you need a number you can actually operate against - one that connects to headcount plans, marketing budgets, and quota assignments. In volatile markets, unit-level forecasting gives you faster signal detection because you're watching individual driver changes rather than waiting for market-level data to shift.
Here's the thing: hybrid approaches outperform single-method forecasts because they reconcile market targets with pipeline reality. Run both forecasts independently, compare them at the segment level, investigate the variances, and choose the method that best fits each segment. If your top-down says $5M and your bottom-up says $3.2M, that $1.8M gap is where the real conversation starts. It usually reveals either an unrealistic market assumption or a pipeline problem you haven't addressed.
The consensus on r/EntrepreneurRideAlong is blunt about pure top-down: the "we'll capture 1% of TAM" approach gets torn apart by anyone who's actually built a business, because the percentage is arbitrary and disconnected from how customers actually buy.
How to Build a Bottom-Up Sales Forecast
Six steps, with a worked example. This is the process we've seen work across dozens of planning cycles.
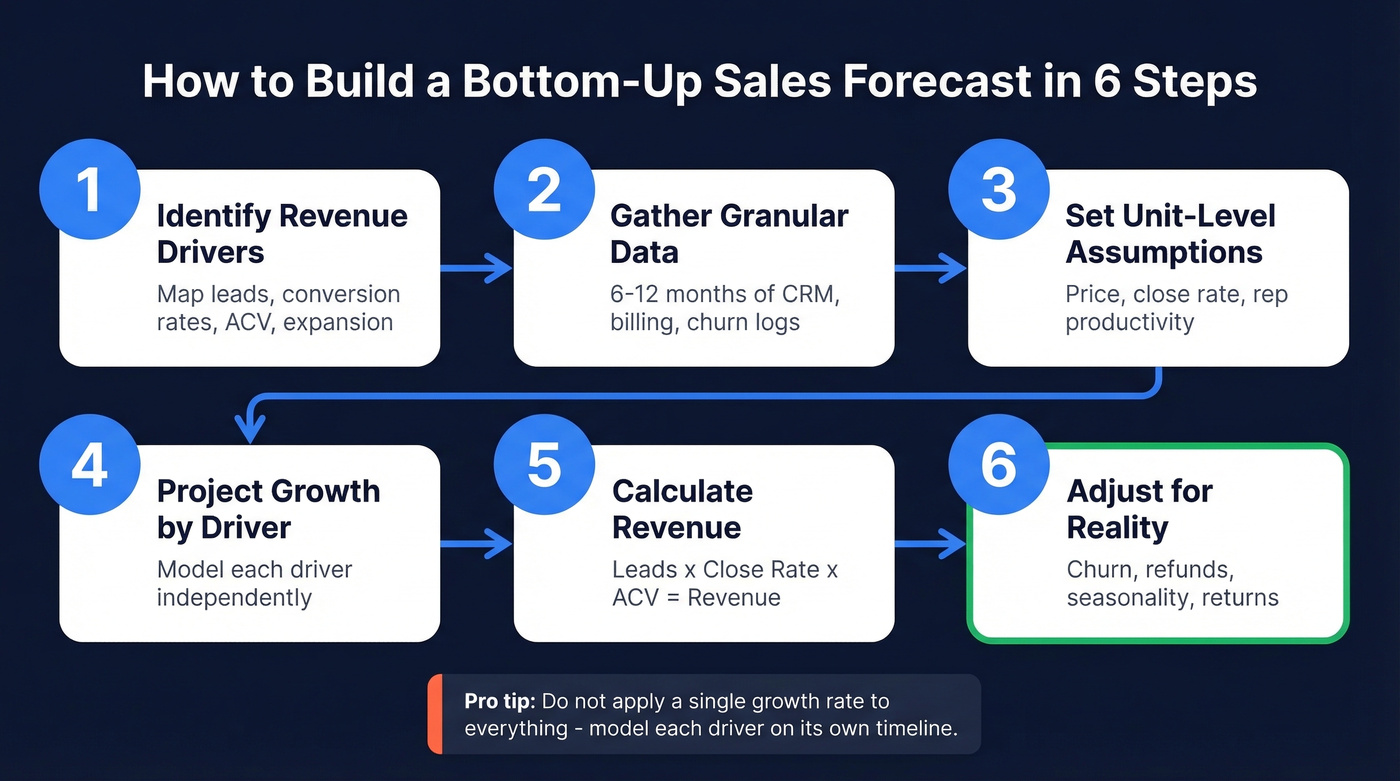
Step 1: Identify Revenue Drivers
Break your business into the components that actually generate revenue. For a B2B SaaS company: inbound leads, outbound leads, conversion rates by stage, average contract value, and expansion revenue from existing accounts. For e-commerce: traffic sources, conversion rate, average order value, and repeat purchase rate. Don't start modeling until you've mapped these drivers explicitly.
Step 2: Gather Granular Data
Pull at least 6-12 months of historical data for each driver - CRM pipeline data, marketing attribution reports, billing records, and churn logs. If you're pre-revenue, use data from your beta, pilot customers, or comparable benchmarks. This is where spreadsheets earn their keep.
Step 3: Set Unit-Level Assumptions
Define your price and quantity metrics with specific numbers. Average selling price, average contract value, conversion rates by funnel stage, rep productivity in deals closed per rep per month. Each assumption should be defensible with historical data or a clear rationale for why it'll change.
Step 4: Project Growth by Driver
Don't apply a single growth rate to everything. Your inbound lead volume might grow 15% quarter-over-quarter from content investments, while outbound conversion rates stay flat because you haven't changed your ICP targeting. Model each driver independently. This is where the forecast gets honest.
Step 5: Calculate Revenue
Apply the core formula:
- 100 qualified leads/month x 20% close rate = 20 new customers
- 20 customers x $1,000 ACV = $20,000/month in new revenue
- Add expansion: 5% monthly expansion on $200,000 existing ARR = $10,000
- Total monthly revenue: $30,000
This example compounds - by month 6, your expansion base has grown, accelerating the effect. Scale across segments, products, or regions and you've got a complete revenue model.
Step 6: Adjust for Reality
Raw projections aren't forecasts. Adjust for refunds, churn, returns, and seasonality. A SaaS company with 5% monthly churn sees its base erode every period. An e-commerce business might do 2-3x its average quarter in Q4. Build these adjustments into the model explicitly - don't bury them in a footnote.
Industry Driver Trees
The "Price x Quantity" formula looks different depending on your business:
| Industry | Price Metric | Quantity Metric | Key Adjustments |
|---|---|---|---|
| B2B SaaS | ACV / ARPA | Active accounts, rep productivity | Churn, expansion, seasonality |
| D2C / E-commerce | AOV / ASP | Orders, traffic x conversion | Returns, seasonality, CAC |
| Marketplace | Take rate | GMV (buyer x seller activity) | Fraud, refunds, mix shift |
| Manufacturing | Unit cost | SKU-level volume by region | Lead times, raw material costs |
| Professional Services | Hourly rate / project fee | Billable hours / engagements | Utilization rate, bench time |
A few nuances worth calling out. For D2C, calculate AOV from gross revenue, not net - forecasting refunds separately avoids double-counting and distortion. For professional services, your forecast ceiling is utilization rate x headcount. No amount of demand modeling matters if you can't staff the work.
The manufacturing angle deserves special attention. SKU-level forecasting improves raw material planning and reduces last-minute production adjustments, which is where margin gets destroyed in distribution businesses. If you're forecasting across complex assortments with seasonal swings and long lead times, granular unit-level modeling isn't optional.
One warning from the Wall Street Prep framework: this approach can become too granular. Modeling every SKU variant across every region and channel creates a model nobody can maintain. Balance detail so assumptions are supportable but the model doesn't require a full-time analyst just to update.
Your bottom-up forecast lives or dies on pipeline inputs. If your lead volume and conversion rate assumptions are built on bad contact data, the whole model breaks. Prospeo gives you 300M+ profiles with 98% email accuracy and 30+ filters - so the "qualified leads per month" line in your forecast reflects reality, not hope.
Fix your pipeline inputs and your forecast fixes itself.
Forecasting for Fundraising
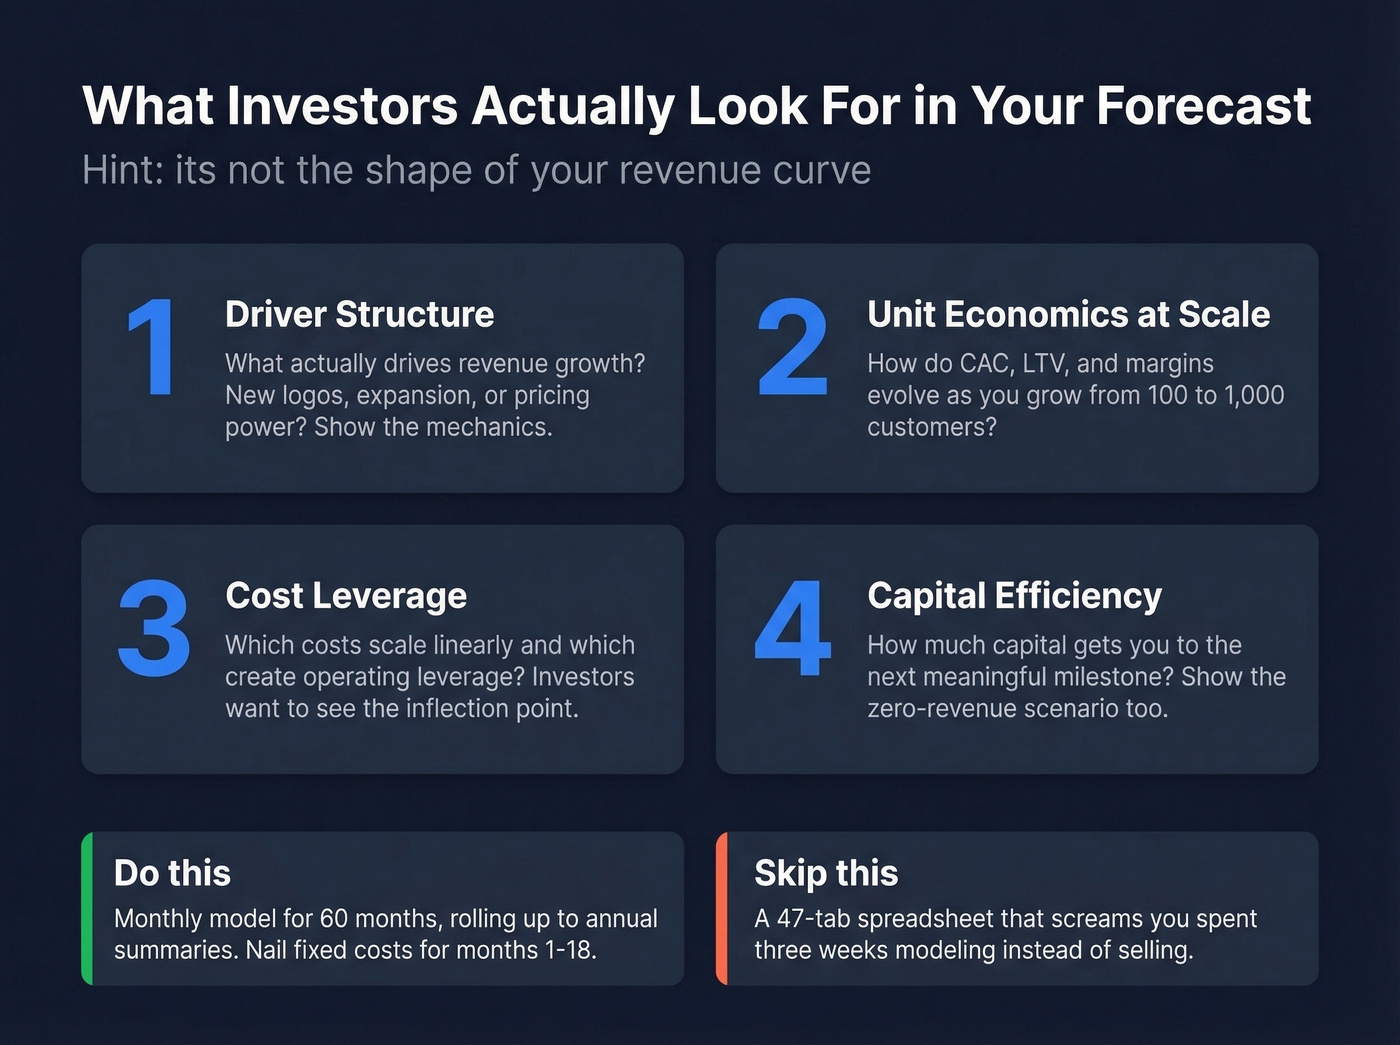
Investors don't evaluate the shape of your revenue curve. They evaluate the driver structure underneath it.
If your deal sizes are small and your sales cycle closes in under 30 days, you probably don't need a 47-tab model. A clean one-pager with five defensible drivers will impress investors more than a sprawling spreadsheet that screams "I spent three weeks on this instead of selling."
What investors actually look for:
- Driver structure - what drives revenue expansion? New logos, expansion, or pricing?
- Unit economics at scale - how do CAC, LTV, and margins evolve as you grow? (See: CAC.)
- Cost leverage - which costs scale linearly vs. create operating leverage?
- Capital efficiency - how much capital gets you to the next meaningful milestone?
Build your model monthly for 60 months, rolling up to annual summaries for the board deck. Per TechCrunch's guidance, nail your fixed expenses with precision for the first 12-18 months - headcount, fully loaded costs, rent, legal, insurance. These are knowable. Don't hand-wave them.
Run sensitivity analysis at 50%, 25%, and 0% of projected revenue. The zero-revenue scenario tells you your runway: cash on hand divided by monthly burn rate. Every serious investor will stress-test your downside. Beat them to it.
Forecast Accuracy Benchmarks
The Fullcast framework provides useful tiers for B2B SaaS:
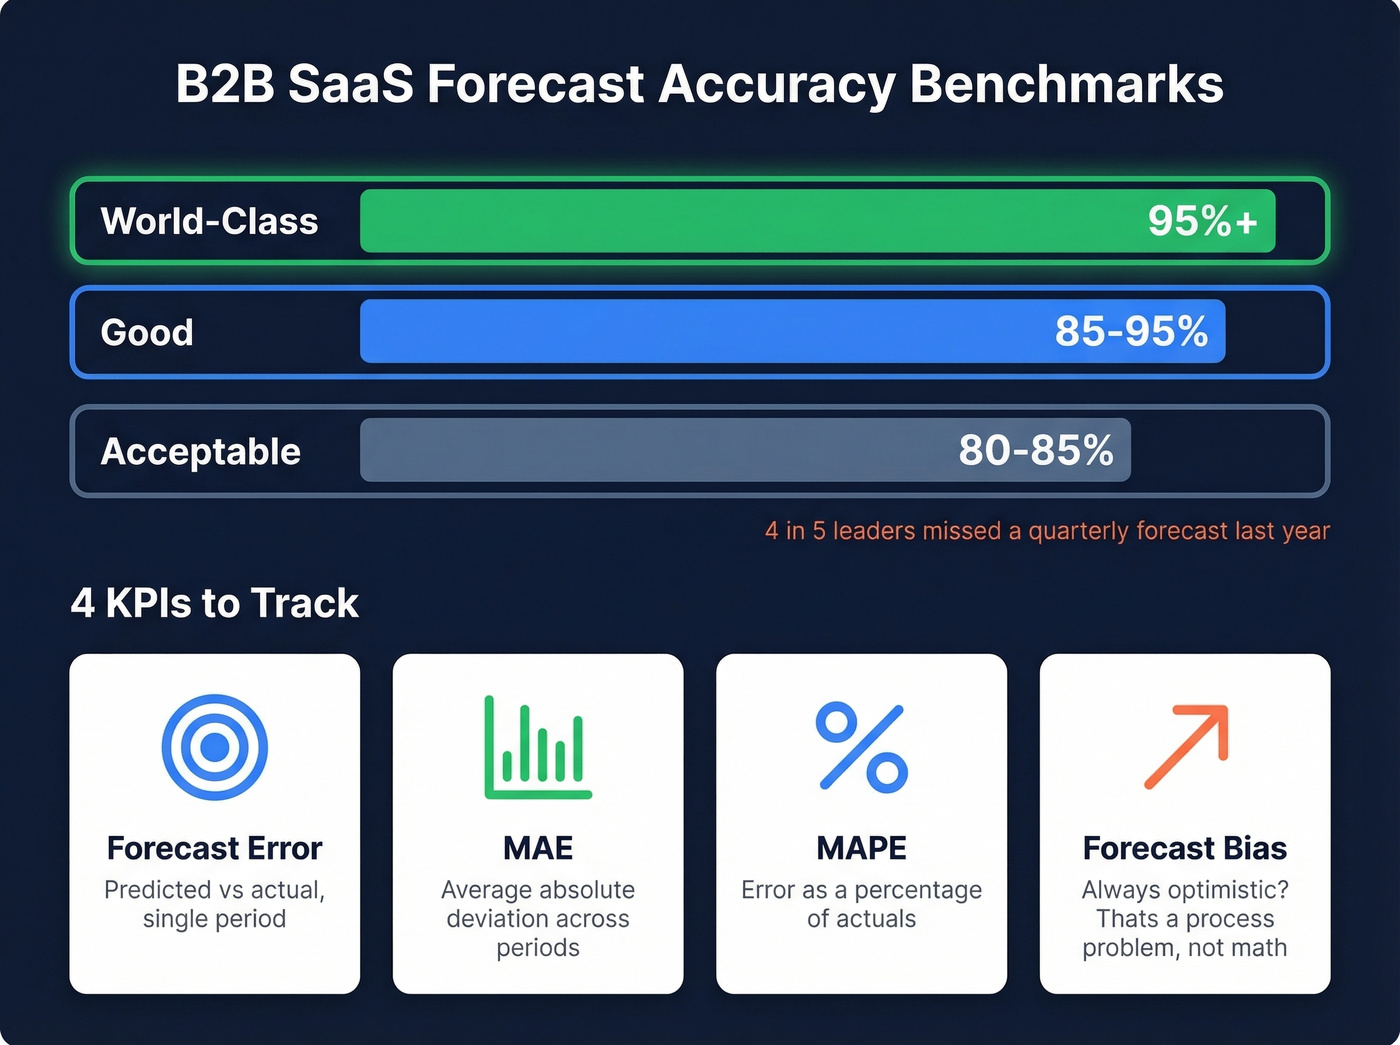
- Acceptable: 80-85% accuracy
- Good: 85-95% accuracy
- World-class: 95%+ accuracy
Track four KPIs: Forecast Error, Mean Absolute Error, Mean Absolute Percentage Error, and Forecast Bias. Bias is the sneaky one - a team that's always 10% optimistic has a process problem, not a math problem.
The collaboration gap matters here. 97% of leaders say Sales and Finance need to work better together on forecasting. That's nearly unanimous agreement on a problem almost nobody's solved. If your sales team owns pipeline data and your finance team owns the forecast model, and they don't talk weekly, your accuracy will suffer regardless of methodology.
Pros and Cons
Before committing, understand the trade-offs clearly.
Pros:
- Forces assumption-level rigor - every input is defensible
- Connects directly to operational plans like headcount, quotas, and marketing spend
- Detects signal changes faster because you're monitoring individual drivers
- Builds credibility with investors and board members who want to see the mechanics
- Enables sales planning that ties revenue targets to specific team activities
Cons:
- Time-intensive to build and maintain, especially across multiple segments
- Requires clean, granular data - garbage inputs produce garbage outputs
- Can miss macro shifts that a top-down view would catch immediately
- Risk of over-granularity: modeling too many variables creates fragile, unmaintainable spreadsheets
- Assumes historical driver relationships hold, which breaks during market disruptions
The right call for most teams is to use bottom-up forecasting as the operational backbone and layer a top-down sanity check on top.
Common Pitfalls
Most forecasts fail not because the math is wrong, but because the inputs are garbage. Here's the checklist we've built from watching teams get this wrong.
Over-granularity paralysis. Modeling every SKU across every channel creates an unmaintainable model. Forecast at the level where you can defend assumptions, then allocate downward.
Placeholder budgets. Departments submit "we're not sure, so here's a placeholder" and FP&A aggregates garbage - the #1 complaint on r/FPandA. Require driver-based justification for every line item above a materiality threshold.
Treating history as a crystal ball. Patterns break when competitors shift or macro conditions change. Complement historical data with forward-looking signals like promotions, price changes, and capacity constraints.
Ignoring seasonality. Flat monthly projections in a seasonal business destroy credibility. Build seasonal indices from at least two years of data.
Confirmation bias. Teams anchor to the number they want and work backward. Assign someone the explicit role of challenging assumptions before the model is finalized.
Static forecasts. A forecast built in January is fiction by March. Move to rolling forecasts with monthly or quarterly refreshes.
Data quality rot. Bad CRM data produces fiction pipeline, and fiction pipeline produces fiction forecasts. Run freshness checks and missing-value alerts on your CRM before modeling, and keep contact data reachable and up to date. Tools like Prospeo verify emails at 98% accuracy on a 7-day refresh cycle, so your pipeline reflects actual reachable contacts - not a graveyard of bounced addresses. (If you're auditing list health, start with email bounce rate benchmarks.)
Cross-department silos. Sales forecasts revenue, Finance forecasts costs, nobody reconciles until the board meeting. Weekly alignment between Sales, Finance, and RevOps on shared assumptions fixes this.
Tools for Bottom-Up Forecasting
Look, 100% of finance professionals use spreadsheets at least quarterly, and Excel is more capable than people give it credit for. The Forecast Sheet feature generates time-series projections with confidence intervals, FORECAST.ETS handles exponential smoothing, and Scenario Manager lets you stress-test assumptions. Google Sheets works well when multiple department heads need simultaneous access.
For complex organizations - five or more departments, multiple product lines, several geographies - dedicated FP&A platforms like Anaplan, Adaptive Planning, or Pigment reduce the consolidation headache significantly.
CRM-integrated forecasting in Salesforce or HubSpot can automate the pipeline-to-forecast connection, but only if your pipeline hygiene is solid. Garbage in, garbage out applies doubly when the garbage is automated. Skip the fancy forecasting tool and fix your data first if your CRM hasn't been cleaned in six months. (If you're evaluating platforms, compare sales forecasting solutions and best sales forecasting tools.)
Step 4 says model each driver independently. Your outbound conversion rate won't budge if reps are dialing wrong numbers and bouncing emails. Prospeo's 125M+ verified mobiles hit a 30% pickup rate, and emails verify at 98% - the kind of data that turns flat outbound metrics into actual growth drivers.
Stop forecasting outbound growth you can't deliver on.
FAQ
What is a bottom-up forecast?
A bottom-up forecast builds revenue projections from granular, unit-level inputs - leads, conversion rates, deal sizes, rep capacity - and aggregates them into a total number. Every dollar traces back to a defensible assumption about how customers will actually be acquired and retained, making it the opposite of top-down market-share guessing.
How long does it take to build one?
A first model takes 2-4 weeks depending on data availability and business complexity. Once the structure exists, ongoing updates should take hours, not days. If monthly refreshes consume more than a full day, the model is too granular - consolidate your driver layers.
What's a good forecast accuracy target?
In B2B SaaS, 80-85% is acceptable, 85-95% is good, and 95%+ is world-class per the Fullcast framework. Track MAPE and Forecast Bias together - consistent over-forecasting signals a process problem that accuracy metrics alone won't reveal.
Can you combine bottom-up and top-down methods?
Yes, and most high-performing teams do. Run both independently, compare at the segment level, and investigate variances. The gap between the two numbers reveals your riskiest assumptions - typically an inflated market share estimate or an unaddressed pipeline shortfall.
How do I keep pipeline data clean for accurate forecasts?
Run freshness checks and missing-value alerts on your CRM before every forecast cycle. Stale contact records inflate your pipeline with prospects you can't actually reach, which throws off conversion rate inputs and makes the whole model unreliable.