Close Ratio Calculator + 2026 Benchmarks by Industry
A 5% close rate sounds terrible - until you learn you're selling six-figure enterprise software into a market that averages 5-15%. A 40% close rate sounds incredible - until you realize your reps are quietly dropping "no-decision" deals from the denominator.
The number itself means nothing without context. That's why a close ratio calculator needs benchmarks sitting right next to it.
Quick version: Your close ratio = (deals won / total opportunities) x 100. HubSpot's survey-based cross-industry benchmark is ~20%, but that number is meaningless without knowing your industry, deal size, and lead source. Use the calculator below, then check the benchmarks to see where you actually stand.
Close Ratio Calculator
Formula: (Deals Won / Total Opportunities) x 100
Enter your numbers:
- Deals won - signed contracts in the period: ___
- Total opportunities - all opps created in the same period: ___
- Your close ratio: ___%
Worked example: 12 wins out of 50 opportunities = 24%. That's slightly above the cross-industry average.
Reverse Calculator
Need to hit a revenue target? Flip the formula:
- Target close ratio: ___%
- Current pipeline: ___
- Deals you need to win: ___
If your target is 25% and you've got 80 opportunities, you need 20 closed-won deals. If that feels unrealistic, the problem isn't closing - it's pipeline volume or qualification upstream.
How to Calculate Your Closing Ratio
The formula is straightforward: divide closed-won deals by total opportunities created, then multiply by 100. But the details matter more than the math.
Step 1: Define your time window. Measure over at least three months. A single month swings wildly based on one large deal closing or slipping, so quarterly rolling averages give the most reliable picture.
Step 2: Count only signed contracts as "won deals." Verbal yeses and handshake agreements don't count until ink is dry.
Step 3: Count every opportunity created in that same window as your denominator - including ones that went dark, ghosted, or said no. This is where most teams cheat.
Here's what that looks like in practice. An SMB rep lands 8 wins from 30 opportunities over a quarter: 27% close ratio, solid for a transactional sale with a short cycle. An enterprise team closes 6 out of 80 opportunities: 7.5%. Looks rough on paper, but for enterprise software with 12-18 month cycles and multiple stakeholders, it's within normal range.
Close Rate vs. Win Rate vs. Conversion Rate
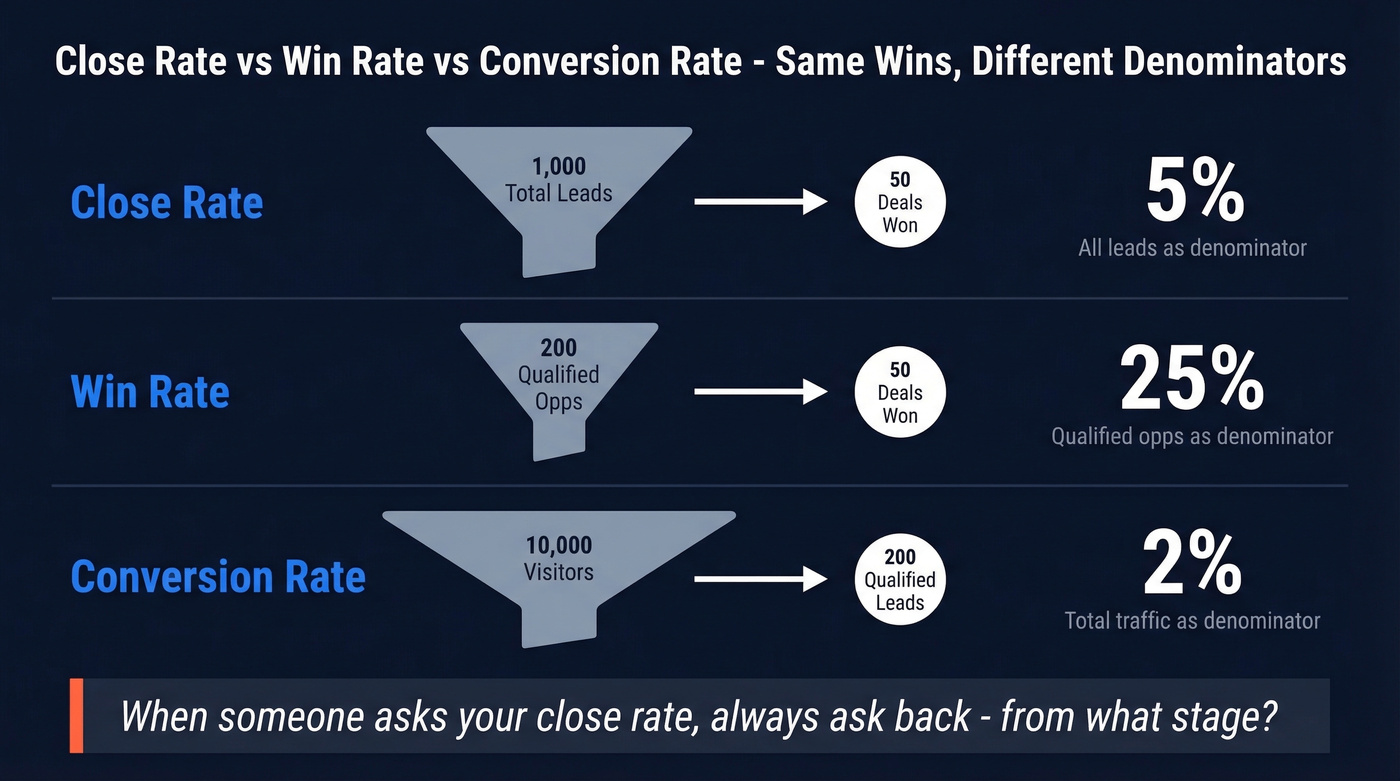
These three terms get used interchangeably, and they shouldn't. The difference is the denominator.
| Metric | Numerator | Denominator |
|---|---|---|
| Close rate | Deals won | All leads/contacts |
| Win rate | Deals won | Qualified opps only |
| Conversion rate (marketing) | Qualified leads | Total visitors/traffic |
Same scenario through each lens: your team closes 50 deals from 1,000 total leads, of which 200 became qualified opportunities. That's a 5% close rate, a 25% win rate, and a completely different conversation depending on which number you report to the board.
RAIN Group found an average win rate of 47% across 472 sellers - but that's using qualified opportunities as the denominator. Ruler Analytics reports an average marketing conversion rate of just 2.9% across 14 industries and 100M+ data points. Completely different metric, completely different universe.
When someone asks "what's your close rate?" you need to ask back: "from what stage?"
Deals with a known contact close at 37% vs 19% for cold outreach. The fastest way to improve your close ratio isn't better closing - it's reaching verified decision-makers. Prospeo's 300M+ profiles with 98% email accuracy mean your reps spend time selling, not bouncing.
Stop losing deals to bad data. Start closing the ones that matter.
Benchmarks by Industry
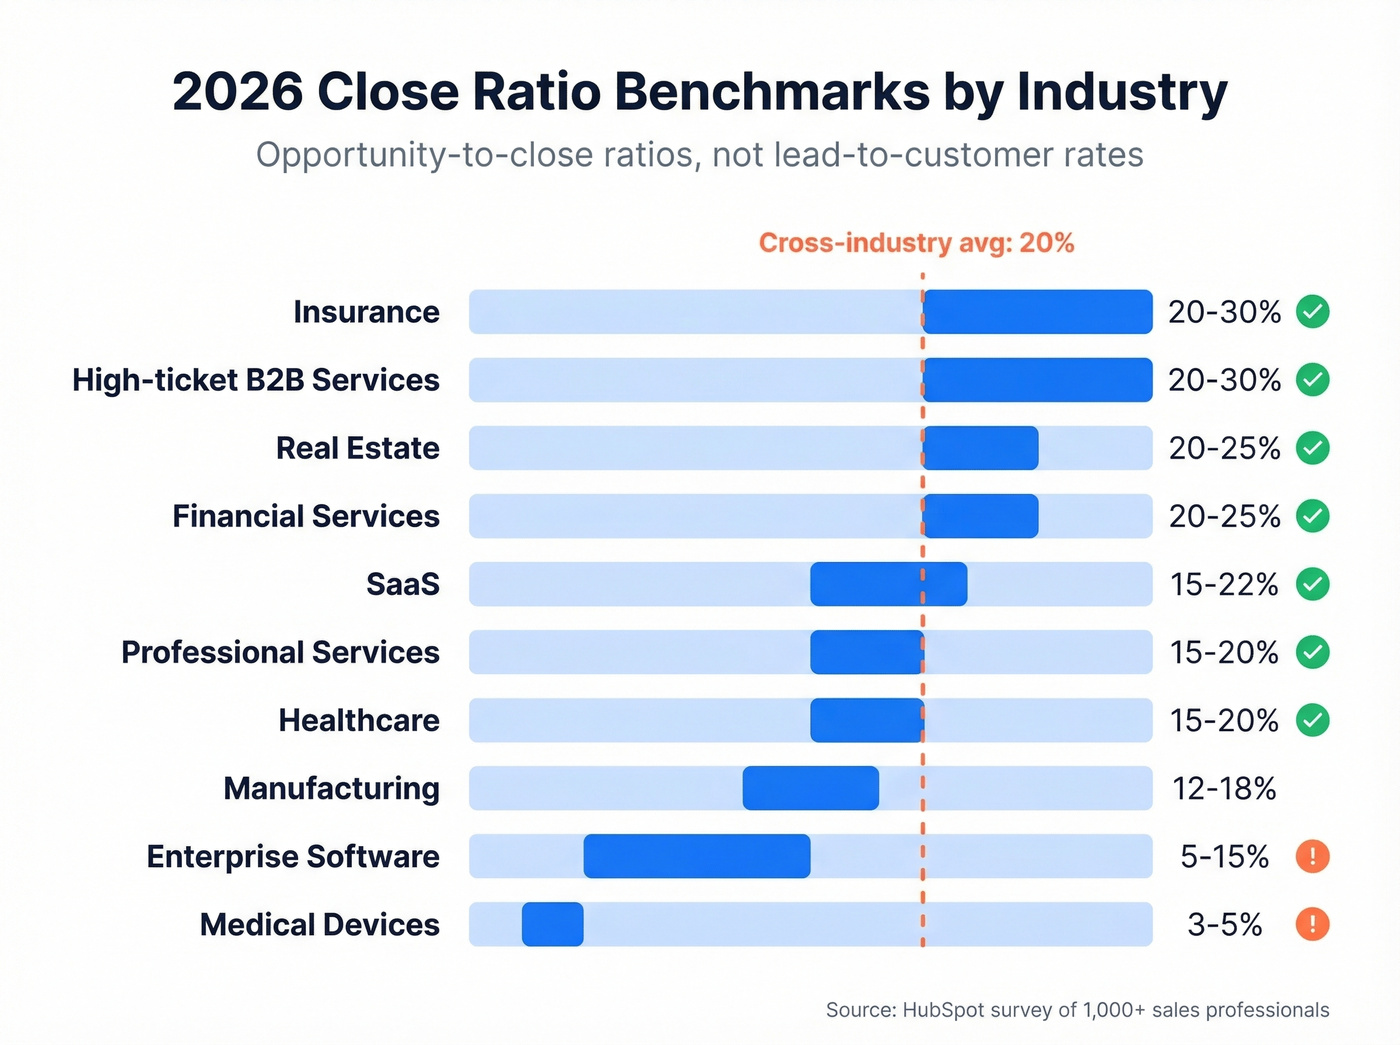
These ranges represent opportunity-to-close ratios, not lead-to-customer rates.
| Industry | Close Rate Range |
|---|---|
| Real estate | 20-25% |
| Insurance | 20-30% |
| Financial services | 20-25% |
| High-ticket B2B services | 20-30% |
| SaaS | 15-22% |
| Professional services | 15-20% |
| Healthcare | 15-20% |
| Manufacturing | 12-18% |
| Enterprise software | 5-15% |
| Medical devices | 3-5% |
The cross-industry average sits around 20%, per HubSpot's survey of 1,000+ sales professionals. But averages hide everything interesting. Enterprise software at 5-15% reflects long sales cycles, multi-stakeholder buying committees, and heavy customization demands.
Here's the number that should worry enterprise teams: Winning by Design found that win rates for deals above $100K ACV dropped from 26% to 17% over recent years. The Ebsta x Pavilion B2B Sales Benchmark Report, analyzing 4.2M opportunities across $54B in pipeline, confirms the trend - enterprise deals are getting harder to close, not easier.
Meanwhile, 53% of sales pros reported stagnant close rates from 2021 to 2022. If your number hasn't moved, you're in the majority.
By Company Size
Smaller companies close at higher rates. Fewer stakeholders, shorter cycles, faster decisions.
| Segment | Avg Win Rate | Top Performers |
|---|---|---|
| Enterprise (1,000+ employees) | 20-25% | 30%+ |
| Mid-market (100-999) | 25-35% | 40%+ |
| SMB (<100) | 30-40% | 45%+ |
This is why a 20% win rate can be excellent for an enterprise team and mediocre for an SMB one. If you're mid-market and sitting below 25%, something's off in your qualification process.
By Lead Source
Where the lead came from dramatically affects how likely it is to close.
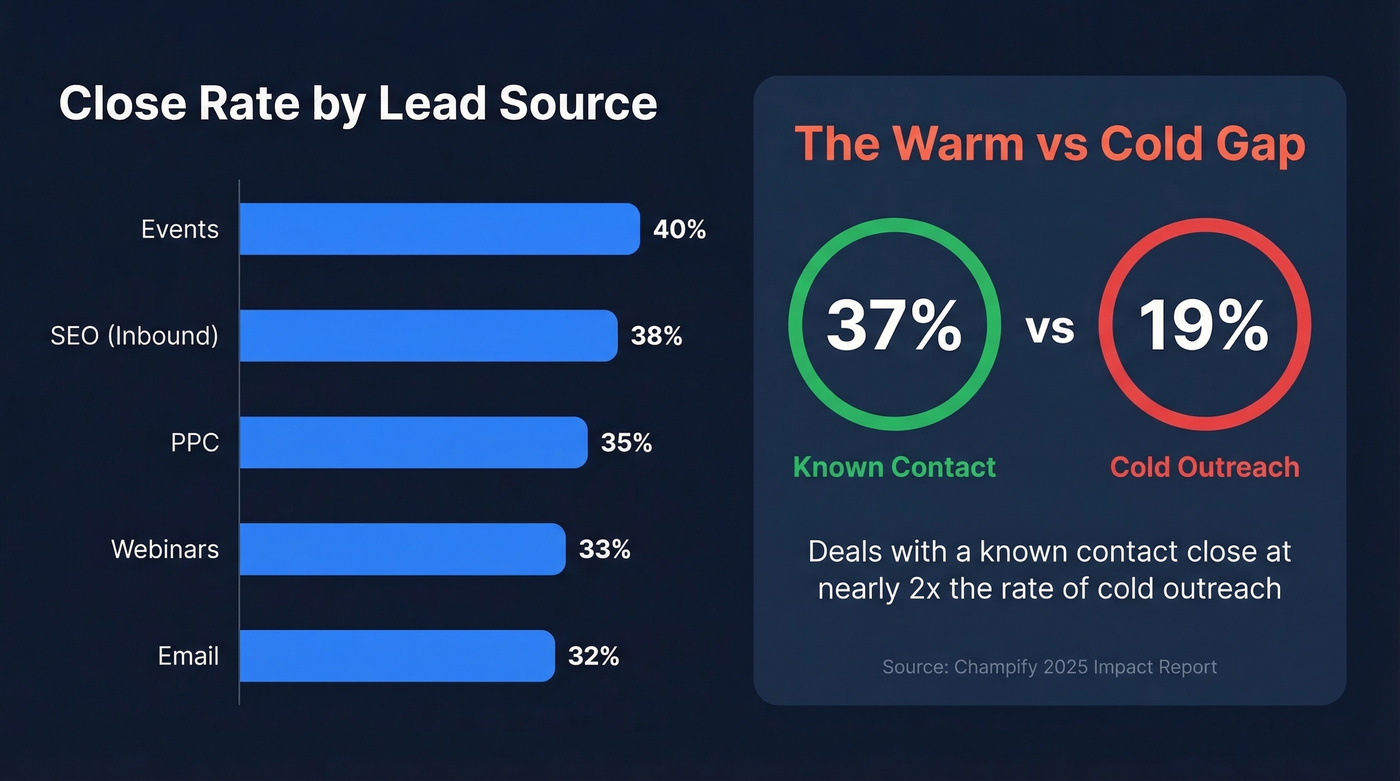
| Lead Source | Opportunity-to-Close Rate |
|---|---|
| Events | 40% |
| SEO (inbound) | 38% |
| PPC | 35% |
| Webinars | 33% |
| 32% |
The biggest gap isn't between channels - it's between warm and cold. Deals with a known contact close at a 37% win rate versus 19% for cold outreach, per Champify's 2025 Impact Report. That's nearly double.
If your closing ratio is low, the first question isn't "are we closing well?" It's "are we reaching the right people?"
Stage-by-Stage Funnel Benchmarks
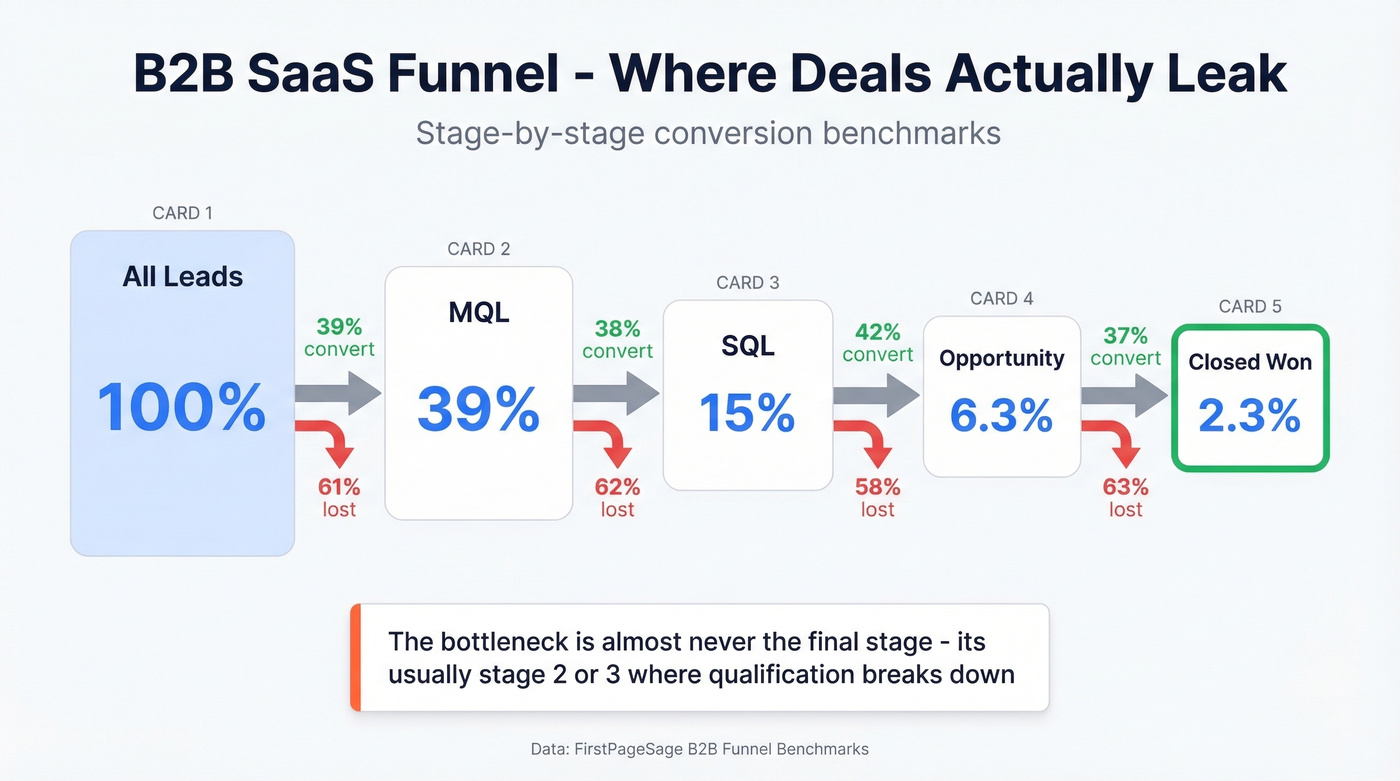
Your close rate is the end result of every stage before it. If you're leaking deals at MQL-to-SQL, no amount of closing skill fixes the number.
| Industry | Lead-to-MQL | MQL-to-SQL | SQL-to-Opp | SQL-to-Closed Won |
|---|---|---|---|---|
| B2B SaaS | 39% | 38% | 42% | 37% |
| Financial services | 29% | 38% | 49% | 53% |
| Healthcare | 24% | 38% | 51% | 51% |
| Real estate | 27% | 33% | 40% | 53% |
| Manufacturing | 26% | 41% | 46% | 51% |
Data from FirstPageSage's funnel benchmark report.
Look at B2B SaaS: 39% of leads become MQLs, but only 37% of SQLs ultimately close. The bottleneck is almost never the final stage. It's usually stage two or three, where qualification breaks down and unfit deals clog the pipeline.
Mistakes That Inflate Your Ratio
If your reps are reporting 90%+ win rates, they're lying - or your CRM hygiene is broken. Let's be honest: we've seen all four of these in the wild.
1. Excluding deals that dropped out. We once audited a team where reps reported 95%+ win rates by simply omitting prospects who didn't buy. Twenty wins out of 50 engaged is 40%. Remove the ones who ghosted and suddenly it's "20 out of 21." That's fiction, not a close rate.
2. Hiding "no-decision" deals. Prospects who went through discovery, saw a demo, then vanished without saying yes or no are still outcomes. Reclassifying them as "not real opportunities" after the fact is the most common form of denominator manipulation.
3. Inconsistent denominators across reps. One rep counts from first meeting. Another counts from proposal sent. A third counts from "they seemed interested." You can't compare these numbers, and you definitely can't forecast from them.
4. Measuring over too short a period. A single month where two big deals land can make a mediocre quarter look like a record-breaker. Three months minimum, always.
How to Improve Your Close Rate
A SaaS practitioner on r/sales tracked their demo-to-close rate for six months and improved it from 18% to 34%. Here's what moved the needle, ranked by impact:
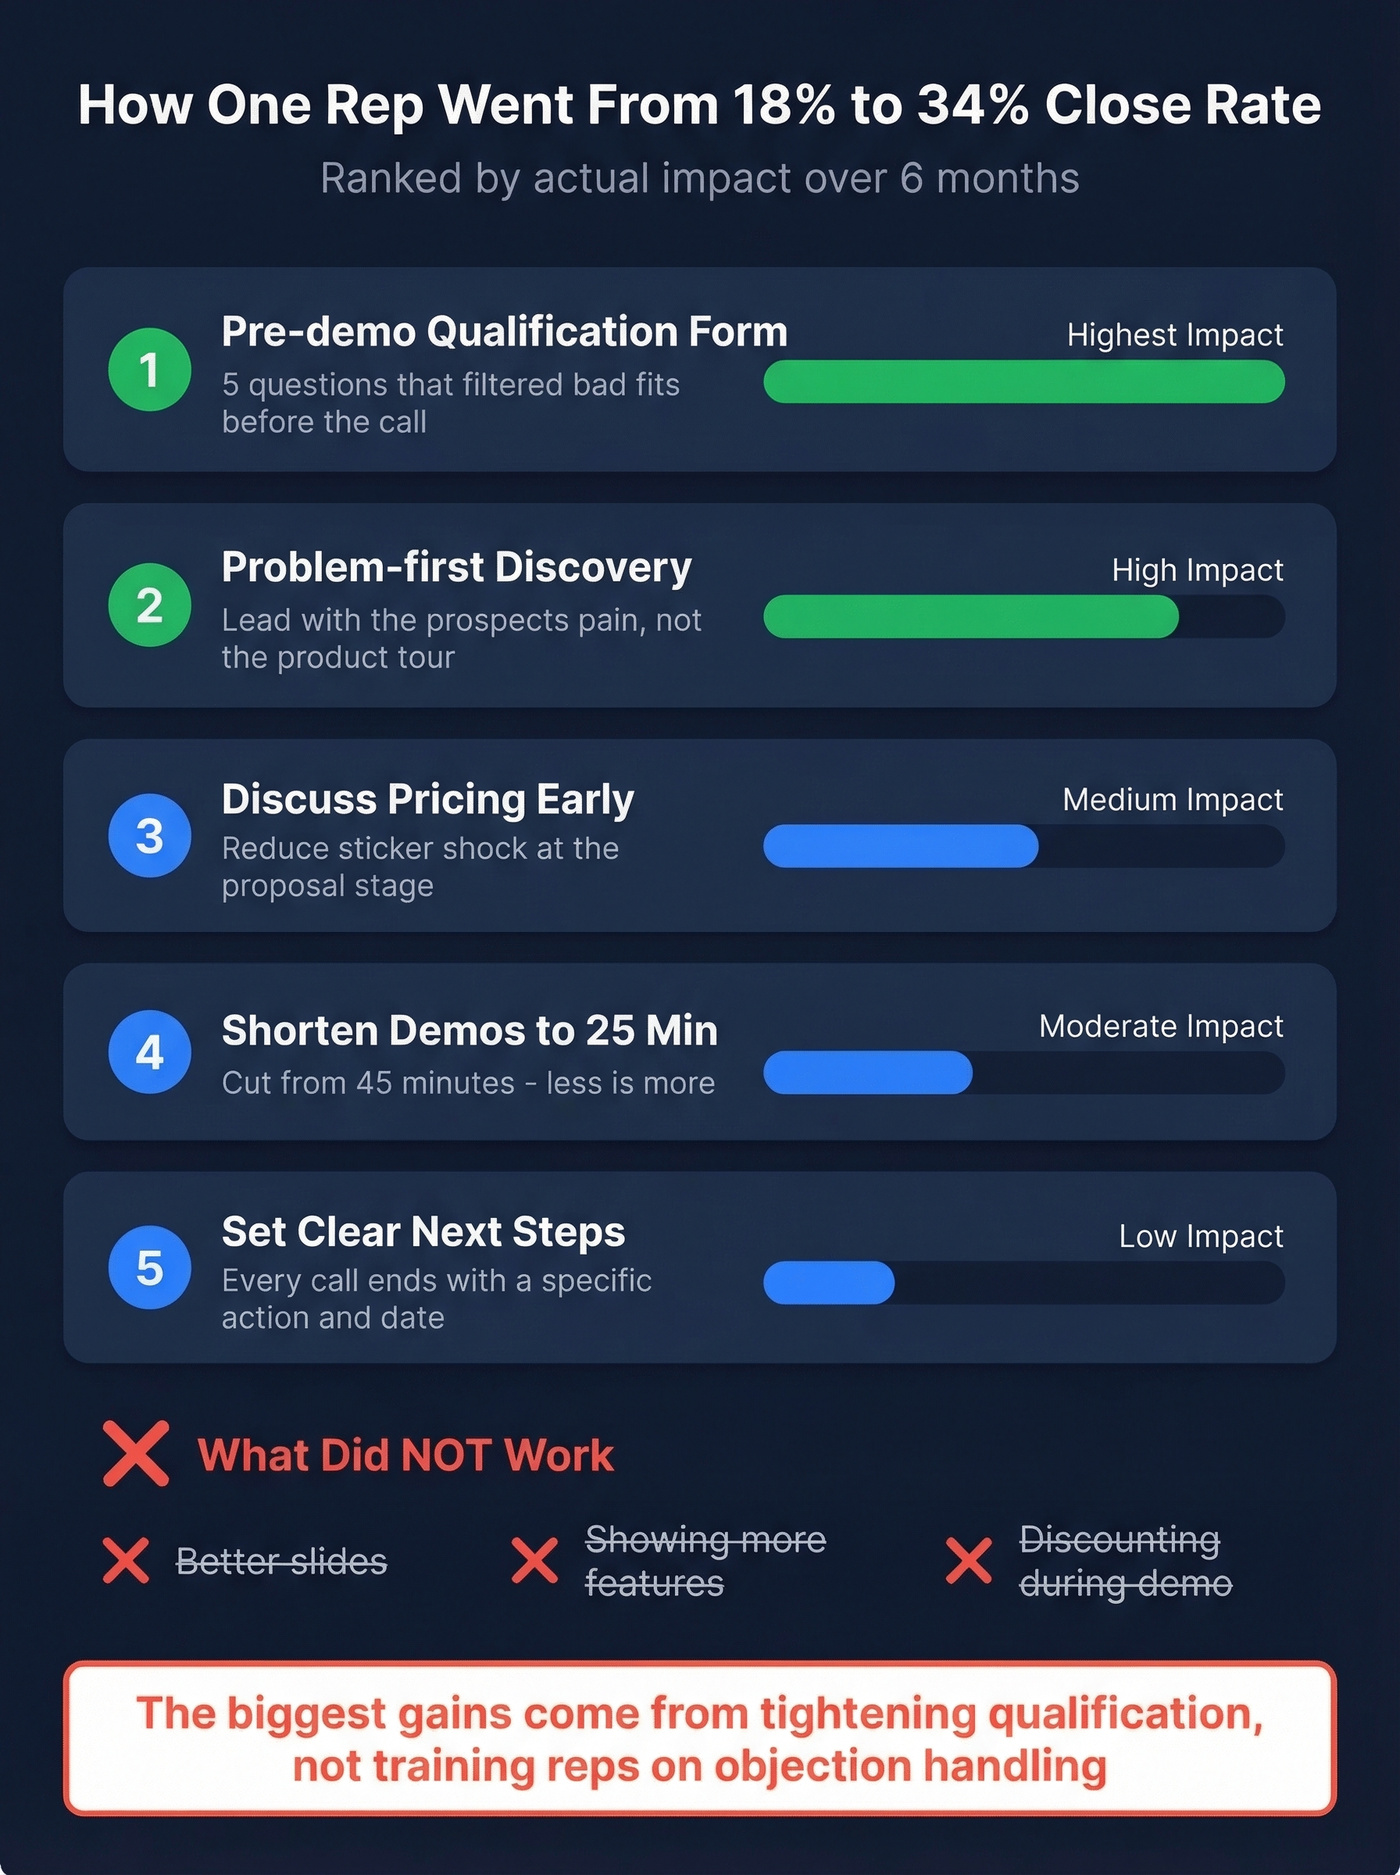
- Pre-demo qualification form - five questions that filtered bad fits before the call
- Problem-first discovery - leading with the prospect's pain, not the product tour
- Discuss pricing early - reducing sticker shock at the proposal stage
- Shorten demos - cut from 45 minutes to 25
- Set clear next steps - every call ended with a specific action and date
What didn't work? Better slides, showing more features, and discounting during the demo.
In our experience, the biggest close-rate gains come from tightening qualification, not training reps on objection handling. If unqualified leads flood your pipeline, your denominator is inflated with people who were never going to buy. Skip the "advanced closing techniques" course and fix your intake process first.
This is also where data quality becomes a close-rate lever. Every phantom contact in your CRM - wrong email, outdated title, unreachable number - is an opportunity that was never real, dragging your ratio down. Prospeo verifies emails at 98% accuracy on a 7-day refresh cycle across 300M+ professional profiles, so far more of your leads entering the pipeline are actually reachable. When the denominator is clean, the close rate reflects reality instead of data decay.
If you want a tighter qualification system, start with lead scoring and a clear ideal customer profile so reps stop creating junk opportunities in the first place.
If your close ratio is stuck below benchmark, the leak is upstream. Teams using Prospeo book 26% more meetings than ZoomInfo users - because 98% accurate emails and 125M+ verified mobiles connect reps to real buyers, not dead ends. Pipeline quality fixes close rates.
Better pipeline in, better close ratio out. Starting at $0.01 per email.
FAQ
What is a good close ratio?
The cross-industry average is roughly 20%, but "good" depends entirely on segment. Enterprise software teams at 10-15% are performing normally; SMB teams below 25% likely have a qualification problem. Always benchmark against your industry and deal size, not the overall average.
What's the difference between close rate and win rate?
Close rate uses all leads or contacts as the denominator; win rate uses only qualified opportunities. The same 50 wins can be a 5% close rate from 1,000 leads or a 25% win rate from 200 qualified opps. Which you report depends on what question you're answering.
How often should I measure my closing ratio?
Monthly at minimum, but interpret trends over three-plus months. A single month can be skewed by one large deal closing or slipping. Quarterly rolling averages smooth out the noise that makes monthly snapshots misleading.
Can bad contact data lower my close ratio?
Absolutely. Unreachable contacts inflate your denominator with opportunities that were never real. Cleaning your data with a verified email provider reduces phantom leads so your ratio reflects actual sales performance, not data decay.