Closing Ratio Calculator + Industry Benchmarks (2026)
A 10-seat sales team with a 15% close rate and one with a 25% close rate aren't just 10 points apart - from the same number of opportunities, the second team closes about 67% more deals. That gap is why running a closing ratio calculator against your pipeline matters more than almost any other exercise in your CRM.
Your closing ratio = (Closed Deals / Total Opportunities) x 100
The average across industries is roughly 20%. Good sits in the 20-30% range. Elite teams push 40%+ win rates on qualified pipeline. But the number alone tells you nothing - you need stage-by-stage data to diagnose what's actually broken.
Jump to calculator | Jump to benchmarks
Calculate Your Closing Ratio
That's the close rate formula in its simplest form. Worked example: 100 deals closed from 500 opportunities = (100 / 500) x 100 = 20%.
Reverse mode: Need 50 closed deals at a 25% target? You need 200 opportunities (50 / 0.25). Always measure at least a rolling 3-month period to smooth out deal-cycle noise.
What Is Closing Ratio?
Your closing ratio measures how efficiently your team converts opportunities into signed deals. The formula is simple, but the denominator is where teams get tripped up.
Close rate uses all leads as the denominator - it reflects lead quality as much as sales execution. Win rate uses only qualified opportunities, which is why it's typically higher. A RAIN Group study of 472 sellers found the average win rate is 47%, while the average close rate across industries is around 20%. Confusing these two will wreck your forecasting.
What's a Good Closing Ratio?
"Good" depends on your industry and what you're counting in the denominator:
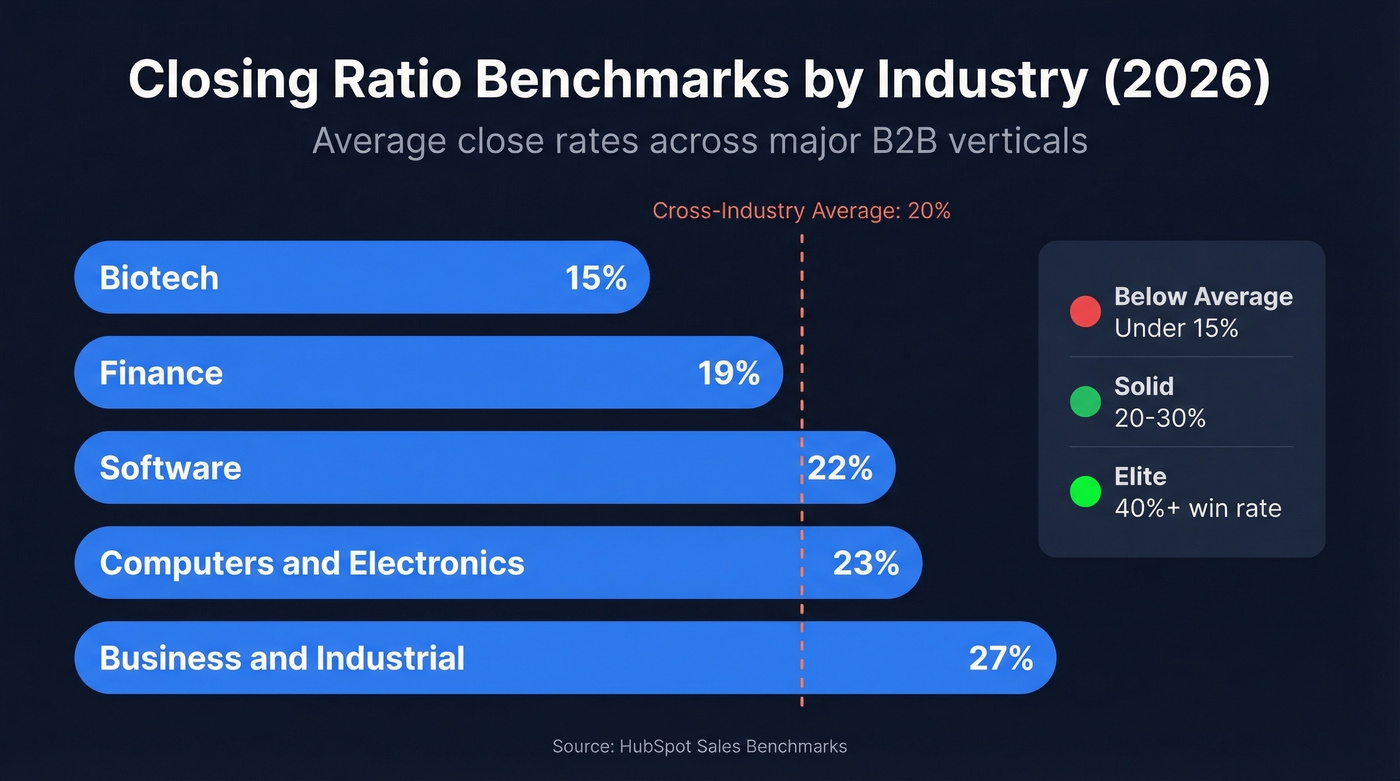
| Industry | Close Rate |
|---|---|
| Biotech | ~15% |
| Finance | ~19% |
| Software | ~22% |
| Computers/Electronics | ~23% |
| Business/Industrial | ~27% |
Win rate tiers tell a sharper story. The top 7% of sellers close at roughly 75%. The top 20% hit 62%. The remaining 80% sit around 40% on qualified pipeline. If your win rate on qualified opps is below 40%, you're underperforming the broad-market baseline - not just "below average."
Here's what makes this worse: HubSpot found 53% of teams reported stagnant close rates year-over-year. Most teams aren't improving. That's the real benchmark. Learning how to measure sales closing percentage at the team level - and acting on the data - is what separates stagnant orgs from growing ones.
53% of teams report stagnant close rates - and bad contact data is a hidden reason why. Every bounced email is a fake opportunity dragging your ratio down. Prospeo's 98% verified emails and 7-day data refresh keep your denominator honest so your closing ratio reflects real sales performance, not data decay.
Clean your pipeline denominator before you try to fix your numerator.
Stage-by-Stage Funnel Benchmarks
This is where a top-line number becomes actually useful. Your blended ratio masks where deals die. Here's a stage-by-stage breakdown from First Page Sage:
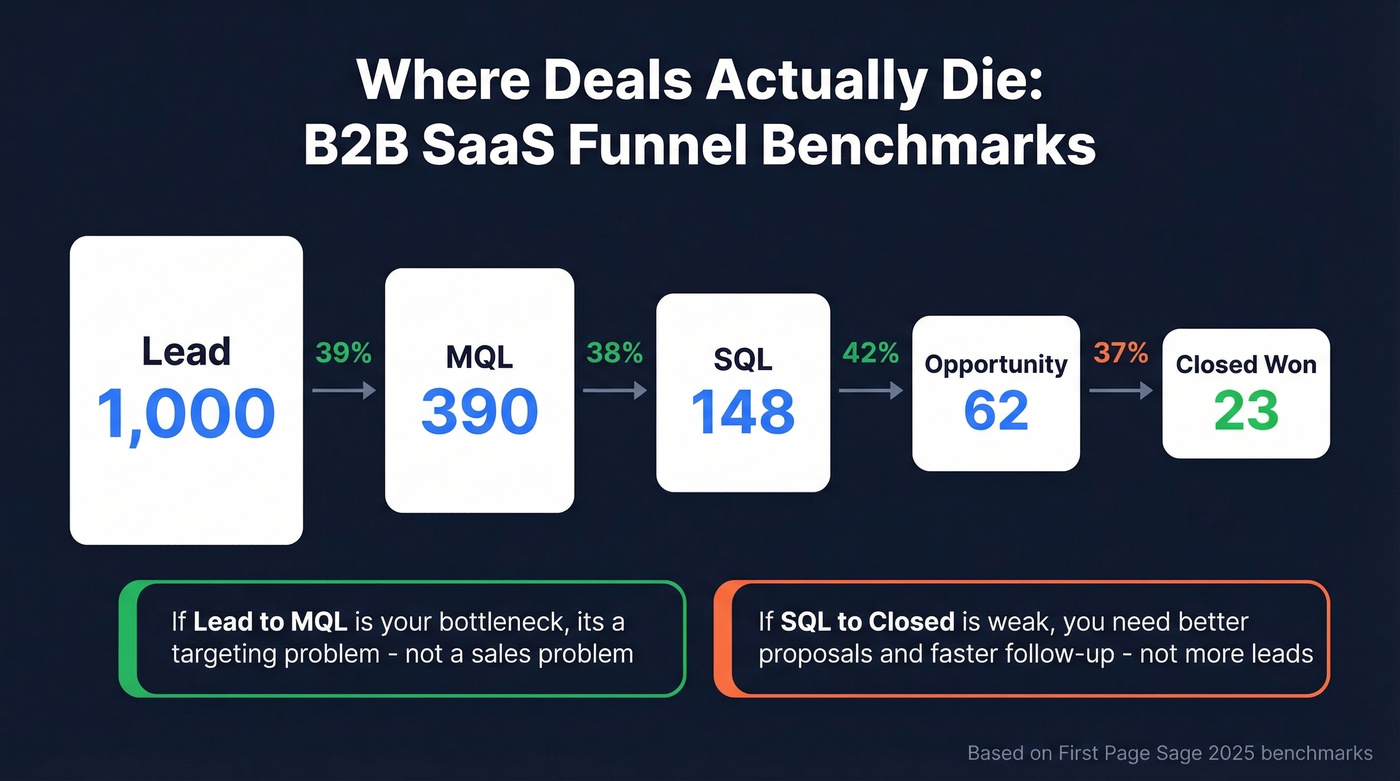
| Industry | Lead to MQL | MQL to SQL | SQL to Opp | SQL to Closed |
|---|---|---|---|---|
| B2B SaaS | 39% | 38% | 42% | 37% |
| Financial Services | 29% | 38% | 49% | 53% |
| Cybersecurity | 24% | 40% | 43% | 46% |
| IT & Managed Services | 19% | 38% | 41% | 46% |
| Real Estate | 27% | 33% | 40% | 53% |
Look: if your SQL-to-Closed Won rate is below 37% in B2B SaaS, the problem is late-stage execution - not lead gen. You don't need more leads. You need better proposals, faster follow-up, or stronger negotiation. If Lead-to-MQL is your bottleneck instead, no amount of sales coaching will fix a targeting problem.
We've seen this pattern repeatedly - teams pour money into top-of-funnel when their real leak is SQL-to-Opportunity. The stage data tells you where to spend.
Close Rate by Lead Source
A blended 19% close rate can mask wildly different realities. If your inbound close rate is 32% and your outbound is 8%, the blended number looks fine while your outbound motion bleeds money.
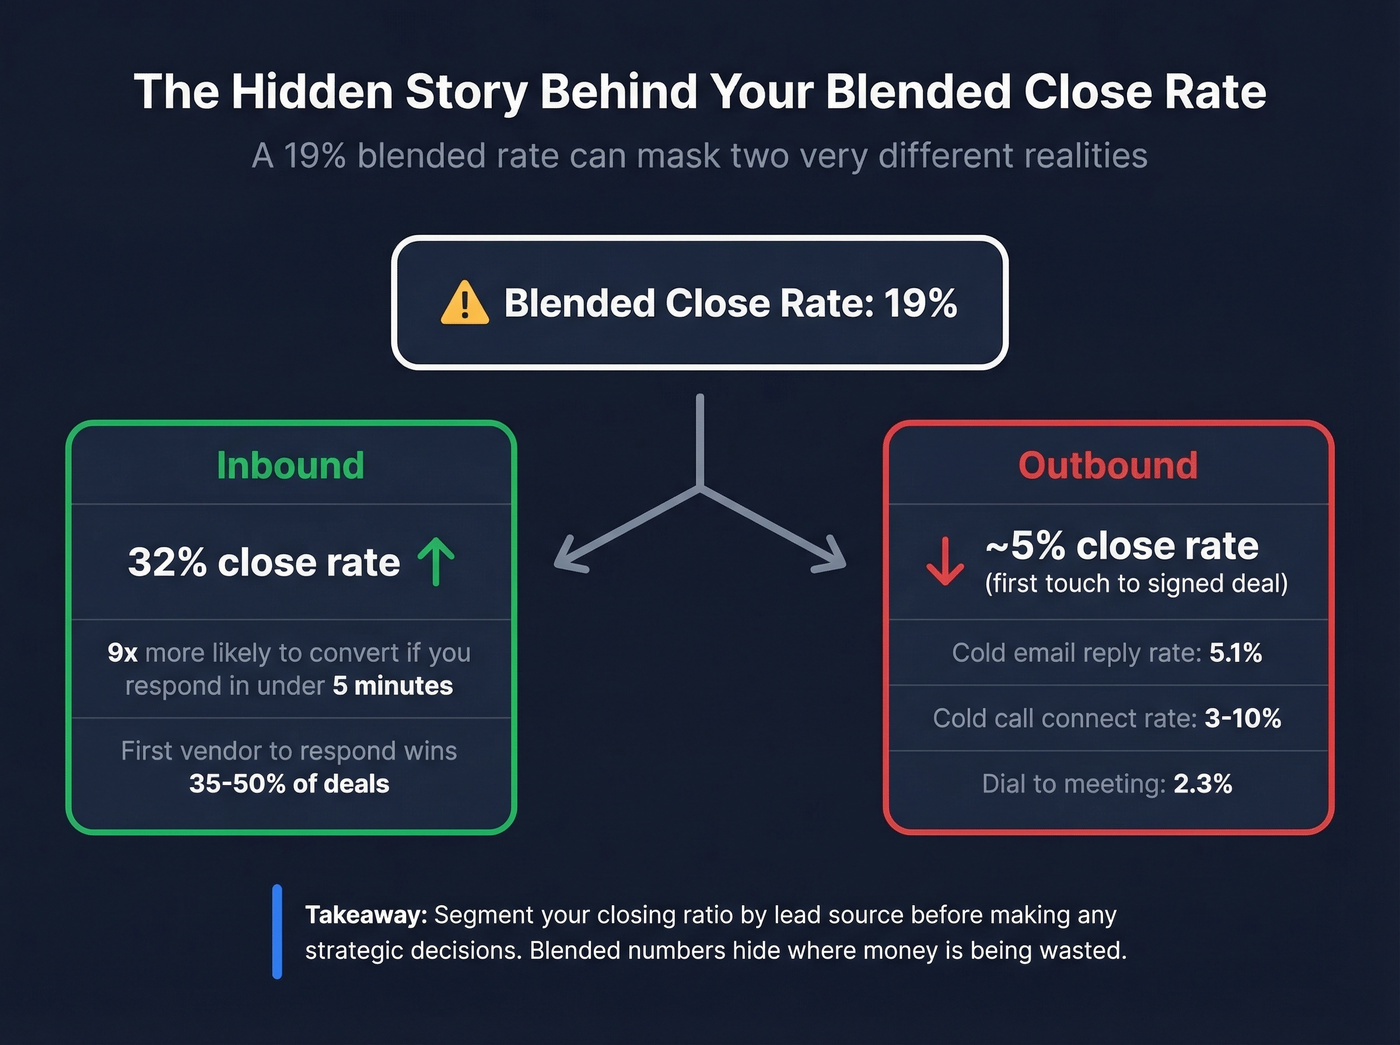
Outbound benchmarks are sobering: cold email reply rates sit around 5.1%, cold call connect rates run 3-10%, and dial-to-meeting conversion is just 2.3%. The actual outbound close rate from first touch to signed deal typically lands in the low single digits. That's not a reason to abandon outbound - it's a reason to be ruthless about data quality and targeting before you dial.
Responding to an inbound lead within 5 minutes makes them 9x more likely to convert, and the first vendor to respond captures 35-50% of sales. Segment your ratio by source before making any strategic decisions.
Mistakes That Tank Your Close Rate
Inflating the denominator. TheSalesBlog nails this: engage 50 prospects, win 20 - that's 40%. Exclude 10 who dropped off and suddenly you're at 50%. We've seen reps report 95%+ win rates by simply excluding everyone who didn't buy. Don't let your team cherry-pick the denominator.
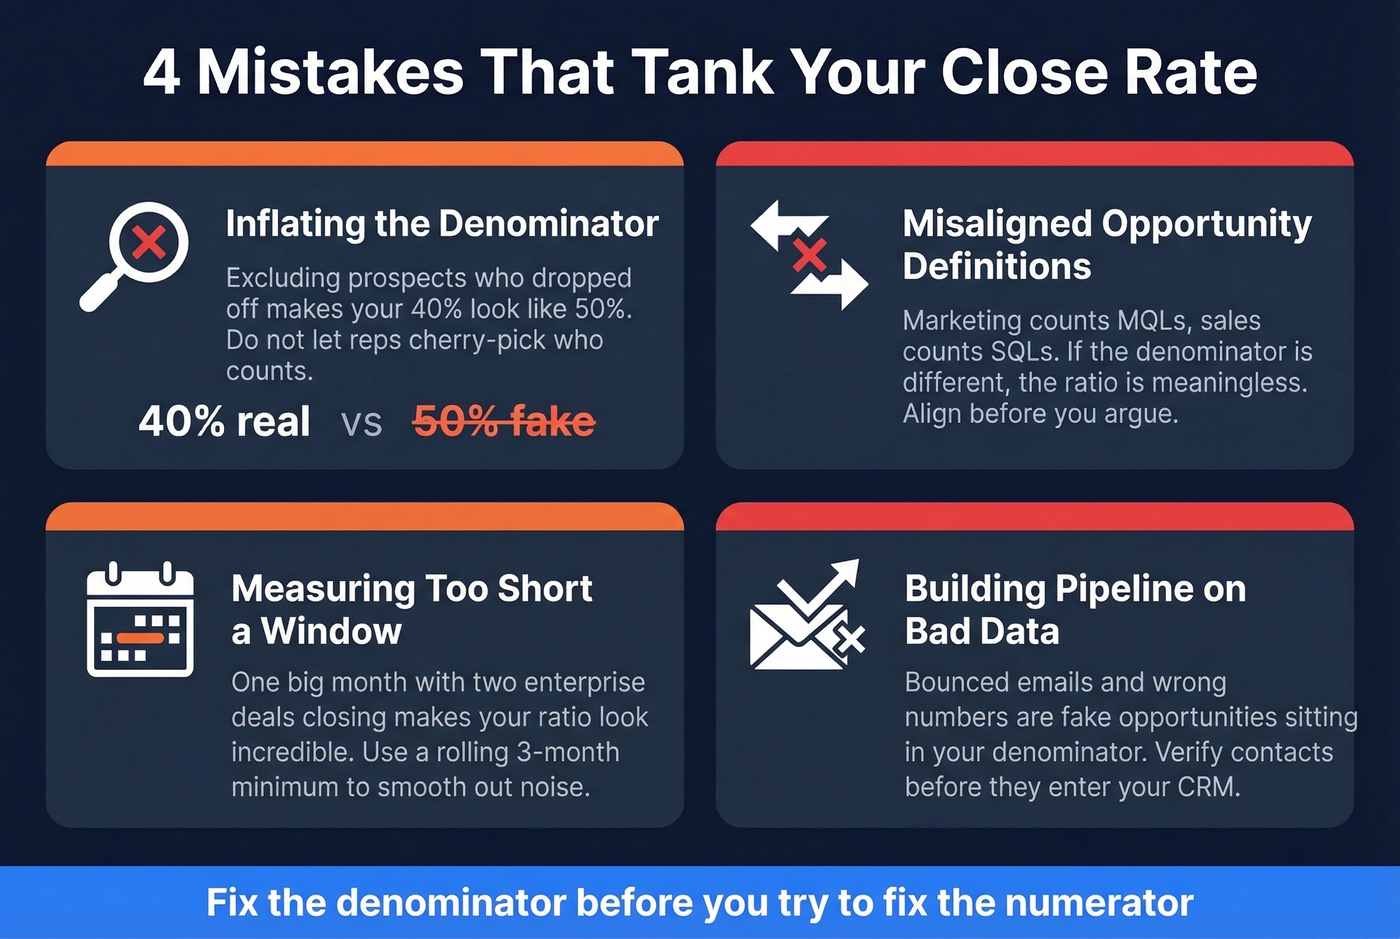
Misaligned "opportunity" definitions. If marketing counts MQLs and sales counts SQLs, your close rate is meaningless. Align on what enters the denominator before you argue about the number.
Measuring too short a window. A single month with two large deals closing can make your ratio look incredible. Use a rolling 3-month minimum.
Building pipeline on bad contact data. Every bounced email and wrong number is a fake opportunity sitting in your denominator, dragging your ratio down without you realizing it. Verify contacts with a tool like Prospeo before loading them into your CRM - it costs far less than the rep time wasted chasing dead leads.
How to Improve Your Closing Ratio
Diagnose by stage first. Pull your stage-by-stage conversion data and compare to the benchmarks above. If MQL-to-SQL is weakest, tighten qualification. If SQL-to-Closed is the problem, invest in case studies, battle cards, and proposal speed.
Let's be honest: most teams trying to "improve close rate" immediately buy more pipeline. That's backwards. In our experience, the fastest improvement comes from cleaning the denominator - removing bounced contacts, disqualified leads, and zombie opportunities that were never real. One Prospeo customer, Meritt, saw bounce rates drop from 35% to under 4% after switching their verification workflow, which alone shifted their pipeline math by several points without closing a single additional deal.

Respond faster. That 9x conversion lift from 5-minute response time is one of the highest-leverage improvements available. Audit your inbound response SLA this week.
Coach from per-rep data. If one rep closes at 30% and another at 12% on the same lead pool, the gap isn't leads - it's skill. Stage-level data by rep tells you exactly where each person needs coaching. Skip the generic "closing techniques" workshops and drill into the specific stage where each rep loses deals.
If you're rebuilding your outbound motion, start with sales prospecting techniques and a tighter Ideal Customer Profile before you scale volume.
Meritt dropped bounce rates from 35% to under 4% with Prospeo - and tripled their pipeline from $100K to $300K per week. When every contact in your CRM is verified, your closing ratio stops being a vanity metric and starts being a growth lever. 300M+ profiles, $0.01 per email, no contracts.
Stop inflating your denominator with dead leads.
FAQ
How do you calculate closing rate?
Divide closed deals by total opportunities, then multiply by 100. For example, 40 closed deals from 200 opportunities = 20%. Use the formula - (Closed / Total Opps) x 100 - consistently across your team so everyone measures from the same baseline. A rolling 3-month window smooths out deal-cycle variance and keeps one big month from distorting the picture.
What's a good closing ratio?
The cross-industry average is roughly 20%. Above 25% is strong for most B2B sectors, and elite performers hit 40%+ win rates on qualified pipeline. Biotech averages ~15%; business/industrial runs closer to 27%. Compare against your specific vertical, not a generic number.
Close rate vs. win rate - what's the difference?
Close rate uses all leads as the denominator; win rate uses only qualified opportunities, so it's typically higher - 47% on average per RAIN Group. Use close rate for marketing alignment and win rate for sales coaching. Mixing them up will distort your forecast.
How can bad data affect my closing ratio?
Bounced emails and wrong numbers inflate your denominator with fake opportunities, dragging your ratio down artificially. Cleaning your contact data before it enters the CRM is the single fastest way to get an accurate read on your actual conversion performance - and often reveals that your team is closing better than the numbers suggest.