How to Build a Cold Calling Tracking Sheet That Actually Improves Your Numbers
It's Friday afternoon. Your sales manager pulls up the team spreadsheet and sees 1,200 dials logged this week, 6 meetings booked, and zero insight into why. No connect rates. No call durations. No way to tell whether the problem is the list, the script, or the timing.
That spreadsheet isn't a cold calling tracking sheet - it's an activity log pretending to be one.
Why Most Cold Call Trackers Fail
The difference between activity logging and outcome tracking is the difference between "what happened" and "what to change." Every template you'll find online gives you a blank grid with five columns and zero formulas. Name, phone, date, outcome, notes. That's a call log, not a diagnostic tool.
A real tracking sheet tells you why your numbers look the way they do. It separates data problems from skill problems. It shows you whether Tuesday at 10 AM actually outperforms Thursday at 3 PM for your specific market, and it gives you benchmarks so you stop comparing yourself to people selling completely different products at completely different price points.
You deserve better than a blank grid.
What You Need (Quick Version)
A cold calling tracking sheet that works needs three things most templates skip:
- 12 columns covering prospect info, call details, and outcomes - not the usual five
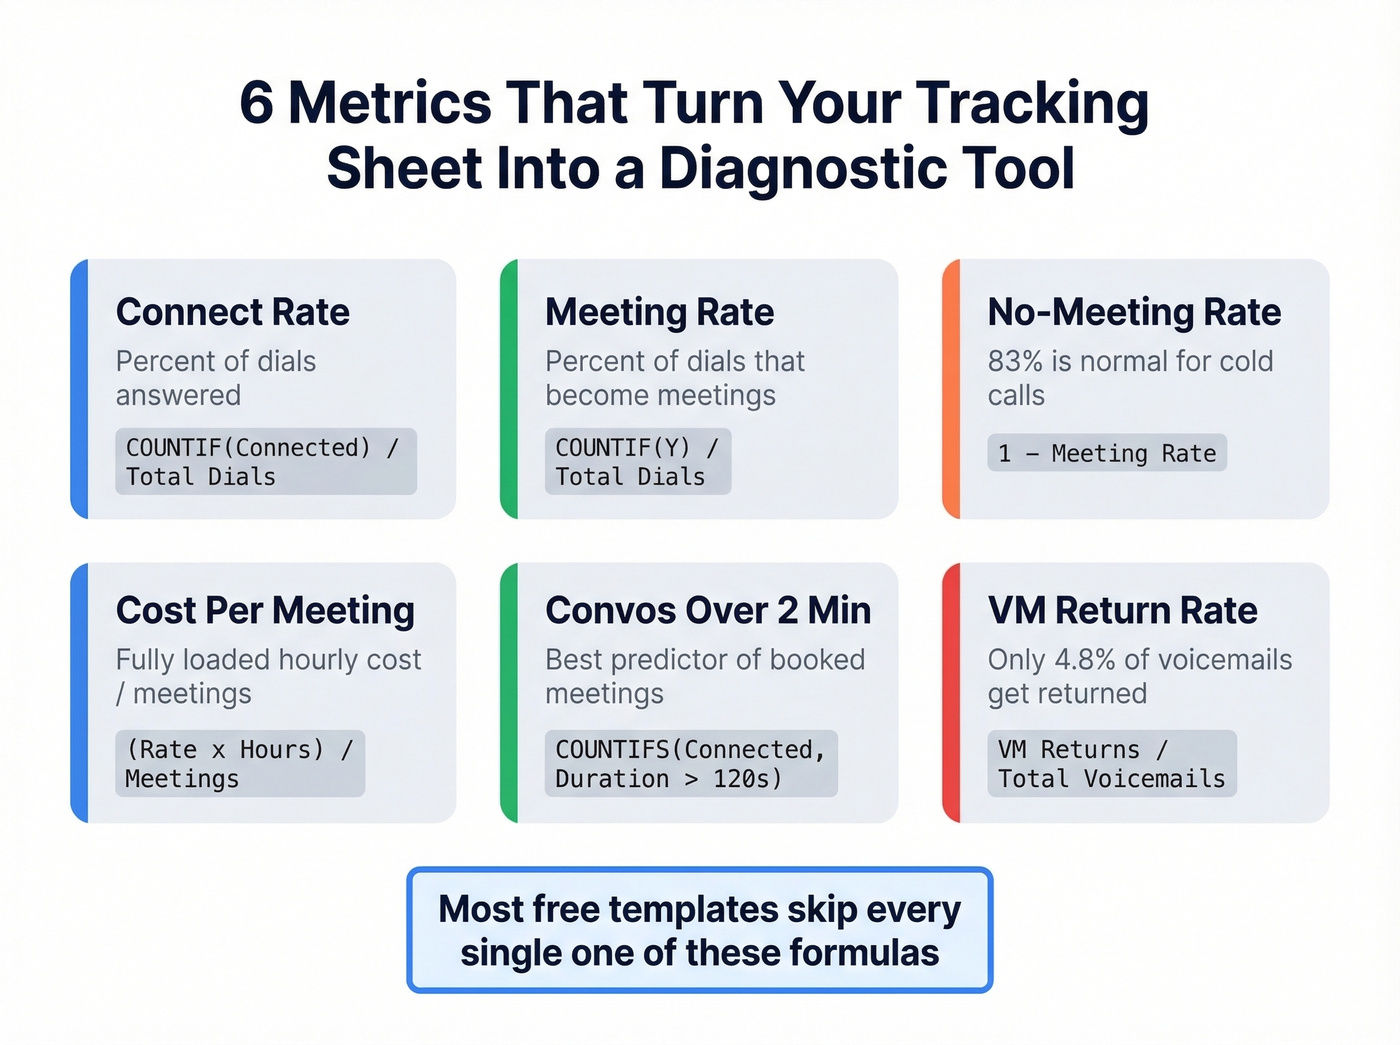
- 6 auto-calculated metrics: connect rate, meeting rate, no-meeting rate, cost per meeting, conversations over 2 minutes, and voicemail return rate
- Industry benchmarks baked in so you know whether a 2% conversion rate is terrible or close to average (it's close to average)
- A data quality check - if your connect rate sits below 10%, the problem is probably your phone numbers, not your reps
The rest of this guide walks through each piece with formulas, benchmarks, and the operational habits that make the sheet useful beyond week one. If you just want a quick-start file, skip to the FAQ for notes on grabbing a cold call tracking sheet PDF.
The 12 Columns Your Sheet Needs
Most templates give you name, phone, date, outcome, notes - five columns and only part of what you need. The full set breaks into three groups.
Prospect Info (6 Columns)
| Column | Why It's There |
|---|---|
| Name | Match to CRM records |
| Company | Segment later |
| Title | Track by seniority |
| Phone | Direct dial or main line |
| Follow-up sequences | |
| Lead Source | A/B test lists |
The lead source column is the one most people skip, and it's arguably the most important. If you're pulling contacts from two different providers, you need to know which one delivers better connect rates. One practitioner on r/sales recommends testing on cohorts of 100-300 leads sharing the same industry and persona - the lead source column makes that possible.
Call Details (3 Columns)
Date, time of day, and attempt number. The time column lets you validate mid-week + late-morning timing (Tuesday/Wednesday, 10 AM-noon) against your own data. Attempt number matters because most prospects need 6-8 call attempts before engaging - logging this prevents reps from giving up after two tries.
Outcomes & Actions (3 Columns)
Disposition (connected, voicemail, no answer, wrong number), duration, and next action with a follow-up date. Add a "meeting booked Y/N" flag and a notes column for objections. Flagging conversations over 2 minutes as a quality proxy is one of the most underrated metrics in any cold call tracker - we've seen it predict booked meetings more reliably than raw dial count.
Tracking Metrics That Matter (With Formulas)
Here's where your sheet stops being a log and starts being a tool.
Assumed column layout (adjust letters to match your sheet):
- I: Disposition (Connected / Voicemail / No Answer / Wrong Number / VM Return)
- J: Call Duration (in seconds)
- K: Meeting Booked (Y/N)
| Metric | What It Measures | Google Sheets Formula |
|---|---|---|
| Connect Rate | % of dials answered | =COUNTIF(I:I,"Connected")/COUNTA(I:I) |
| Meeting Rate | % of dials that become meetings | =COUNTIF(K:K,"Y")/COUNTA(I:I) |
| No-Meeting Rate | % of dials producing no meeting | =1-(COUNTIF(K:K,"Y")/COUNTA(I:I)) |
| Cost Per Meeting | Fully loaded cost / meetings | =(hourly_rate*hours_worked)/COUNTIF(K:K,"Y") |
| Convos >2 Min | Connected calls longer than 120s | =COUNTIFS(I:I,"Connected",J:J,">120") |
| VM Return Rate | Voicemails returned | =COUNTIF(I:I,"VM Return")/COUNTIF(I:I,"Voicemail") |
Here's the thing: a 2% conversion rate sounds terrible until you do the math on deal size. But the no-meeting rate is the metric that stings most. In one well-documented Reddit framework, cold calling showed 83% waste - meaning 83% of dials produced no meeting. Cold email ran 92%. That's normal. The goal isn't zero waste; it's knowing your waste rate so you can improve it by 2-3 points per quarter.
The voicemail return rate deserves special attention. Only 4.8% of cold voicemails get returned. If you're leaving 50 voicemails a day, that's about 12 callbacks per week. Knowing this changes how you allocate voicemail time - keep them under 20 seconds and move on.
Most templates online skip every single one of these formulas. That's the gap we're filling.
If you're building this inside Google Sheets, it also helps to understand how COUNTIF works so you can customize the metrics for your own dispositions.
If your connect rate sits below 10%, your tracking sheet is diagnosing a data problem - not a skills problem. Prospeo's 125M+ verified mobile numbers deliver a 30% pickup rate, turning your "wrong number" column from the longest in your sheet to the shortest.
Stop tracking bad numbers. Start dialing verified direct lines at $0.01 per contact.
Cold Calling Benchmarks for 2026
Numbers without context are meaningless. Here's what "good" actually looks like.
Activity Benchmarks
| Metric | Benchmark |
|---|---|
| Daily calls (avg) | 33 |
| Daily conversations | 6.6 |
| Calls per appointment | 209 |
| Answered calls per appointment | 59 |
| Successful call duration | 5:50 |
| Failed call duration | 3:14 |
| Calls that don't reach a human | 72% |
| Calls going to voicemail | 80% |
Top performers push 60-100 dials per day, but raw dial count is a vanity metric. The number that matters is daily conversations - 6.6 is the average, and getting that to 8-10 is where real pipeline growth happens. Teams that track conversations over 2 minutes see faster improvement than those fixated on dial count, because conversation quality is the leading indicator of booked meetings.
87% of Americans ignore calls from unknown numbers. That's not a reason to stop calling - it's a reason to obsess over data quality and timing rather than raw volume. And despite that screening behavior, 82% of buyers say they accept meetings with sellers who reach out cold at least occasionally. The phone works. You just need to reach the right person at the right time.
One SDR manager on r/SalesOperations shared that their 12-person team averaged a 6% connect rate across thousands of dials and considered that normal. It shouldn't be. A 6% connect rate usually signals a data problem, not a skills problem.
Conversion Rates by Industry
| Industry | Conversion Rate | Calls per Sale |
|---|---|---|
| Janitorial/Cleaning | 2.85% | 35 |
| Business Services | 2.61% | 38 |
| Real Estate | 2.20% | 45 |
| Financial Services | 1.54% | 65 |
| Technology/Software | 0.95% | 105 |
| Industrial Equipment | 0.88% | 114 |
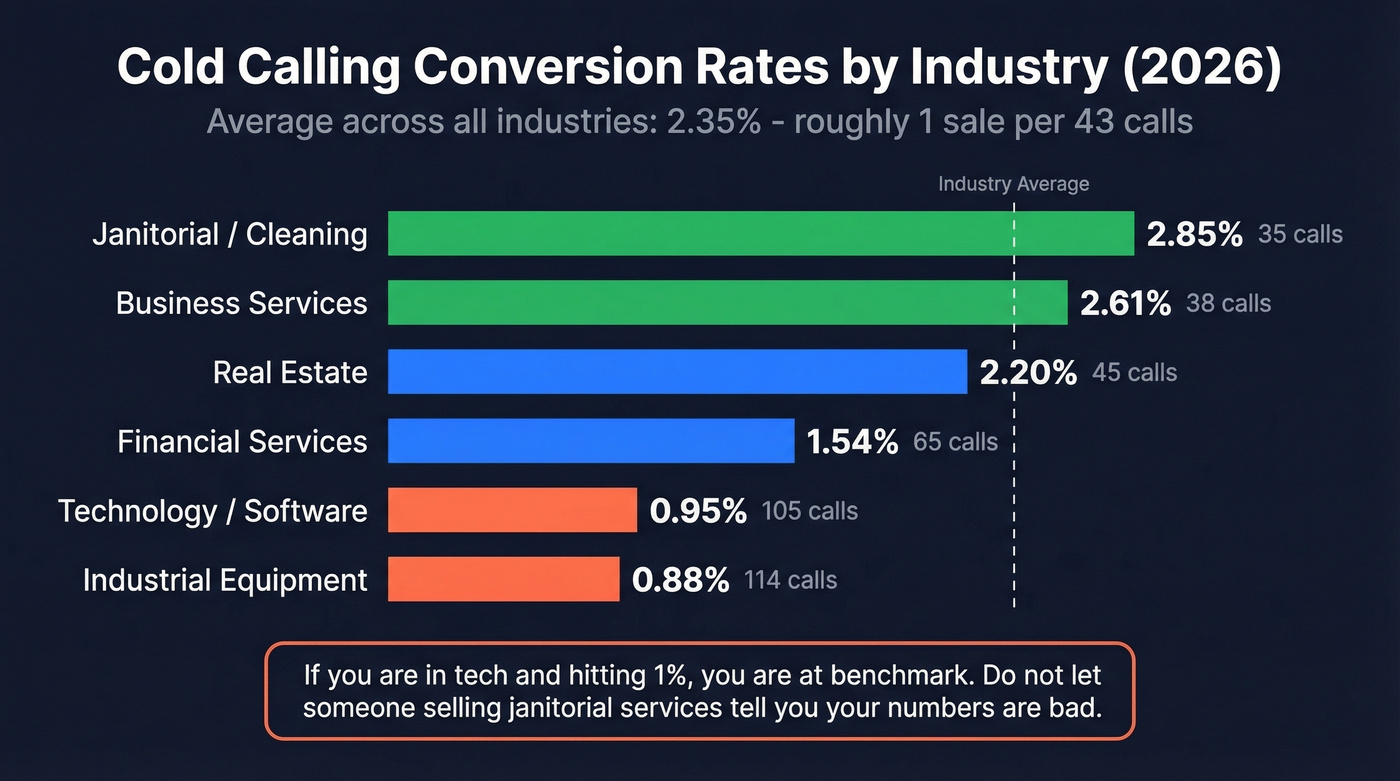
The average across industries is 2.35% - roughly 1 sale per 43 calls. If you're in tech and hitting 1%, you're performing at benchmark. Don't let someone who sells janitorial services tell you your numbers are bad.
Conversion Rates by Deal Size
| Deal Size | Conversion Rate |
|---|---|
| $500-$10k | 2.64% |
| $10k-$50k | 2.34% |
| $100k-$500k | 1.74% |
| $1M-$5M | 1.16% |
Bigger deals convert at lower rates. That's not a problem - it's math. A 1.16% conversion rate on $3M deals is wildly profitable. If your average contract value sits below $15k, you probably don't need 100 dials a day. You need 50 dials to better numbers. The real advantage is in list quality, not list length.
Tuesday and Wednesday generate 44% of all demos, and 10 AM-noon is a top connect window. Build those timing insights into your sheet's time column.
Fix Your Data Before You Dial
Your SDR team made 400 dials last week and booked 2 meetings. Before you fire anyone, check this: a big chunk of your numbers are probably disconnected.
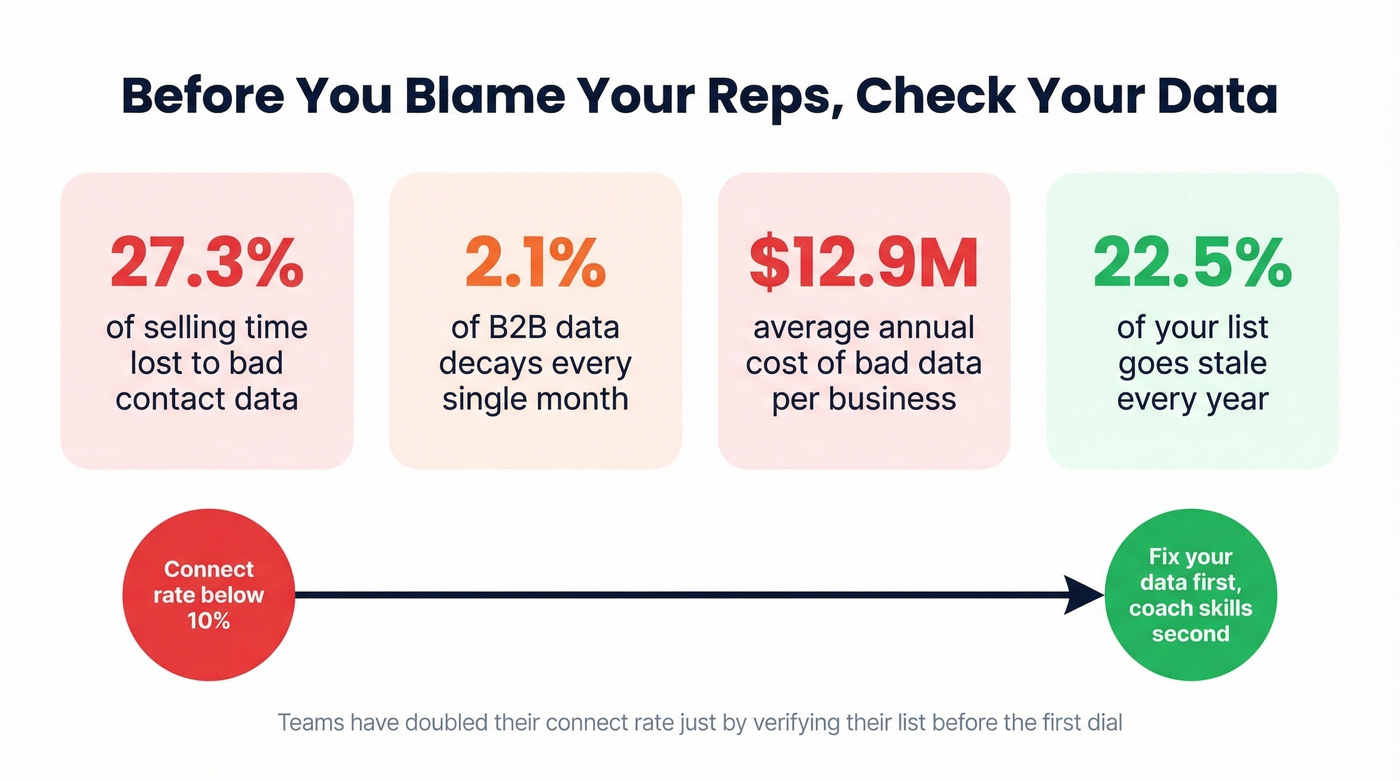
That scenario is more common than most managers realize. Reps lose 27.3% of their selling time to bad contact data. B2B data decays at roughly 2.1% per month - that's 22.5% of your list going stale every year. People change jobs, companies switch phone systems, direct dials get reassigned. Bad data costs businesses $12.9M per year on average, and most of that cost is invisible. It shows up as "low connect rates" that get blamed on reps instead of lists.
If your connect rate is stuck below 10%, check your data before blaming your team. We've seen teams double their connect rate just by running their list through verification before the first dial.
Prospeo refreshes its entire database every 7 days - compared to the 6-week industry average - so you're not dialing numbers that went dead a month ago. The mobile database covers 125M+ verified numbers with a 30% pickup rate, and email verification runs at 98% accuracy. The free tier gives you 75 emails and 100 Chrome extension credits per month, enough to test whether data quality is actually your bottleneck.
Building a Goals-vs-Actuals Dashboard
A tracking sheet without targets is just a diary. Add a dashboard tab that makes your weekly reviews productive.
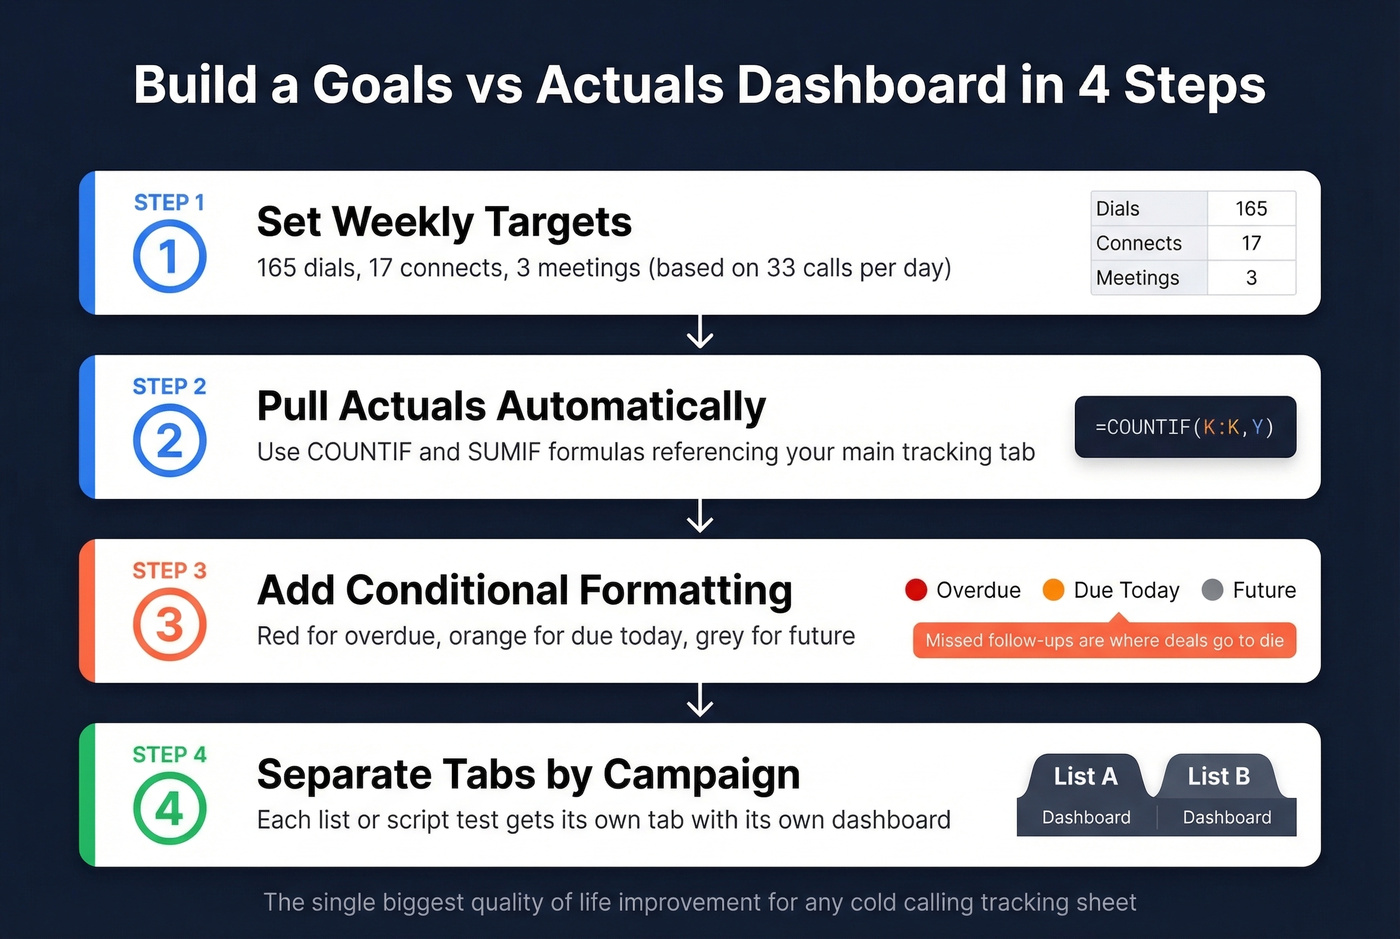
Step 1: Set weekly targets. Create a row with goals for total dials, connects, conversations over 2 minutes, and meetings booked. Base these on the benchmarks above - if you're making 33 calls per day, your weekly target is roughly 165 dials.
Step 2: Pull actuals automatically. Use COUNTIF and SUMIF formulas referencing your main tracking tab. Your actuals row should auto-populate.
| Metric | Weekly Goal | Actuals | % of Goal |
|---|---|---|---|
| Dials | 165 | =COUNTA(...) | =Actuals/Goal |
| Connects | 17 | =COUNTIF(...) | =Actuals/Goal |
| Meetings | 3 | =COUNTIF(...) | =Actuals/Goal |
Step 3: Add conditional formatting. Red for overdue follow-ups, orange for due today, grey for future. The formula =TODAY() handles date comparisons automatically. Missed follow-ups are where deals go to die - this single addition is the biggest quality-of-life improvement you can make to any cold calling tracking sheet.
Step 4: Separate tabs by campaign or cohort. If you're testing two different lists or scripts, each gets its own tab with its own dashboard. The 6-report dashboard concept from OnepageCRM is worth stealing - charts for connect rate trend, meetings by day of week, and conversion by lead source give you everything you need in one view.
If you want to go deeper on what to track beyond calls and meetings, borrow a few ideas from funnel metrics and add them as optional dashboard tiles.
Follow-Up Tracking Habits
The best tracking sheet in the world is useless if nobody updates it. Friday afternoon reviews work well because the data is fresh and Monday planning benefits immediately. But daily habits matter more than the weekly review.
Update between call blocks, not at end of day. Memory fades fast. Dispositions get fuzzy after 30 calls, and reps default to "no answer" for everything when they're logging from memory at 5 PM. Keep the sheet open in a second tab and log outcomes in real time - it takes 10 seconds per call and saves 30 minutes of end-of-day reconstruction.
Separate tabs by cohort whenever you're testing something new. New script? New list source? Give it 100-300 leads in its own tab so you can measure cleanly. This is how you turn a tracking sheet into a testing framework.
- Color-code follow-ups. Red/orange/grey formatting means you never open the sheet wondering "what do I do first?"
- Add a hypothesis column. If you're testing whether calling at 8 AM beats 10 AM, write it down. Track it. Kill it or scale it based on data, not gut feel.
- Review weekly, adjust monthly. One change per week is the right cadence. More than that and you can't isolate what worked.
If your follow-ups are mostly email, keep a few proven sales follow-up templates handy so reps don’t reinvent the wheel.
When to Ditch the Spreadsheet
A Google Sheet handles 90% of what a solo SDR or two-person team needs. You don't need a CRM until the spreadsheet actively hurts you.
Skip the CRM upgrade until you hit at least one of these: you have 3+ reps and version conflicts start (multiple "master" copies floating around), deals get buried in rows and follow-ups slip through cracks, onboarding a new rep takes a week because nobody documented the conventions, or you need pipeline visibility that a flat spreadsheet can't provide.
One sales manager on Reddit described their CRM as a "gaz factory" - overbuilt, underused, and more work than the spreadsheet it replaced. That's what happens when you upgrade too early. The spreadsheet phase teaches you what you actually need from a CRM, so don't skip it. Whether you're running a cold calling tracking sheet in Excel or a shared Google Sheet, the lessons transfer directly into CRM configuration later.
If you're still deciding what "counts" as a CRM, these examples of a CRM make the tradeoffs clearer.
CRM price ranges to expect: HubSpot offers a free tier that's genuinely useful, with paid plans from ~$20/user/month. Pipedrive runs ~$15-25/user/month. Salesforce starts around $25/user/month but realistically lands at $50-80/user/month once you add what you need. Prospeo integrates natively with Salesforce and HubSpot, so your verified contacts transfer cleanly when you graduate from the spreadsheet.
When you do upgrade, pairing your CRM with the right SDR tools can keep your process lightweight instead of bloated.
That lead source column we told you to add? Fill it with Prospeo and watch your benchmarks shift. Teams using our 7-day refreshed data cut bounce and wrong-number rates below 4% - turning 209 calls per appointment into far fewer.
Your tracking sheet is only as good as the data feeding it. Make every dial count.
FAQ
What's the best format for a cold calling tracking sheet?
Google Sheets is the best format - it's free, supports formulas and conditional formatting, and lets multiple reps update simultaneously. If you prefer working offline, save a copy as .xlsx; all formulas carry over to Excel without issues.
Can I download a cold call tracking sheet PDF?
A PDF works as a printable daily reference for reps who prefer paper, but it can't auto-calculate metrics. Use it alongside your live spreadsheet - print for desk reference, enter data digitally so formulas stay current.
What's a good cold call conversion rate?
The cross-industry average is 2.35%, but it varies widely: tech sits at 0.95%, janitorial services at 2.85%. Always benchmark against your specific industry and deal size rather than generic averages.
How do I improve my connect rate fast?
Start with data quality - verify phone numbers before dialing. Teams using a 7-day refresh cycle and verified mobile databases routinely see connect rates jump from under 10% to 20%+. Then optimize timing: mid-week, 10 AM-noon consistently outperforms other windows.
When should I switch from a spreadsheet to a CRM?
Switch when you have 3+ reps, experience version conflicts, or regularly miss follow-ups due to spreadsheet limitations. HubSpot's free CRM tier is the easiest first step - it handles pipeline visibility without the complexity of Salesforce.