How to Build a CRM Sales Pipeline Report That Doesn't Lie to You
It's Thursday afternoon. The board wants a pipeline update. Your VP of Sales pulls up a CRM sales pipeline report showing $2.4M closing this quarter, but half those deals haven't had a next step logged in three weeks. Only 7% of sales organizations achieve 90%+ forecast accuracy, and 79% miss their forecast by more than 10%. That's not a reporting problem. It's a data problem disguised as one, costing the typical B2B company 3-5% of potential revenue in leakage every year.
Here's the thing: you need exactly three reports. A pipeline-by-stage summary, a stalled-deal exception report, and a stage conversion rate tracker. Review them weekly - teams that track weekly average 87% forecast accuracy versus 52% for ad-hoc teams. But none of it matters if your CRM data is stale. Start with data hygiene, then build reports on clean numbers.
The 7 Pipeline Metrics That Actually Matter
Pipeline coverage, sales velocity, and stage conversion rate are the big three. Everything else is supporting detail.
| Metric | What It Tells You | Benchmark |
|---|---|---|
| Pipeline Coverage | Quota risk | 3:1 minimum |
| Sales Velocity | Revenue per day | Varies by industry |
| Win Rate | Close efficiency | 20-28% B2B avg |
| Stage Conversion | Funnel leaks | See below |
| Avg Deal Size | Revenue density | Segment-specific |
| Deal Age | Stall risk | Compare to cycle |
| Quota Attainment | Rep performance | 100% target |
Pipeline coverage is simple: total pipeline value divided by quota. Below 2:1, stop building reports and start generating pipeline. The 3:1 ratio is the floor for predictable quarters - anything less and you're flying blind into month three.
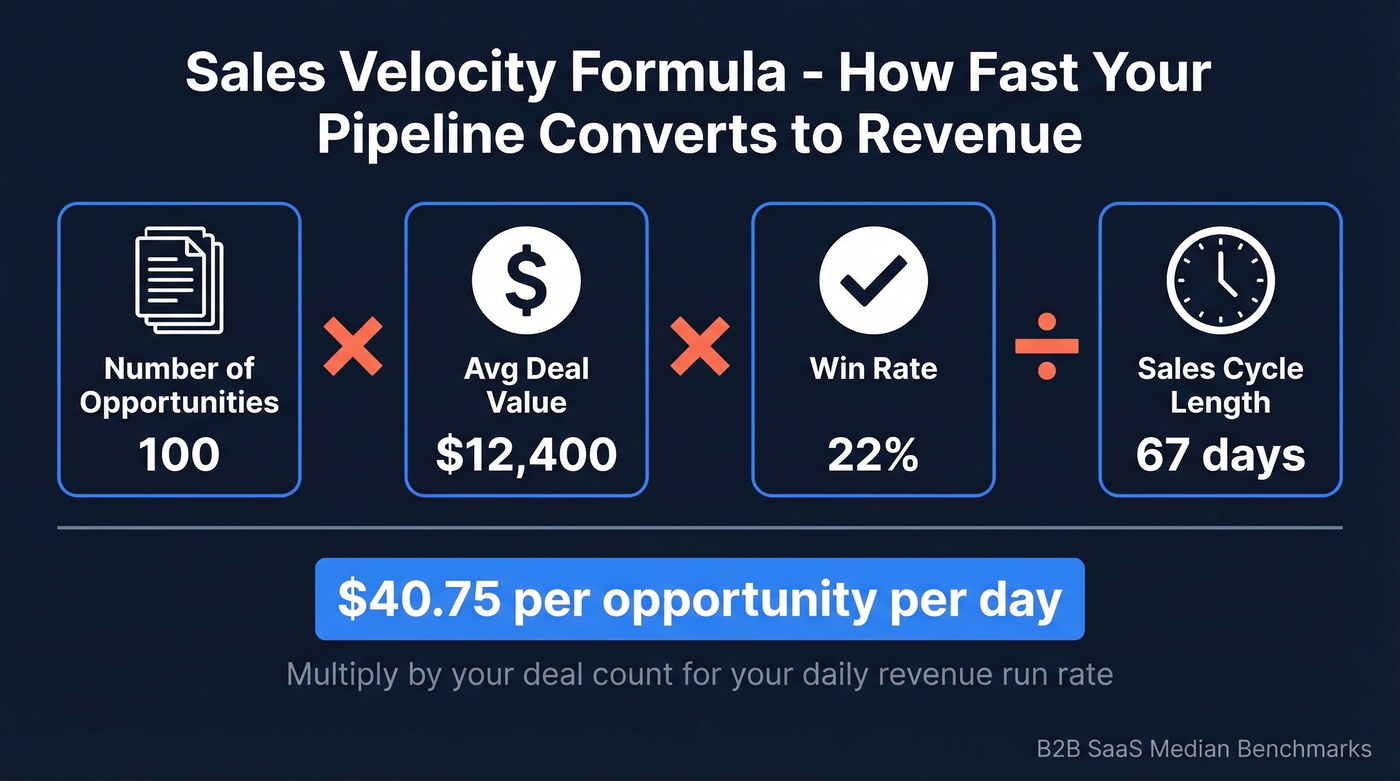
Sales velocity tells you how fast pipeline converts to revenue: (Number of Opportunities x Average Deal Value x Win Rate) / Sales Cycle Length. For a SaaS team, that looks like $12,400 x 22% / 67 days = $40.75 per opportunity per day. Multiply by your deal count for your daily revenue run rate.
Weighted pipeline (deal value x stage probability) is still the default forecasting method in most CRMs. AI-based forecasting improves accuracy by up to 15% over weighted models, but you need clean stage data for either approach to work.
Pipeline Benchmarks by Industry
A 247-organization benchmark study across North American B2B companies gives us real numbers to work with:
| Industry | Win Rate | Cycle | Velocity |
|---|---|---|---|
| SaaS & Tech (median deal $12,400) | 22% | 67 days | $1,847/day |
| Manufacturing | 19% | 124 days | $1,289/day |
| Prof. Services | 28% | 51 days | $876/day |
Company size shifts the picture dramatically. $1M-$5M companies close at 26% with 43-day cycles. $500M+ enterprises drop to 17% win rates but run $12,945/day in velocity because deal sizes are massive.
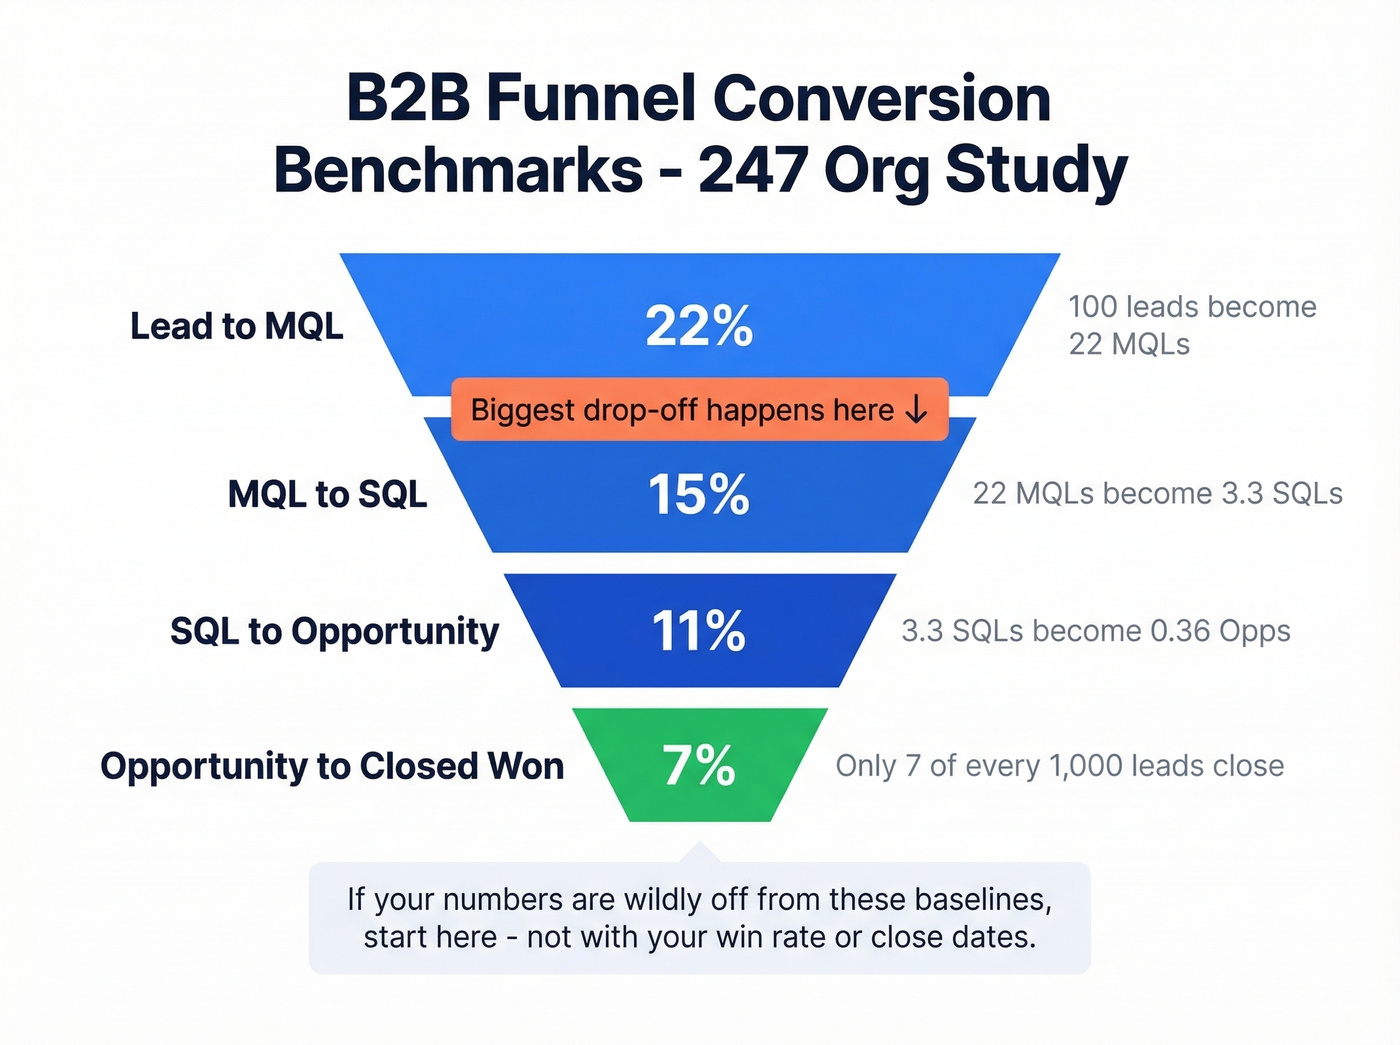
We've found that funnel conversion benchmarks are where most teams lack context. Here's what "normal" looks like:
| Stage | Conversion Rate |
|---|---|
| Lead to MQL | 22% |
| MQL to SQL | 15% |
| SQL to Opportunity | 11% |
| Opportunity to Closed Won | 7% |
The biggest drop-off is MQL to SQL, and in our experience, that's where most teams lose deals without realizing it. If your numbers are wildly off from these baselines, that's your starting point - not your win rate, not your close dates.
That MQL-to-SQL drop-off? Often it's not a nurture problem - it's a data problem. Stale emails, wrong titles, departed contacts. Prospeo enriches your CRM every 7 days with 98% email accuracy and an 83% match rate, so your pipeline reflects real buyers, not ghosts.
Stop forecasting on phantom deals. Start with clean data.
How to Build Your Report in HubSpot and Salesforce
Start with two reports: a pipeline-by-stage summary and a stalled-deal exception report. Add complexity later.
HubSpot Setup
Navigate to Reporting > Reports > Sales and pick a pipeline report to customize. Use the Over time / Totals toggle - totals for snapshots, over time for trends. Split by owners or teams with the Group by filter, select your Pipeline, and set the Date range to match your review cadence. Pin it to a dashboard for weekly reviews.
Salesforce Setup
The report pattern you want is Close Month x Opportunity Stage, showing total and weighted opportunity values grouped by stage. This reveals what's supposed to close each month and how much is still in early stages - a dead giveaway for waterlogging.
Key fields to include: Next Step, Close Date, Amount, Lead Source, Fit Rating, Competitors, and Closed Lost Reason. During reviews, check for close date slippage and whether early-stage deals can realistically close given your average cycle length. If a deal entered Discovery last week and has a close date of next Friday, someone's lying to the CRM.
Your Review Cadence
Weekly pipeline reviews aren't optional. The same 247-org study found weekly tracking correlates with 34% revenue growth versus 11% for ad-hoc teams.
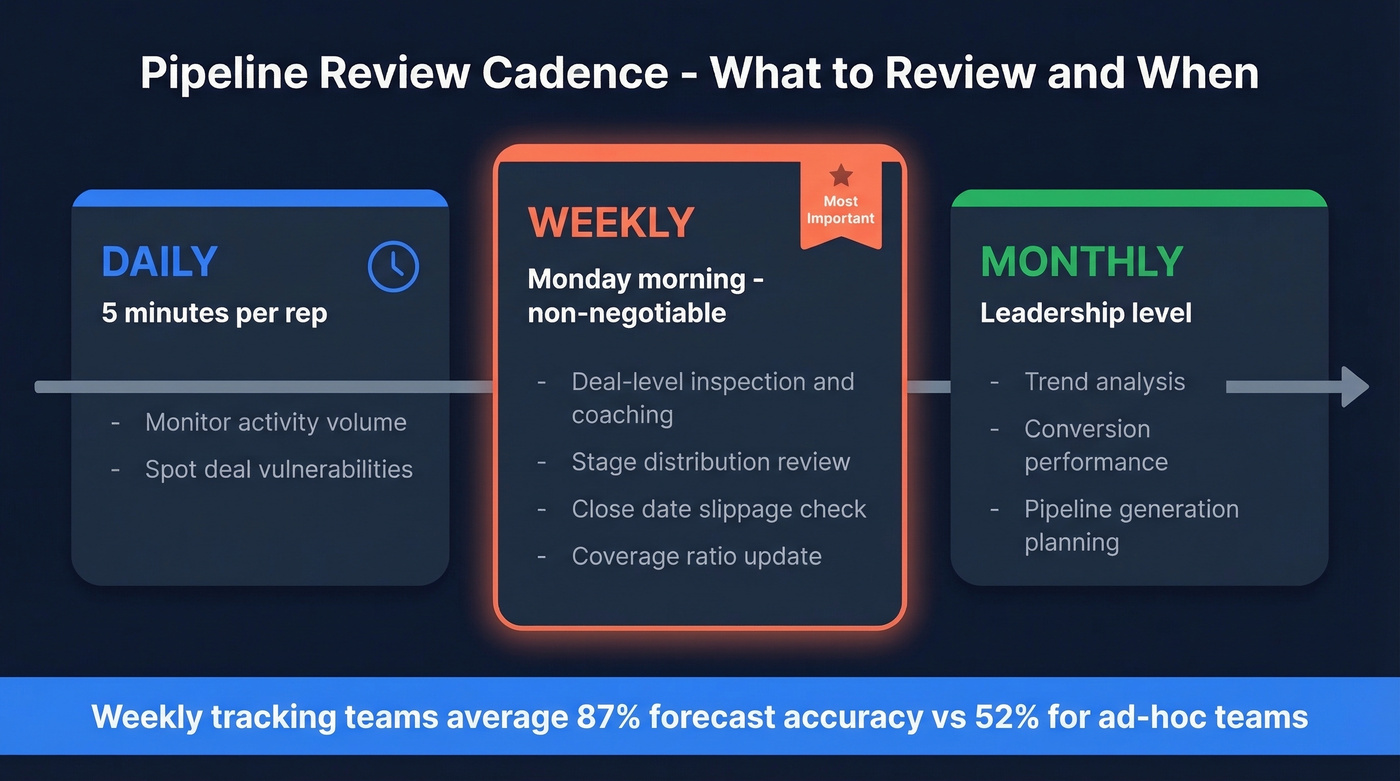
Daily - reps monitor activity volume and spot vulnerabilities. Five minutes, tops.
Weekly - deal-level inspection and coaching. This is where forecasts get real. Reps should see their deals, next steps, and activity gaps. Managers need stage distribution, slippage patterns, and coverage ratios. If you only do one thing from this article, make it a standing Monday morning pipeline review.
Monthly - trend analysis, conversion performance, and pipeline generation planning at the leadership level.
Let's be honest: most teams would get more forecast accuracy from enforcing weekly close-date updates than from buying a $100K forecasting tool. We've seen forecast accuracy jump dramatically with nothing more than a Monday morning deal hygiene check.
Why Most Pipeline Reports Fail
You don't need 15 pipeline reports. You need three good ones that you actually review every week. Here's what kills the rest:
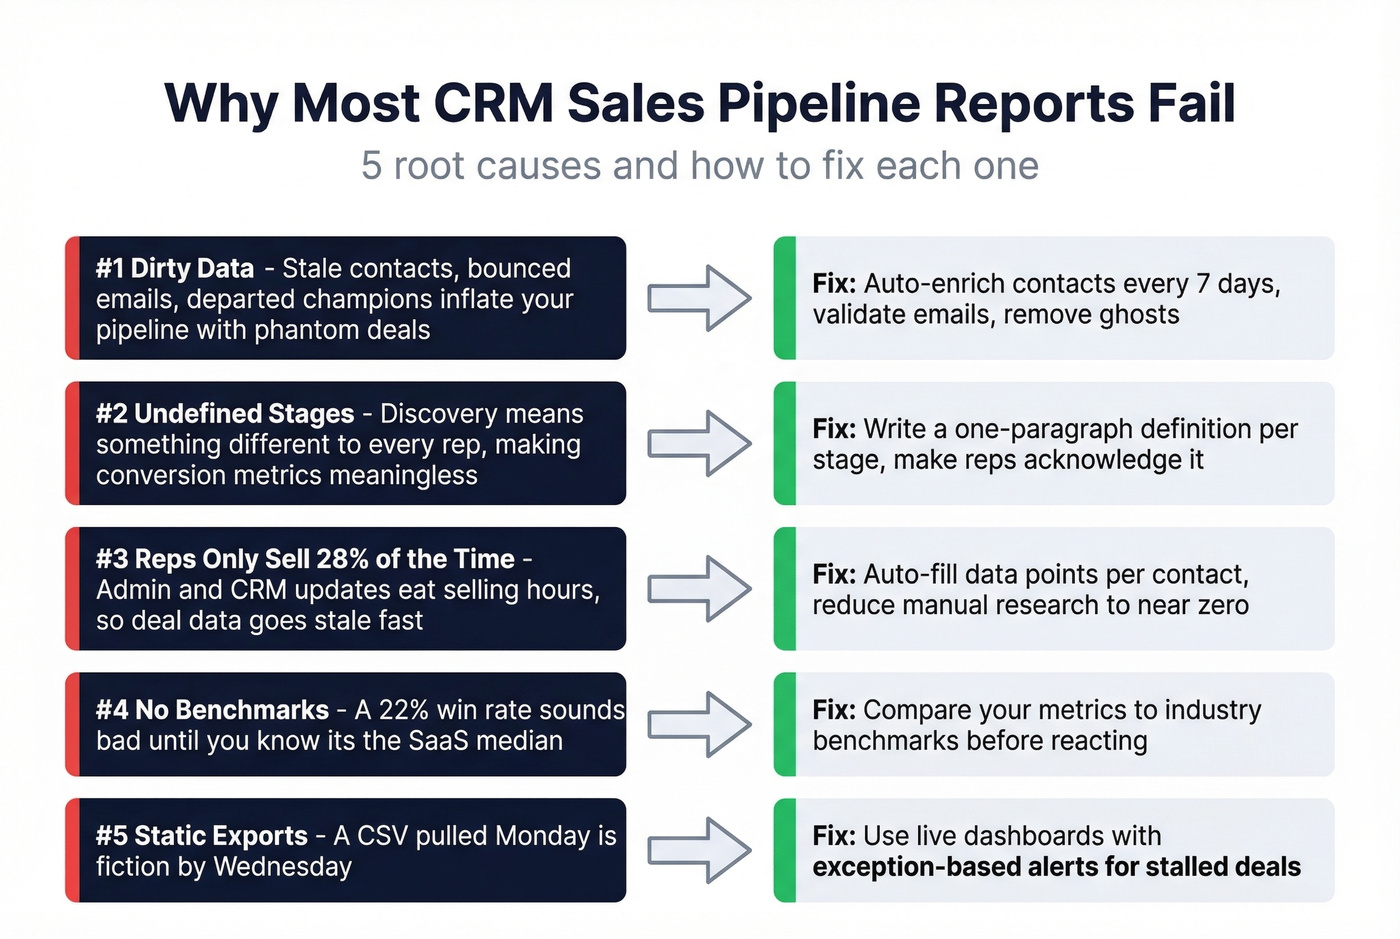
Dirty data is the #1 problem. Stale contacts - bounced emails, dead phone numbers, departed champions - inflate your pipeline with deals that aren't real. Prospeo's CRM enrichment refreshes contacts every 7 days with 98% email accuracy and an 83% match rate, which eliminates a huge source of phantom pipeline. The consensus on r/sales is pretty clear: garbage data in, garbage forecasts out.
Undefined stages. If "Discovery" means something different to every rep, your stage conversion metrics are meaningless. Write a one-paragraph definition for each stage and make reps acknowledge it.
Reps spend only 28% of their time selling. The rest is admin, CRM updates, and internal meetings. When selling time is that scarce, deal data goes stale fast. (If you're trying to claw time back, SDR tools can help automate the busywork.)
No benchmarks. A 22% win rate sounds bad until you realize it's the SaaS median. Without context, you're reacting to noise. If you want more baselines, start with sales pipeline benchmarks.
Static exports instead of live dashboards. A CSV pulled on Monday is fiction by Wednesday. What you need is exception-based reporting that surfaces stalled deals and slipped close dates automatically - management by exception, not management by spreadsheet. If your team is still emailing around Excel files for pipeline reviews, skip everything else in this article and fix that first.
The biggest pipeline reporting problem isn't your CRM's reporting UI. It's that your reps haven't updated their deals in two weeks.
You just read that reps spend only 28% of their time selling. Prospeo's CRM enrichment auto-fills 50+ data points per contact - verified emails, direct dials, job titles - at $0.01/lead. No manual research, no stale records inflating your pipeline coverage ratio.
Give your reps selling time back and your pipeline reports the truth.
FAQ
What's a good pipeline coverage ratio?
3:1 minimum - three dollars in pipeline for every dollar of quota. Below 2:1, stop refining reports and focus on pipeline generation. Enterprise teams with longer cycles often target 3.5:1 to absorb deal slippage.
How often should I review my CRM sales pipeline report?
Weekly. Teams that track weekly average 87% forecast accuracy versus 52% for ad-hoc teams. Daily five-minute checks by reps and monthly leadership reviews round out the cadence.
How do I keep CRM pipeline data accurate?
Enforce weekly hygiene: close dead deals, update close dates, add next steps to every open opportunity. Layer in automated enrichment tools that refresh contact data on a regular cycle so stale records don't inflate your numbers. And honestly, the simplest fix is making "next step" a required field - if a rep can't articulate what happens next, the deal probably isn't real.