Data-Driven Growth: Why Most Companies Fail and How to Get It Right
Only 35% of digital transformation initiatives actually achieve their objectives. That's BCG's number, drawn from an analysis of 850+ companies. The other 65% bought the dashboards, hired the analysts, maybe even spun up a "data team" - and still couldn't improve outcomes. McKinsey's research tells the other side of the story: data-driven organizations are 23x more likely to acquire customers, 6x more likely to retain them, and 19x more likely to be profitable. The promise is enormous. The execution gap is where companies go to die.
This isn't a technology purchase. It's a cultural operating system. And most companies get the sequence exactly backwards.
The Short Version
Data-driven growth means using quantitative and qualitative data to systematically guide decisions that drive revenue, retention, and efficiency. Start with data quality and governance, not dashboards and AI.
- Assess your data maturity using the framework below
- Fix data quality before buying analytics tools
- Build governance before deploying AI
- Start with spreadsheets, not software
What Data-Driven Growth Actually Means
Most teams hear "data-driven" and picture a Looker dashboard with real-time metrics. That's a fraction of the picture. True data-driven growth means every meaningful business decision - pricing changes, market entry, hiring plans, product roadmap shifts - is informed by evidence rather than gut instinct.
The evidence isn't just product analytics. Practitioners on r/ProductManagement consistently frame data-driven development as something much broader: customer feedback, user interviews, support ticket patterns, and internal signals from sales and CS teams all count. A spike in churn-related support tickets is data. A pattern in lost-deal reasons from your CRM is data. The qualitative stuff matters just as much as the quantitative stuff, and teams that ignore it end up optimizing metrics that don't map to actual business outcomes.
The misconception that "dashboards = data-driven" is dangerous because it lets organizations check a box without changing how decisions actually get made. You can have beautiful charts and still make terrible choices if nobody trusts the underlying data or knows how to act on it.
The Business Case (With Numbers)
The McKinsey numbers are worth repeating because they frame the upside: data-driven organizations are 23x more likely to acquire customers, 6x more likely to retain them, and 19x more likely to be profitable. But those numbers describe the top performers - the ones who got the execution right. They don't describe what happens when you buy Tableau and call it a strategy.
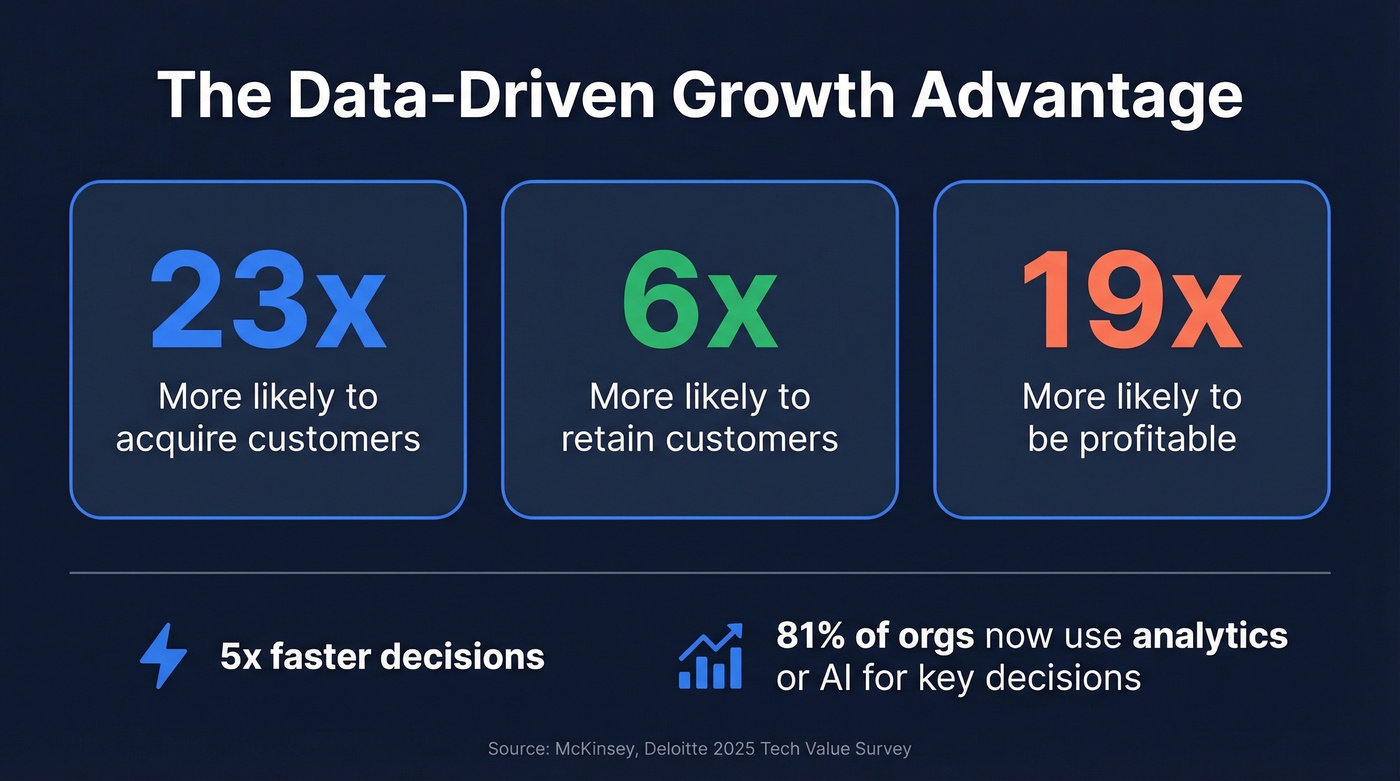
The investment trajectory tells you where the market's headed. A 2025 Tech Value Survey of ~550 leaders found tech budgets rising from 8% of revenue in 2024 to 14% in 2025, with modeling suggesting that could reach 32% by 2028 if the pace continues. The global data-driven decision market is valued at over £40 billion, and 81% of organizations now use analytics or AI for key decisions.
Companies with strong data cultures make decisions 5x faster. That speed matters - faster decisions mean faster iteration, faster market response, and faster learning loops. But speed without accuracy is just moving quickly in the wrong direction.
Why 65% of Initiatives Fail
Understanding failure modes is more valuable than any tool recommendation we can give you.
The Culture Problem
MIT Sloan Review documented a telecom company that built a churn prediction model showing 39% retention improvement potential with simpler ML and 66% with advanced AI. The pilot confirmed the numbers. But when it came time to roll out, product managers refused to act on an "unexplainable" list of at-risk customers. The model worked. The organization didn't.
This isn't an isolated case. NewVantage Partners surveyed Fortune 1000 CIOs and data executives and found that roughly 6 in 10 say they haven't established a data-driven culture. Not "haven't perfected" - haven't established. The disconnect often starts at the top: CEOs think the sales org is data-driven while sales leaders know they're still running on gut instinct and tribal knowledge.
A thread on r/BusinessIntelligence describes a company that poured six figures into a consulting firm for a 5-year data transformation plan and still found it painfully slow. The core issue: leadership drops investment when they don't see short-term results. Data culture is a multi-year commitment, and most executive teams have a multi-quarter attention span.
The Data Quality Problem
IBM estimated that poor data quality costs US businesses $3.1 trillion annually. A 2025 Data Integrity Trends Report found that 64% of organizations cite data quality as their top data integrity challenge. Not analytics capability, not AI readiness - quality.
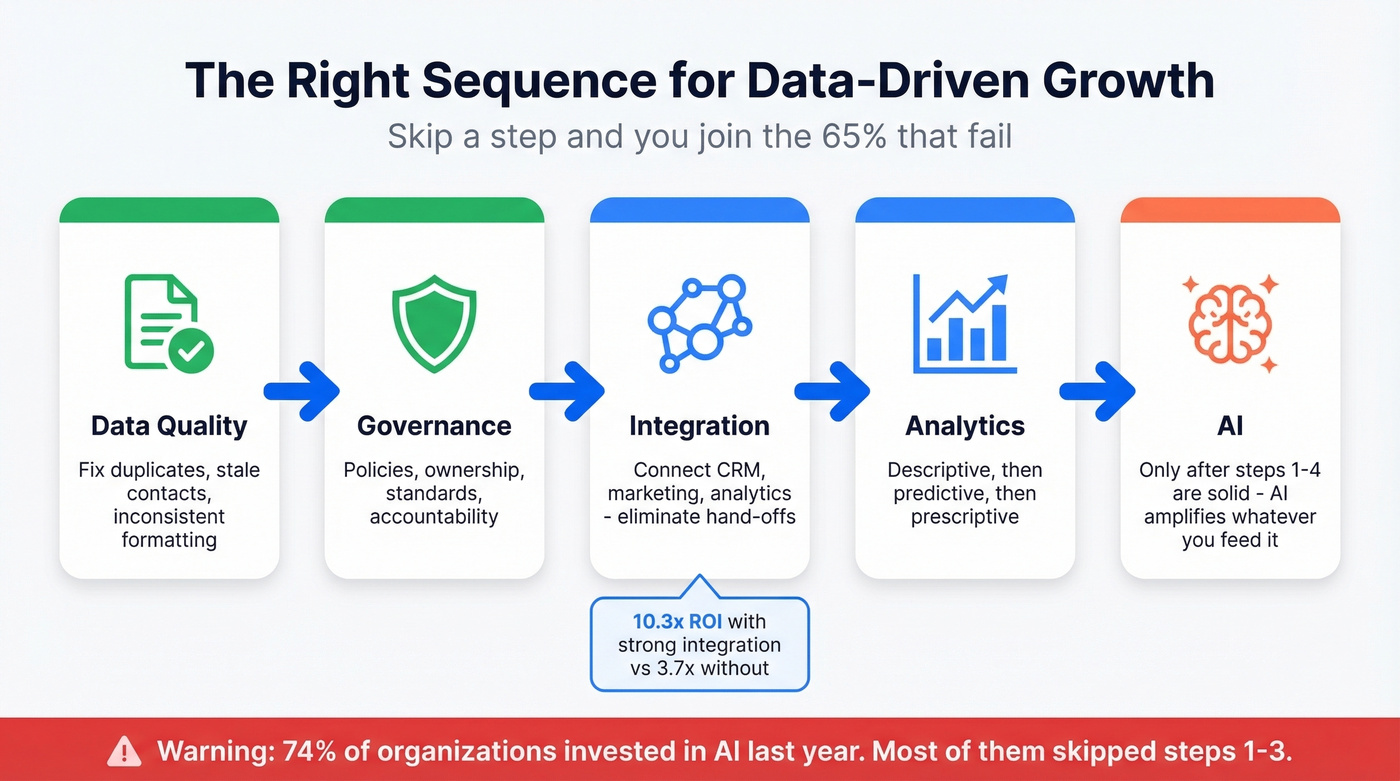
The integration picture is equally grim. Organizations average 897 applications, with only 29% integrated. Your data is scattered across hundreds of tools that don't talk to each other. Organizations with strong integration achieve 10.3x ROI compared to 3.7x for those with poor integration. That's nearly 3x the return just from connecting your systems properly.
The 8-Point Failure Chain
Brent Dykes outlined an 8-step failure taxonomy in Forbes that's worth internalizing:
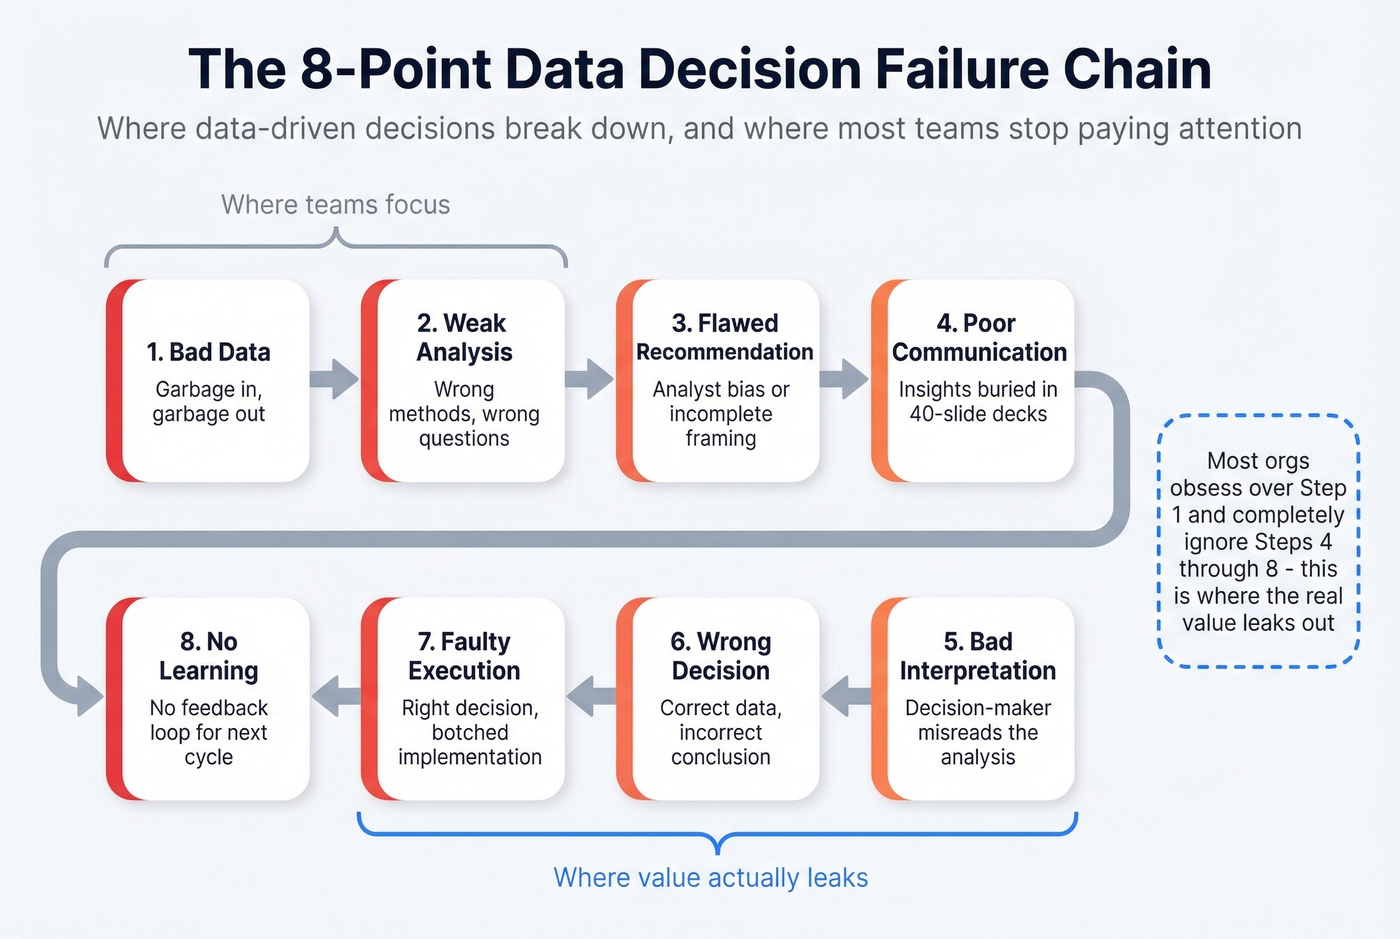
- Bad data - garbage in, garbage out
- Weak analysis - wrong methods, wrong questions
- Flawed recommendation - analyst bias or incomplete framing
- Poor communication - insights buried in a 40-slide deck nobody reads
- Bad interpretation - decision-maker misreads the analysis
- Wrong decision - correct data, incorrect conclusion
- Faulty execution - right decision, botched implementation
- No learning - no feedback loop to improve the next cycle
His railcar leasing example is instructive: a manager offloaded leased railcars to cut costs but failed to factor future demand. When demand returned, the company had to lease at higher rates, wasting millions. The data was available. The analysis was incomplete.
Here's the thing: most organizations obsess over step 1 and ignore steps 4-8. Communication, interpretation, and learning loops are where the real value leaks out. If your company has a "data quality initiative" but no process for closing the feedback loop on decisions made from data, you're solving the wrong problem.
Assess Your Data Maturity
Before you buy anything, figure out where you are. We've adapted a five-stage data governance maturity model into a self-assessment that our team uses internally.
| Stage | Governance | Technical Foundation | Analytics | Culture & Literacy |
|---|---|---|---|---|
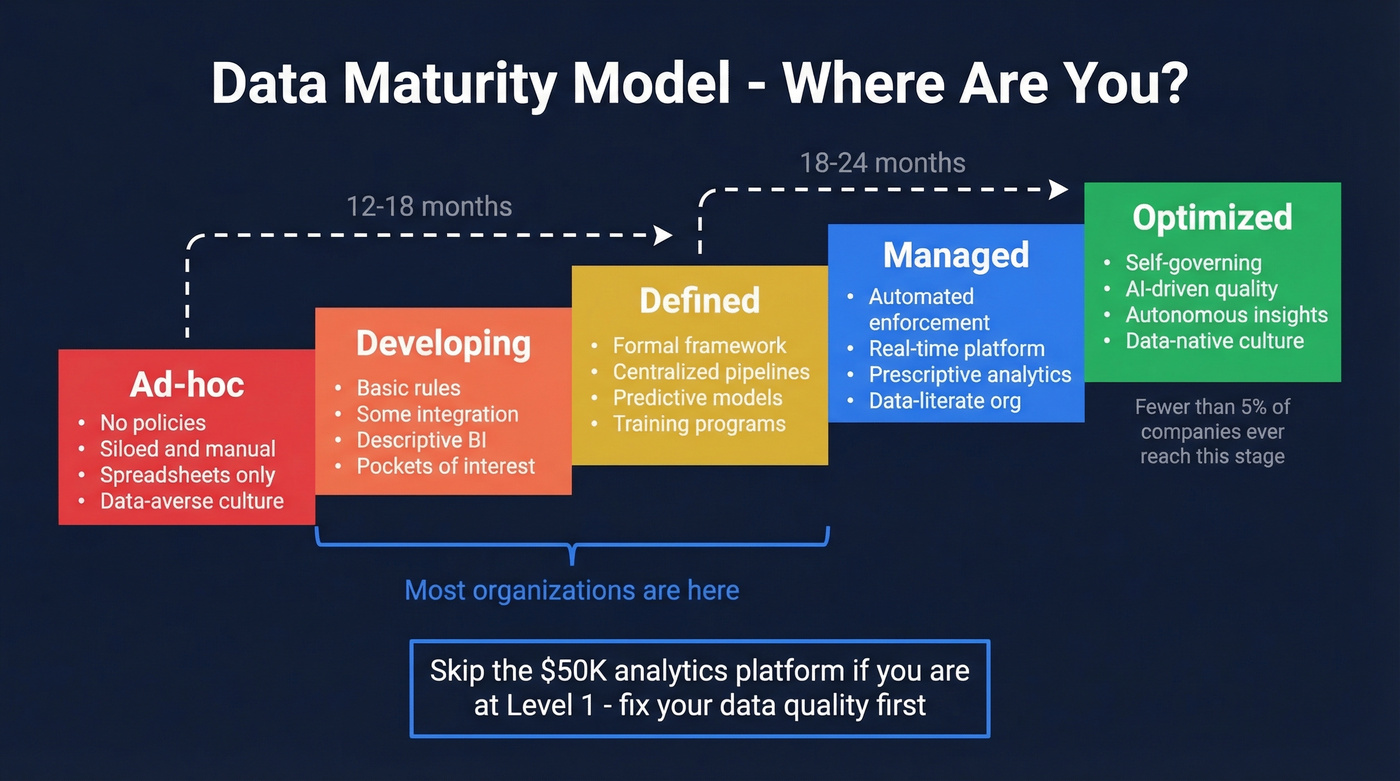
| Ad-hoc | No policies | Siloed, manual processes | Spreadsheets only | Data-averse |
| Developing | Basic rules | Some integration, cloud migration | Descriptive BI | Pockets of interest |
| Defined | Formal framework | Centralized, monitored pipelines | Predictive models | Training programs |
| Managed | Automated enforcement | Real-time, scalable platform | Prescriptive analytics | Data-literate org |
| Optimized | Self-governing | AI-driven quality, adaptive architecture | Autonomous insights | Data-native culture |
Most organizations cluster at levels 2-3. Fewer than 5% ever reach the optimized stage. Moving from level 1 to level 3 typically takes 12-18 months, and reaching level 4 takes another 18-24 months. Anyone selling you a "90-day data transformation" is selling you a fantasy.
Skip the $50K analytics platform if you're at level 1. Fix your data quality. Build basic governance. Get your team comfortable reading dashboards before you ask them to trust predictive models.
The article says 64% of orgs cite data quality as their top challenge. Prospeo solves that at the source: 300M+ profiles verified through a 5-step process, 98% email accuracy, and a 7-day refresh cycle - 6x faster than the industry average. Bad data costs $3.1T a year. Yours doesn't have to contribute.
Fix your data foundation before it poisons every decision downstream.
The Revenue Growth Playbook
Start With Quality and Governance
The BARC Data, BI and Analytics Trend Monitor 2026 - surveying nearly 1,600 participants - confirmed that despite all the AI hype, quality, security, and governance remain the top priorities. Without them, nothing else works.
Define your workflows in spreadsheets before you buy tools. Map out what data you need, where it lives, who owns it, and what "good" looks like. We've seen teams spend six months evaluating CDP vendors when they hadn't even documented their data sources. A Google Sheet with your data inventory, ownership matrix, and quality standards is more valuable than a $200K Snowflake contract you're not ready for.
Then Build Analytics and Integration
Role clarity is the difference between a data initiative that ships and one that stalls in committee. Once your foundation is solid, assign clear responsibilities across three personas:
- Data leaders own governance frameworks, strategy, and literacy investment
- Data professionals own pipelines, validation, integration, and user-friendly tooling
- Data consumers flag anomalies, collaborate cross-functionally, and upskill continuously
Integration is the multiplier. Remember the 10.3x vs 3.7x ROI gap - that delta comes from connecting your systems so data flows without manual intervention. Prioritize integrations that eliminate hand-offs between your CRM, marketing automation, and analytics tools. Build experimentation into the process early: even simple A/B tests on pricing pages or email subject lines create the feedback loops that make RevOps teams genuinely evidence-based. These insights - from conversion rates to deal velocity - compound over time and become the foundation for growing revenue with data instead of guesswork.
AI Comes Last
74% of surveyed organizations invested in AI and generative AI over the past year. Most of them are rushing. AI doesn't fix bad data - it amplifies it. If your CRM is full of duplicates, stale contacts, and inconsistent formatting, AI will just produce confident-sounding garbage faster.
The sequence matters: quality → governance → integration → analytics → AI. Skip a step and you'll join the 65%.
B2B Prospecting: Where Data Quality Hits Revenue
Let's get concrete. B2B contact data is the most overlooked data quality problem in outbound sales. Your sequences, your cadences, your carefully crafted messaging - none of it matters if your list is full of stale or invalid addresses. Bounced emails damage domain reputation, skew pipeline metrics, and waste rep time on contacts who left that company two years ago.
This is the problem Prospeo was built to solve: 98% email accuracy on a 7-day refresh cycle, 125M+ verified mobile numbers with a 30% pickup rate, and pricing at roughly $0.01 per email. Snyk's results show what clean data does for outbound velocity - their bounce rate dropped from 35-40% to under 5%, AE-sourced pipeline increased 180%, and they now generate 200+ new opportunities per month.
You read that only 29% of apps are integrated. Prospeo connects natively to Salesforce, HubSpot, Clay, Zapier, and Make - enriching your CRM with 50+ data points per contact at a 92% match rate. No six-figure consulting engagement required.
Connect your stack to data that's actually accurate for $0.01 per email.
Building Your Growth Stack
You don't need a $500K annual platform budget to be data-driven. SMBs can start a meaningful stack for under $500/month using free tiers and open-source tools. With 14,000+ marketing tools on the market, the temptation is to over-buy. Resist it. Build a composable stack with no long-term contracts, and swap components as your needs evolve.
| Layer | Tools | Cost Range |
|---|---|---|
| Data Warehouse | Snowflake, BigQuery, Redshift | Free tiers - $5K+/mo |
| ELT/Ingestion | Fivetran, Airbyte | Free - $2K+/mo |
| Transformation | dbt | Free (Core) - $100+/mo |
| Orchestration | Airflow, Dagster | Free - $500+/mo |
| Data Quality/Observability | Monte Carlo, Soda | $500 - $5K+/mo |
| BI/Analytics | Looker, Power BI, Tableau | $10/user - $70+/user/mo |
| B2B Prospecting | Prospeo | Free (75 emails/mo) - ~$0.01/email |
| Product Analytics | Amplitude, Mixpanel | Free tiers - $1K+/mo |
Start at the warehouse layer, add transformation, then BI. Layer in observability and prospecting data as your team matures. Don't try to deploy all eight layers simultaneously - that's how you end up with a graveyard of half-configured tools and a frustrated ops team.
Real-World Revenue Strategies
The agency money pit. A manufacturing SME was paying £6,000/month to an agency for 18 months with zero pipeline growth. After auditing their data and redirecting spend, they stopped £72,000/year in wasted agency fees and tripled inbound enquiries within 90 days. The fix wasn't a new tool - it was measuring what the existing tools were actually producing.
The $200/month stack. A B2B professional services firm implemented GA4, connected it to HubSpot, defined five core KPIs, and built a Looker Studio dashboard. Within four months, lead-to-opportunity conversion jumped 28% and cost per lead dropped 25%. Total software cost was under $200/month. The real investment was the 40 hours their ops lead spent defining what to measure.
The fractional CMO play. A SaaS company brought in a fractional CMO who layered AI workflows onto clean data foundations. Over six months: CAC dropped 22%, qualified lead volume increased 35%, and marketing-to-sales handover speed improved 40%. Same lesson in every case - the data foundation came first, the results followed. Each of these examples shows how an evidence-based approach to growing revenue starts with measurement discipline, not technology purchases.
2026 Trends Worth Watching
The biggest shift this year is the move from AI that answers questions to AI that executes multi-step business processes autonomously. Conversational BI interfaces are accelerating data democratization - less reliance on dedicated BI teams, more self-serve analysis across the organization.
But the BARC 2026 survey reinforces a critical point: governance, quality, and security remain the top priorities, even as AI capabilities accelerate. Regulatory and ethical pressure around AI is making governance non-optional. Budget trajectories - from 8% to 14% of revenue and climbing - mean more money flowing into data and AI. The companies already investing in foundations are the ones who'll actually deploy autonomous analytics profitably. Everyone else is still fixing their data.
FAQ
What does data-driven growth mean?
It means using quantitative and qualitative data - analytics, customer feedback, operational signals - to systematically guide decisions that drive revenue, retention, and efficiency. It's a cultural operating system, not a dashboard purchase.
How long does it take to become data-driven?
Most organizations need 12-18 months to reach a functional maturity level (stage 3). Reaching an optimized state takes another 18-24 months. Aim for "functional and improving" rather than perfection.
Why do most data initiatives fail?
Poor data quality (64% cite it as their top challenge), cultural resistance (6 in 10 Fortune 1000 firms haven't built a data culture), and treating transformation as a technology project rather than organizational change.
What tools do I need for a growth stack?
At minimum: a data warehouse like Snowflake or BigQuery, a transformation layer like dbt, and a BI tool like Power BI or Looker. For B2B prospecting, Prospeo's free tier provides 75 verified emails/month - enough to validate outbound before scaling spend. SMBs can start the full stack for under $500/month.
How does data quality affect B2B sales?
Bad contact data causes email bounces, damages domain reputation, wastes rep time, and skews pipeline metrics. Teams running outbound on stale lists aren't just inefficient - they're actively harming their sender reputation, which makes every future campaign harder to land.