Deal Velocity: What It Measures, How to Calculate It, and Why Yours Is Probably Wrong
Your pipeline report says $2.4M in coverage. Your CRO wants to know why Q3 closed at 60% of forecast. The pipeline wasn't the problem - deal velocity was. Average B2B sales cycles have increased 25% over five years, 43% of sales leaders say their cycles are still getting longer, and 84% of reps are missing quota. If you're not measuring how fast deals actually move - and measuring it correctly - you're forecasting blind.
The Quick Version
Deal velocity measures how many days deals spend in your pipeline. Time. Not revenue. Not throughput.
The formula: Total days in pipeline (won + lost) / Total deals closed (won + lost)
The single most impactful lever: Qualification. Tightening your qualification criteria cascades into shorter cycles and higher win rates. Everything else is optimization on top of that foundation.
Want benchmarks by industry, ACV, and company size? Jump to benchmarks. Want the tactical playbook? Skip to the eight levers.
What Is Deal Velocity?
Deal velocity is the speed at which individual deals move through your pipeline, measured in days. Not dollars per day, not revenue throughput - just time from opportunity creation to close, whether won or lost.
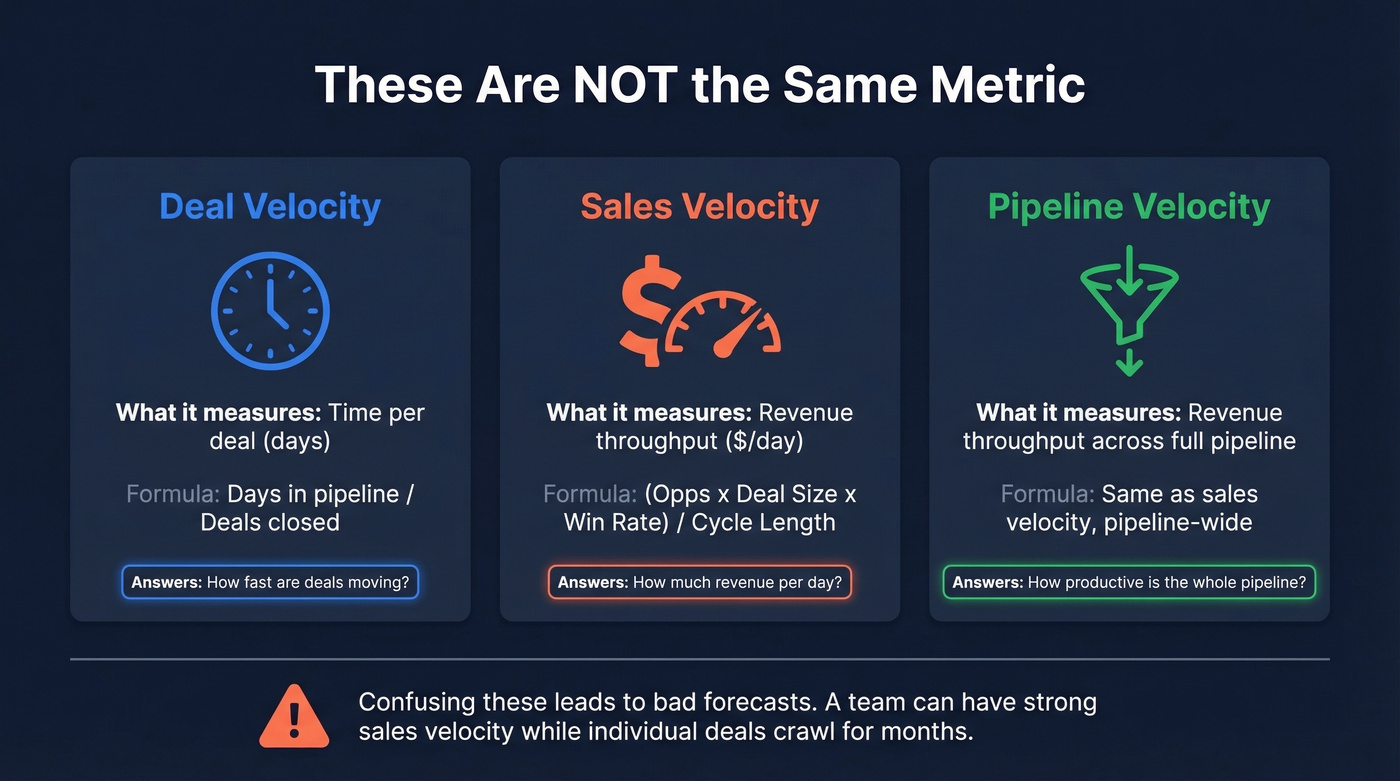
Here's the thing: most guides conflate three distinct metrics. Outreach explicitly says that "pipeline velocity, deal velocity, and sales funnel velocity all describe the same core concept." They don't.
| Metric | What It Measures | Formula |
|---|---|---|
| Deal velocity | Time per deal (days) | Days in pipeline / Deals closed |
| Sales velocity | Revenue throughput ($/day) | (Opps x Deal Size x Win Rate) / Cycle Length |
| Pipeline velocity | Revenue throughput ($/day) across a pipeline | (Opps x Deal Size x Win Rate) / Cycle Length |
The time-based metric tells you how fast. Sales velocity tells you how much revenue per day. Confusing them leads to bad forecasts. A team can have strong sales velocity - big deals, decent win rate - while individual deals crawl through the pipeline for months, each one a ticking time bomb for quarterly numbers.
How to Calculate Deal Velocity
The Time-Only Formula
Forecastio's framework gets this right. The calculation is purely about time:
Deal Velocity = Total time deals spent in pipeline (won + lost) / Total number of deals closed (won + lost)
Say you closed 80 deals last quarter - 30 won, 50 lost - and those 80 deals spent a combined 6,400 days in your pipeline. Your velocity is 80 days.
The critical detail: include lost deals. If you only measure won deals, you're cherry-picking the ones that moved well and ignoring the ones that stalled for 120 days before dying. That inflates your velocity number and hides pipeline problems. We've seen teams shave 15-20 days off their "velocity" just by excluding losses, which is basically lying to yourself with math.
Stage-Level Variant
For bottleneck detection, measure velocity by stage:
Stage Velocity = Total time spent in stage / Deals that passed through that stage
This is where the real diagnostic power lives. Your overall cycle might be 85 days, but if 35 of those sit in "Negotiation," you've found your problem.
The Revenue-Throughput Formula
You'll see this formula everywhere. It's useful, but it measures something different:
Sales Velocity = (Opportunities x Avg Deal Size x Win Rate) / Sales Cycle Length
Worked example from Count.co: 150 opportunities x $25,000 x 20% win rate / 90 days = $8,333/day in revenue throughput. Valuable for capacity planning, but it won't tell you whether individual deals are stalling at the proposal stage.
Don't confuse these. The revenue-throughput formula is sales velocity. The time-only formula measures deal velocity. Use both, but know which question each one answers.
Bad data is the hidden deal velocity killer nobody benchmarks. When 35% of your emails bounce, deals stall before they start. Prospeo delivers 98% email accuracy and 125M+ verified mobile numbers - so reps reach real decision-makers on the first attempt, not the fifth.
Cut days from your cycle by eliminating dead contacts entirely.
Deal Velocity Benchmarks
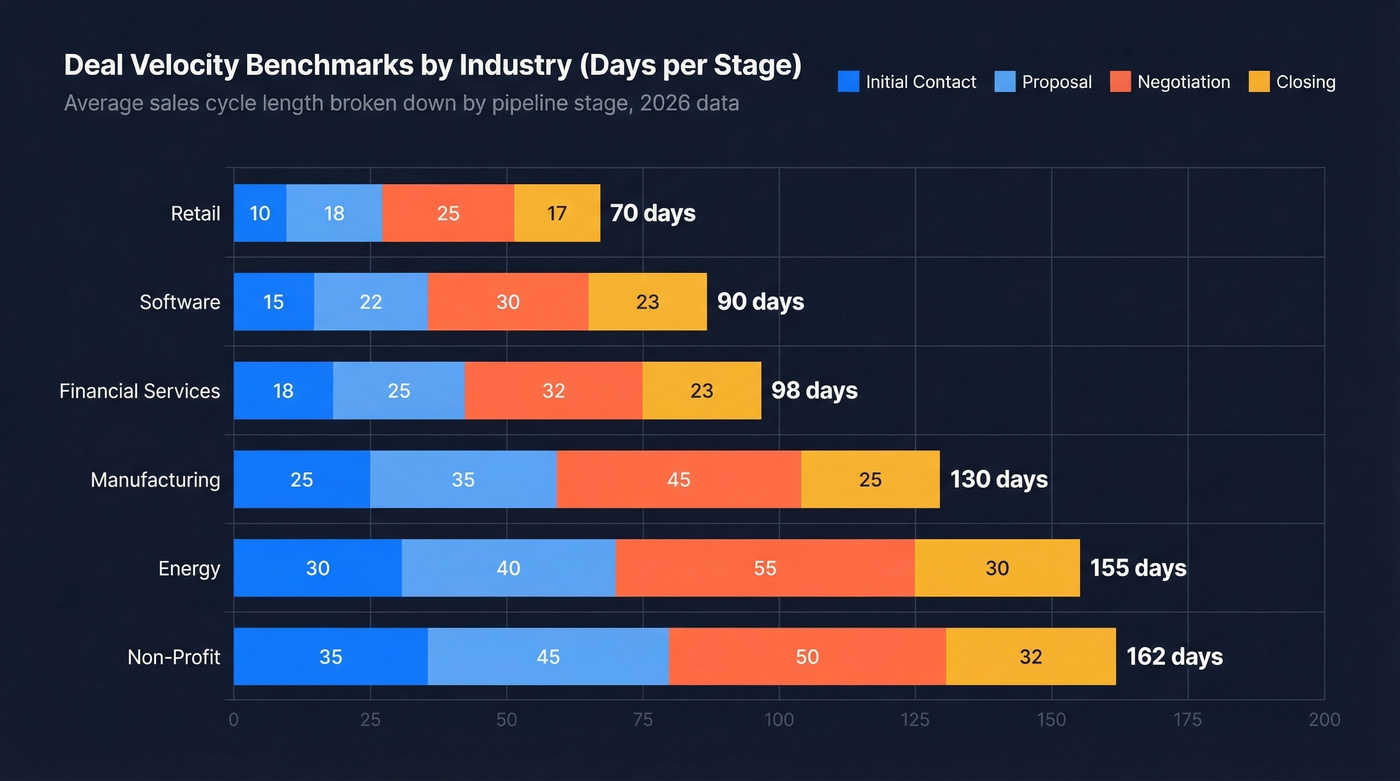
Benchmarks are only useful if you compare against your segment. A 90-day cycle is fast for enterprise software and glacial for SMB retail. Here's what the data shows, drawn from Focus Digital's 2026 study and Digital Bloom's benchmark aggregation.
By Industry (Stage-by-Stage)
| Industry | Initial Contact | Proposal | Negotiation | Closing | Total |
|---|---|---|---|---|---|
| Software | 14 days | 30 days | 25 days | 21 days | 90 days |
| Financial Services | 16 days | 28 days | 30 days | 24 days | 98 days |
| Retail | 10 days | 20 days | 22 days | 18 days | 70 days |
| Manufacturing | 18 days | 45 days | 35 days | 32 days | 130 days |
| Energy | 30 days | 50 days | 40 days | 35 days | 155 days |
| Non-Profit | 35 days | 55 days | 38 days | 34 days | 162 days |
By Company Size
| Prospect Size | Avg Cycle (Days) |
|---|---|
| 1-10 employees | 38 |
| 11-50 | 57 |
| 51-200 | 77 |
| 201-500 | 95 |
| 501-1,000 | 115 |
| 1,001-5,000 | 135 |
| 5,001-10,000 | 158 |
| 10,001+ | 185 |
Enterprise cycles at the 10,001+ tier average 185 days - nearly five times the cycle of a 1-10 employee prospect. That gap is why enterprise and SMB motions need fundamentally different playbooks.
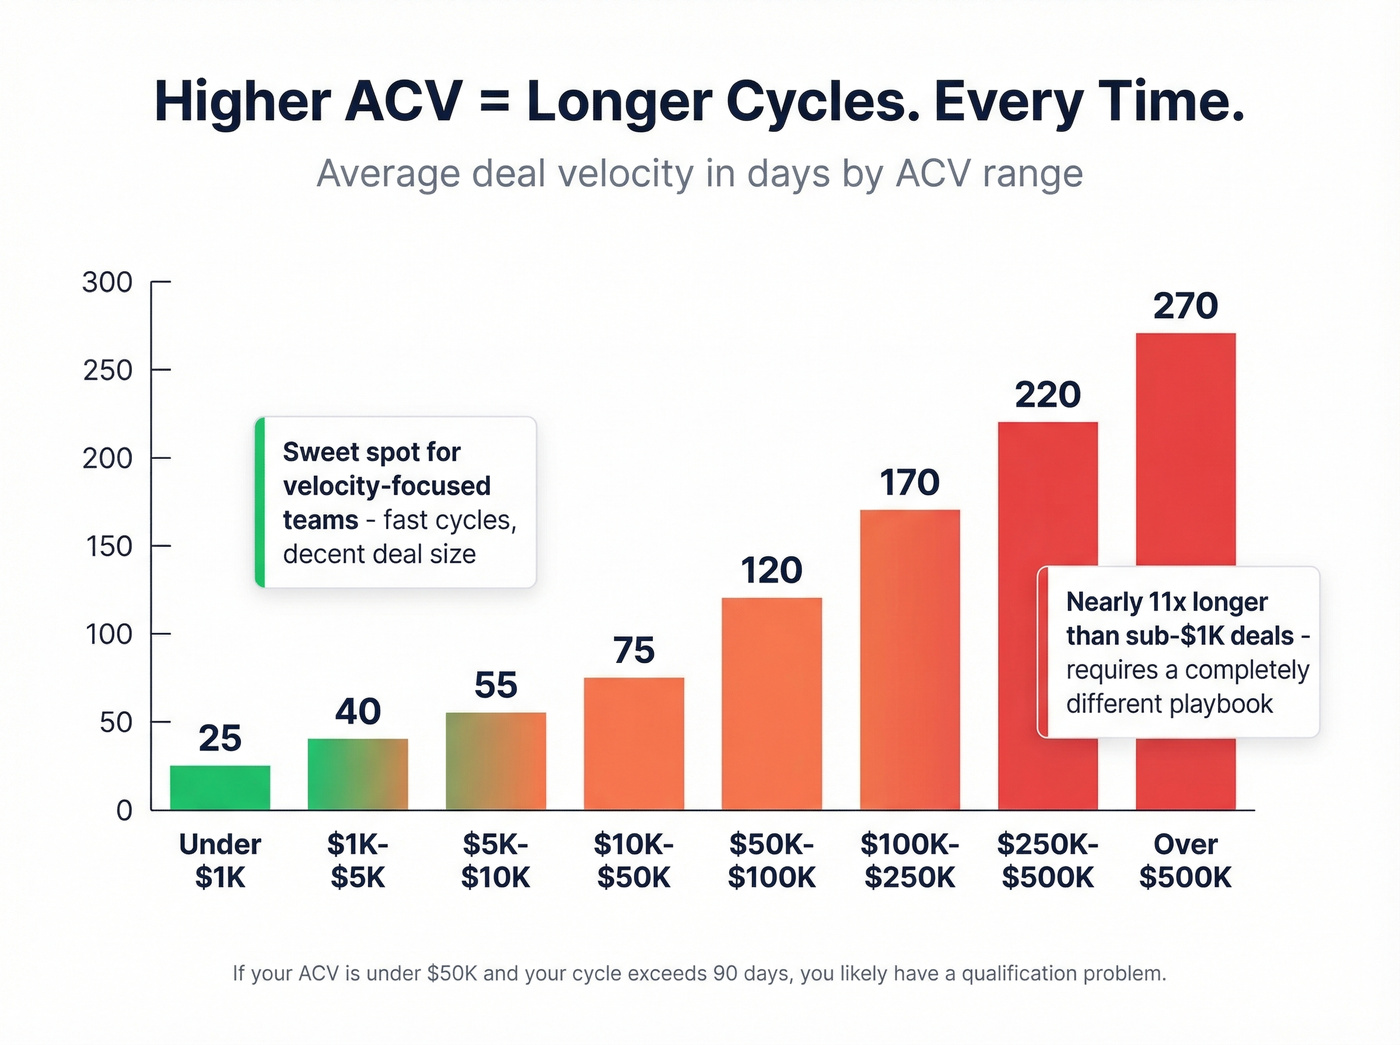
By ACV
| ACV Range | Avg Cycle (Days) |
|---|---|
| <$1K | 25 |
| $1K-$5K | 40 |
| $5K-$10K | 55 |
| $10K-$50K | 75 |
| $50K-$100K | 120 |
| $100K-$250K | 170 |
| $250K-$500K | 220 |
| >$500K | 270 |
By Lead Source
| Channel | Avg Cycle (Low Complexity) | MQL-to-SQL Rate | Opp-to-Close Rate |
|---|---|---|---|
| Referrals | 20 days | 47% | 42% |
| SEO / Inbound | 28 days | 51% | 38% |
| Cold calling | 60 days | 33% | 31% |
| Trade shows | 80 days | 28% | 29% |
| PPC / Paid | 45 days | 26% | 35% |
The channel data is worth studying closely. SEO leads convert MQL-to-SQL at 51% - nearly double PPC's 26% - and close at 38%. Referrals convert and close at the highest rates across the board. If your velocity is lagging, your channel mix is the first place to look, not your sales process.
For pipeline velocity in dollar terms, ranges run from $743/day to $2,456/day depending on industry. Real estate and construction top the list at $2,456/day, financial services at $2,134/day, and SaaS at $1,847/day.
Stage conversion rates vary dramatically by segment too. SMB/mid-market teams convert MQL-to-SQL at 39% and opportunity-to-close at 39%. Enterprise teams hit 31% and 31%. That conversion gap compounds across every stage and is one of the biggest reasons enterprise cycles feel so much slower - because they genuinely are.
Why Your Deals Are Slowing Down
Three structural shifts are stretching cycles, and one hidden factor makes all of them worse.
Buying committees got bigger. The typical B2B purchase now involves 6-10 decision-makers. Five years ago, it was 3-5. More stakeholders means more scheduling, more internal alignment, and more opportunities for a deal to stall while someone's on PTO.
Engagement doesn't equal buying intent. An analysis of 18,000+ sales conversations by Chameleon Sales found that manager-level contacts create motion without momentum - lots of meetings, slow progress. Senior buyers at the Director/VP/C-suite level engage less frequently, but when they do, cycles are materially shorter. If your reps are multi-threading with the wrong levels, activity metrics look great while velocity tanks.
Economic uncertainty compounds everything. During budget freezes, hiring slowdowns, and shifting priorities, even well-qualified deals stall as prospects add approval layers and defer discretionary spend. The 2024-2026 environment has made this a persistent drag on cycle times across nearly every B2B segment.
Stale data wastes cycles. Reps chasing bounced emails and contacts who changed roles six months ago aren't selling - they're doing data cleanup on company time. This shows up as healthy-looking pipeline with mysteriously slow throughput. We've watched teams lose entire weeks per deal to this problem before they even realize what's happening.
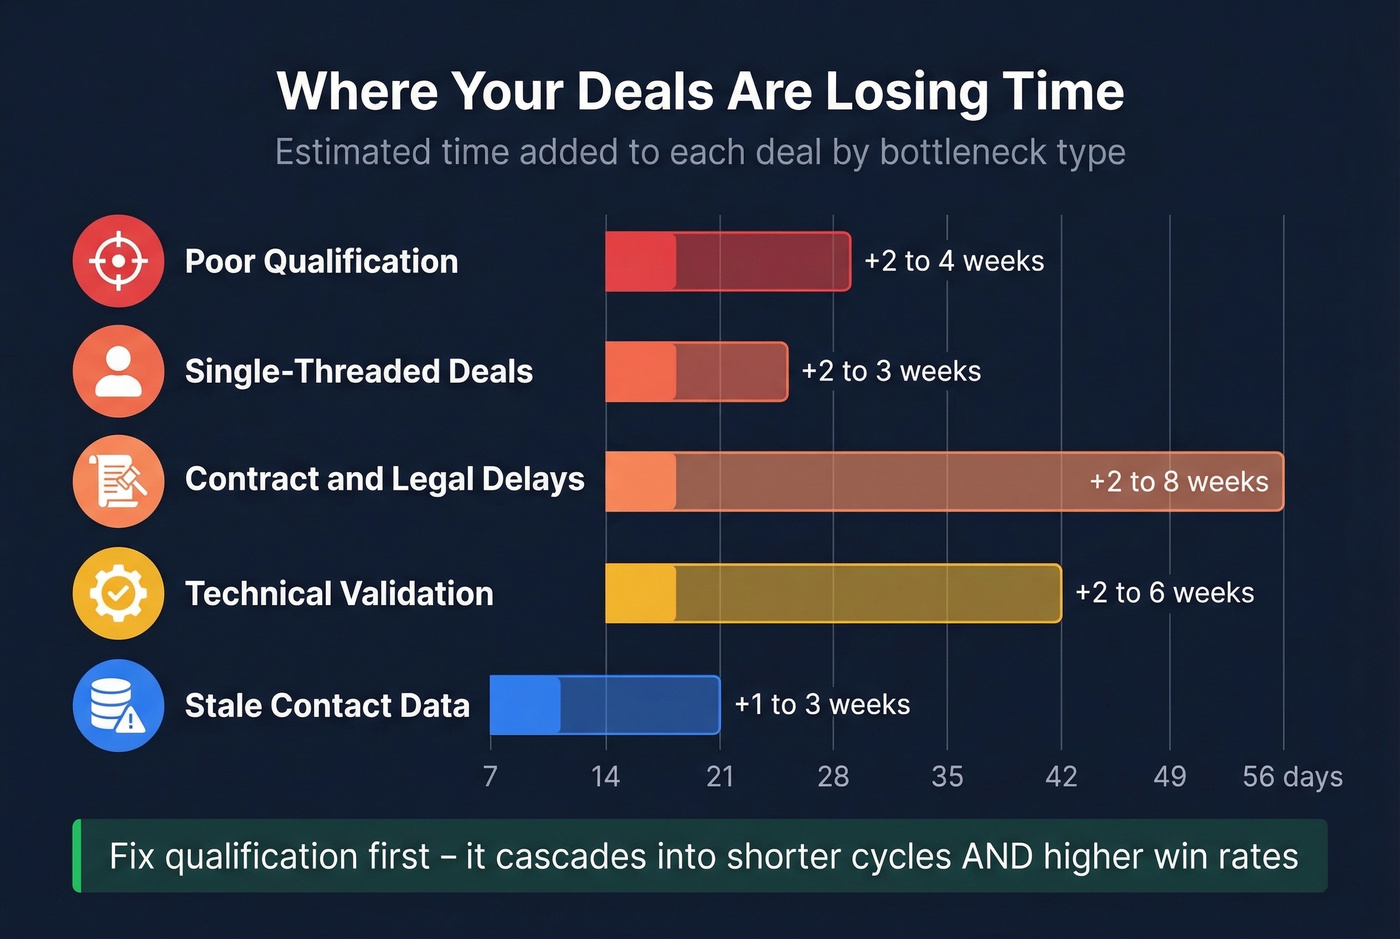
Here's what each bottleneck actually costs:
| Bottleneck | Time Added |
|---|---|
| Poor qualification | +2-4 weeks |
| Single-threaded deals | +2-3 weeks |
| Contract / legal delays | +2-8 weeks |
| Technical validation | +2-6 weeks |
| Stale contact data | +1-3 weeks |
If your ACV is under $50K and your average cycle exceeds 90 days, you almost certainly have a qualification problem, not a market problem. Most teams at this ACV range carry 30-40% dead weight in their pipeline - deals that should've been disqualified weeks ago. Fix that before you buy another tool.
How to Accelerate Deal Velocity
You don't need to fix all eight levers. Fixing one or two of the right ones can cut your cycle dramatically. Optif.ai documented a reduction from 147 days to 68 days - a 54% cut - across 150+ SMB implementations by focusing on qualification and process standardization alone.
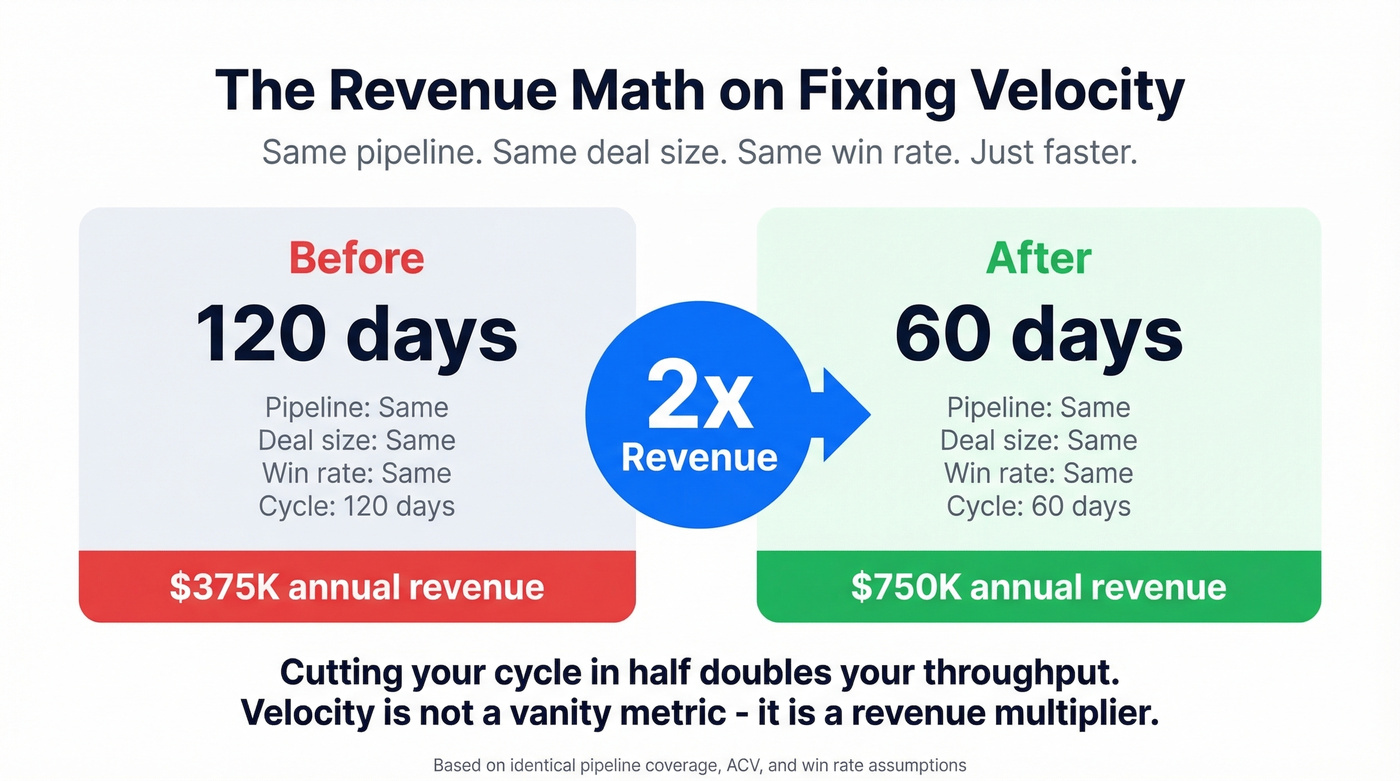
The math on fixing velocity: Cutting your cycle from 120 days to 60 days - with the same pipeline, deal size, and win rate - doubles your revenue throughput. That's the difference between $375K and $750K annually on the same pipeline. Velocity isn't a vanity metric. It's a revenue multiplier.
Qualify Harder Upfront
This is the cheapest fix, and it cascades into everything else. Tighter qualification - MEDDIC for enterprise, BANT for velocity-focused SMB teams - means fewer dead deals clogging your pipeline. Every deal you disqualify at week one instead of week eight improves your cycle time and frees rep capacity for deals that'll actually close. Done well, this single lever improves speed and win rates simultaneously.
Skip this if your win rate is already above 35%. Your qualification is probably fine, and the bottleneck is downstream.
Multi-Thread Every Deal Above $10K
With 6-10 stakeholders involved in most B2B purchases, single-threading a deal through one champion is a recipe for stalls. When that champion goes on vacation, gets reassigned, or loses internal momentum, your deal goes dark. Multi-threading adds 2-3 contacts per account and reduces the risk that one person can kill the entire deal. The consensus on r/sales is that single-threaded deals above mid-market ACV are basically coin flips - and the data backs that up.
Compress Follow-Up to Under Two Hours
Send a recap with clear next steps within two hours of every meeting. Not the next morning. Not "when I get back to my desk." Tools like Gong and Fathom auto-generate meeting notes and action items - pipe those into your CRM workflow so the follow-up practically writes itself. If you need copy you can reuse, keep a set of sales follow-up templates ready for each stage. The Martech.org playbook calls this one of the highest-ROI friction reducers, and in our experience, it consistently shaves days off mid-funnel stages.
Automate Scheduling and Lead Routing
Back-and-forth scheduling emails are a velocity tax you can eliminate today. Calendly or HubSpot's meeting scheduler kills the "does Tuesday work?" dance. On the routing side, CRM-based lead assignment rules should get new leads to the right rep in seconds, not hours. This one's boring. It also works immediately.
Standardize Contracts
Contract and legal delays add 2-8 weeks to deals - an enormous range, and most of it is preventable. Pre-approved templates, standardized terms for deals under a certain threshold, and a dedicated legal review SLA for larger deals compress this stage dramatically. If your negotiation stage is dragging, use a clear anchor and walk-away criteria to avoid endless redlines. AI-powered contract review tools like LexCheck are also cutting first-pass review time from days to hours. If your legal team reviews every $15K deal from scratch, that's a process problem, not a legal problem.
Enable Buyers with Self-Serve Content
Your buyers have questions they're not asking your reps. FAQ pages, demo videos, ROI calculators, and case studies answer those "silent questions" proactively. A well-built business case template that your champion can customize and circulate internally does more for cycle acceleration than another discovery call ever will, because it sells when your rep isn't in the room.
Clean Your Contact Data
Reps burning 1-3 weeks per deal chasing contacts who left the company, emailing addresses that bounce, and dialing disconnected numbers - that's a cycle-time problem disguised as a pipeline problem. If you’re diagnosing the root cause, start with email bounce rate and list hygiene before you touch your sales process.
Prospeo addresses this with a 7-day data refresh cycle versus the six-week industry average, 98% email accuracy across 143M+ verified addresses, and Bombora-powered intent data across 15,000 topics so reps prioritize accounts actively researching solutions. Snyk's 50-person AE team went from a 35-40% bounce rate to under 5% after switching, generating 200+ new opportunities per month. When your reps spend their time talking to real people at current companies, deals move faster.
Measure by Stage, Not End-to-End
Overall velocity is a lagging indicator. Stage-level measurement is where you find actionable problems. If your "Proposal" stage averages 30 days but "Negotiation" averages 40, you know exactly where to focus. Build stage-level velocity reports in Salesforce or HubSpot and review them weekly. Let's be honest - most teams set up a dashboard once and never touch the methodology again. That's how you end up with a number that looks good but means nothing.
Buying committees grew from 3-5 to 6-10 stakeholders. That means you need verified contact data for every decision-maker, not just one champion. Prospeo's 300M+ profiles with 30+ filters - including department headcount and job changes - let you map the full committee in minutes.
Stop losing weeks chasing the wrong stakeholder with stale data.
How to Measure It Correctly
Use medians, not averages. One 300-day enterprise deal destroys your mean. Report percentiles - P25, P50, P75 - if your CRM supports it. Teams that segment velocity by ACV band find actionable insights within the first quarter of tracking.
Segment everything. Velocity for your SMB segment and your enterprise segment are different metrics entirely. Same goes for inbound vs. outbound, different ACV bands, and individual reps. A blended number hides the signal.
Use cohort-based measurement. The Pedowitz Group's framework recommends comparing exposed opportunities against matched holdout groups when measuring the impact of any change. Without a control group, you can't distinguish "we improved velocity" from "we had an easier quarter."
Exclude non-selling pauses. Procurement freezes, legal holds, and holiday shutdowns aren't selling time. Define clear rules for what counts as "time in stage" and enforce them consistently.
Enforce data hygiene. Consistent stage entry/exit criteria, qualifying-touch rules, and buying-group association in your CRM are prerequisites. If reps define "Proposal Sent" differently, your stage velocity data is garbage. Full stop. If you want a broader dashboard context, tie velocity back to pipeline health so you don’t “optimize” the wrong thing.
FAQ
What's a good deal velocity?
For SaaS, the median sales cycle is 84 days. Deals under $1K ACV average 25 days; deals above $500K average 270 days. Improving 10-15% quarter-over-quarter matters more than hitting an arbitrary number - benchmark against your own segment and ACV band first.
How is deal velocity different from sales velocity?
Deal velocity measures time - days in pipeline for won and lost deals. Sales velocity measures revenue throughput: (Opportunities x Deal Size x Win Rate) / Cycle Length. A team can have strong sales velocity from large deals while individual opportunities crawl for months, masking serious pipeline risk.
How do you track this in Salesforce or HubSpot?
Build a report on closed deals, both won and lost. Calculate median days from opportunity creation to close date, segmented by stage, ACV band, and rep. You'll typically need custom calculated fields or a BI layer like Count or Forecastio to get stage-level medians and percentiles rather than just averages.
What causes slow deal velocity?
The top culprits are poor qualification (+2-4 weeks), single-threaded deals (+2-3 weeks), contract and legal delays (+2-8 weeks), and stale contact data that wastes rep cycles chasing people who've moved on. Buying committees expanding to 6-10 stakeholders compounds all of these.
Can better contact data actually speed up deals?
Yes. Reps chasing bounced emails and disconnected numbers add 1-3 weeks per deal in wasted cycles. Snyk cut bounce rates from 35-40% to under 5% after switching to Prospeo and generated 200+ new opportunities per month - proof that clean data isn't just a hygiene issue, it's a velocity lever.