How to Drive Revenue: Formulas, Benchmarks, and the Operating System Behind It
It's Q2 planning. Your CEO just set a 30% growth target. Your CFO simultaneously asked every department to cut 15%. You're staring at a spreadsheet wondering which number is real - and whether anyone in the room has actually done the math on how driving revenue works when both mandates land at once.
If you're tasked with accelerating growth this quarter, focus on three things. Fix your pipeline velocity math - most teams have never calculated it. Benchmark your NRR, because if it's below 100%, you have a retention problem masquerading as a growth problem. And audit your contact data, because if a huge chunk of your outbound bounces, every downstream metric is broken.
That tension between "grow faster" and "spend less" isn't going away. Let's build the operating manual for navigating it.
What Driving Revenue Actually Means Now
Revenue used to mean top-line growth at all costs. That era's over. The metric that matters is the Rule of 40: your growth rate plus your profit margin should hit at least 40%. A company growing 30% with 10% margins passes. A company growing 50% while burning 20% doesn't. Revenue without profitability is just expensive motion.
We've seen the practitioner shift firsthand, and the frustration on r/marketing confirms it - CMOs asked to simultaneously grow the top line and cut costs, with no framework for reconciling the two. Traffic is a vanity metric. The levers that actually move revenue fall into five categories: operations-led drivers like process efficiency and cycle time, marketing-led drivers like conversion and retention, pricing levers such as packaging and expansion revenue, lead generation covering pipeline volume and quality, and sales-led drivers including win rates, deal size, and rep productivity.
The teams winning right now aren't optimizing for more. They're optimizing for velocity, conversion, and retention. More leads with a 2% conversion rate is just more waste.
The Revenue Acceleration Formula
Every revenue leader should have this formula tattooed somewhere visible:
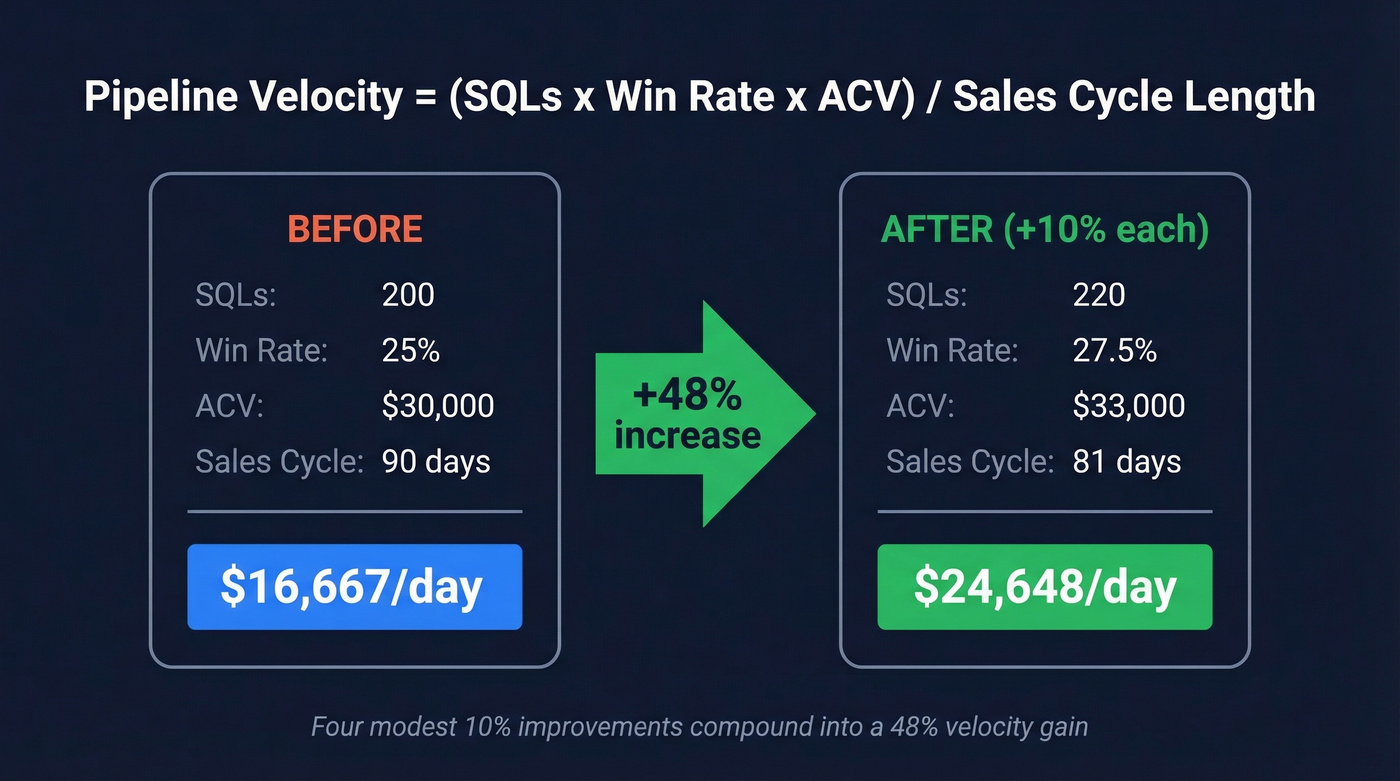
Pipeline Velocity = (SQLs x Win Rate x ACV) / Sales Cycle Length
Four variables. Each one is a lever.
Say you've got 200 SQLs per quarter, a 25% win rate, $30K ACV, and a 90-day sales cycle. Your pipeline velocity is (200 x 0.25 x $30,000) / 90 = $16,667 per day. Now improve each variable by just 10%: 220 SQLs, 27.5% win rate, $33K ACV, 81-day cycle. New velocity: (220 x 0.275 x $33,000) / 81 = $24,648 per day. That's a 48% increase from four modest improvements.
Here's the thing: the instinct most teams have - "we need more leads" - is almost always wrong. Improving conversion rate or shortening cycle time typically delivers faster, cheaper gains than pouring more volume into a leaky funnel. Nurtured leads make 47% larger purchases than non-nurtured ones, and multi-channel nurture sequences convert 3-5x better than email-only. A revenue acceleration playbook from Directive recommends targeting +10-20% velocity gains within 90 days, with pipeline coverage maintained at 3-5x quota by segment.
You don't need a bigger pipeline. You need a faster, more efficient one.
2026 Benchmarks - What Good Looks Like
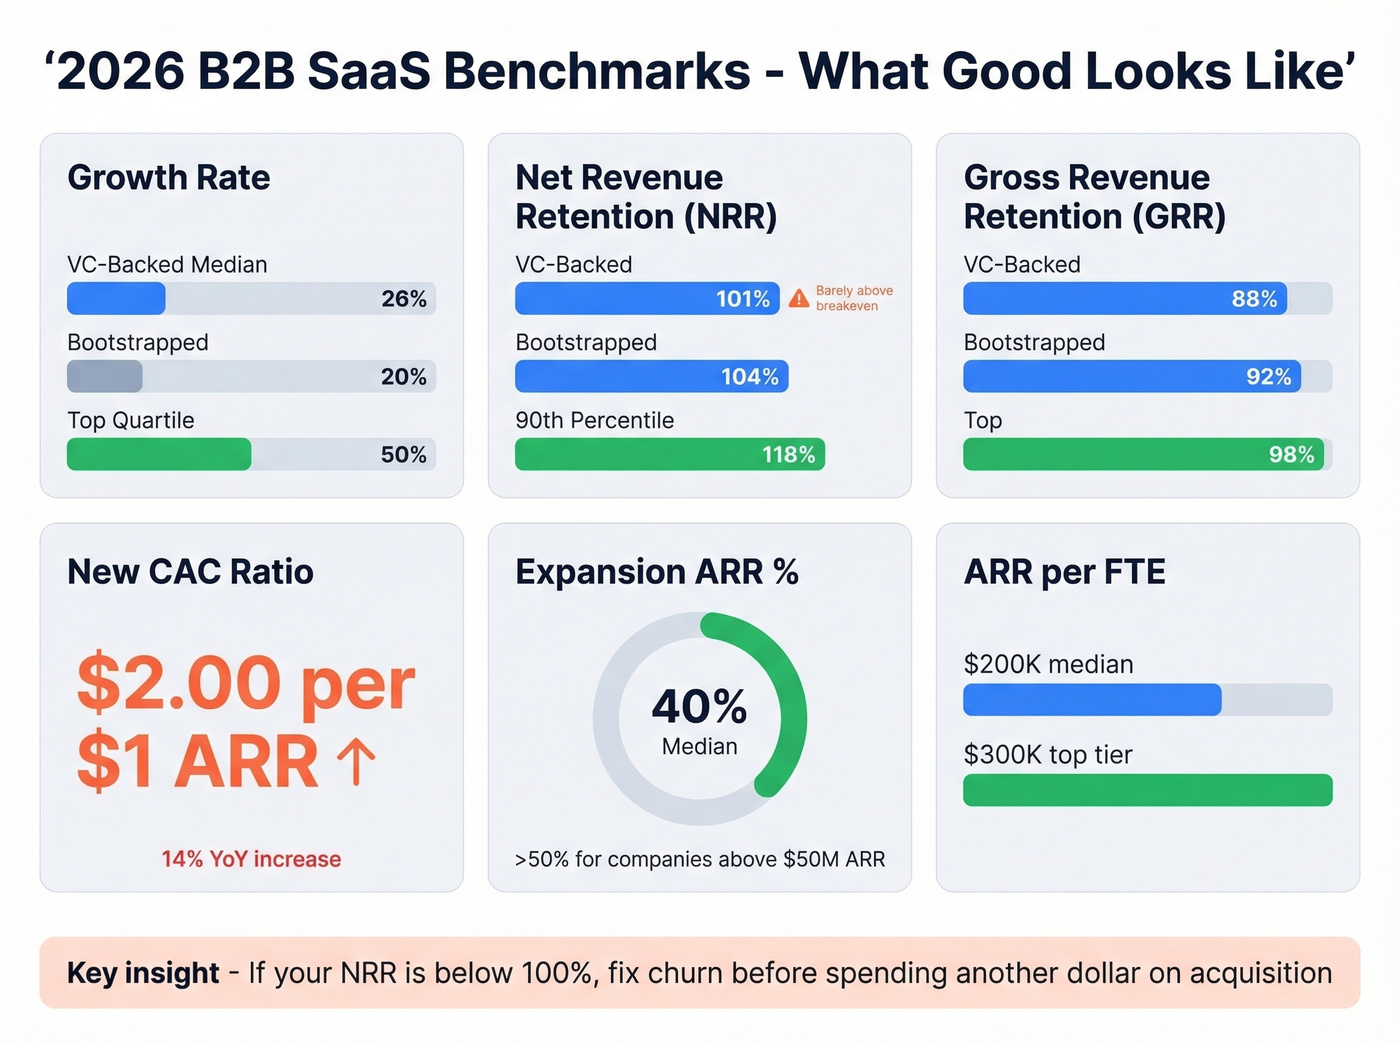
Numbers without context are useless. Here's where B2B SaaS companies actually land, drawn from the latest BenchmarkIt data and SaaS Capital's bootstrapped survey of more than 1,000 private SaaS companies.
| Metric | VC-Backed Median | Bootstrapped ($3M-$20M) | Top Quartile / 90th |
|---|---|---|---|
| Growth Rate | 26% | 20% | 50% / 51% |
| NRR | 101% | 104% | - / 118% |
| GRR | 88% | 92% | - / 98% |
| New CAC Ratio | $2.00 per $1 ARR | - | $2.82 (Q4) |
| Expansion ARR % | 40% | - | >50% (>$50M) |
| ARR per FTE | $200K | - | $300K (>$100M) |
A few things jump out. Median NRR at 101% is barely above breakeven on existing customers. If yours is below 100%, you don't have a growth problem - you have a retention problem. Fix churn before you spend another dollar on acquisition.
The New CAC Ratio climbing 14% year-over-year to $2.00 tells you that acquiring new logos is getting more expensive across the board. Meanwhile, expansion ARR now accounts for 40% of total new ARR. The math is clear: growing existing accounts is cheaper and faster than hunting new ones, and companies above $50M ARR get more than half their new ARR from expansion.
Hot take: If your deal sizes are sub-$10K and your NRR is below 100%, you shouldn't be spending on outbound at all. Fix the product and the onboarding first.
You just saw how a 10% improvement across four pipeline velocity variables compounds into 48% more daily revenue. The fastest lever to pull? Data quality. Prospeo's 98% email accuracy and 7-day refresh cycle mean fewer bounces, higher connect rates, and shorter sales cycles - fixing the input that feeds every formula above.
Stop optimizing a pipeline built on bad data. Fix the foundation first.
AI as a Revenue Lever
An NVIDIA survey of 3,200+ respondents found that 88% report AI increased their annual revenue, with 30% seeing gains above 10%. PepsiCo's digital twins delivered a 20% throughput increase. Those are real numbers.
But let's not get carried away. A BCG survey of 280+ finance executives puts the median AI ROI at just 10%, and roughly a third of respondents report limited or no gains at all. Only one in five hit 20%+ ROI.
AI is a revenue lever, not a revenue strategy. The teams seeing real returns use AI to compress specific, measurable workflows - lead scoring, forecasting, content personalization, rep coaching. The teams seeing nothing bought an "AI platform," plugged it in, and waited for magic. AI amplifies good process. It doesn't replace missing process.
Revenue Killers - Mistakes That Stall Growth
We've seen the same patterns kill momentum at companies between $1M and $20M ARR. Six come up over and over.
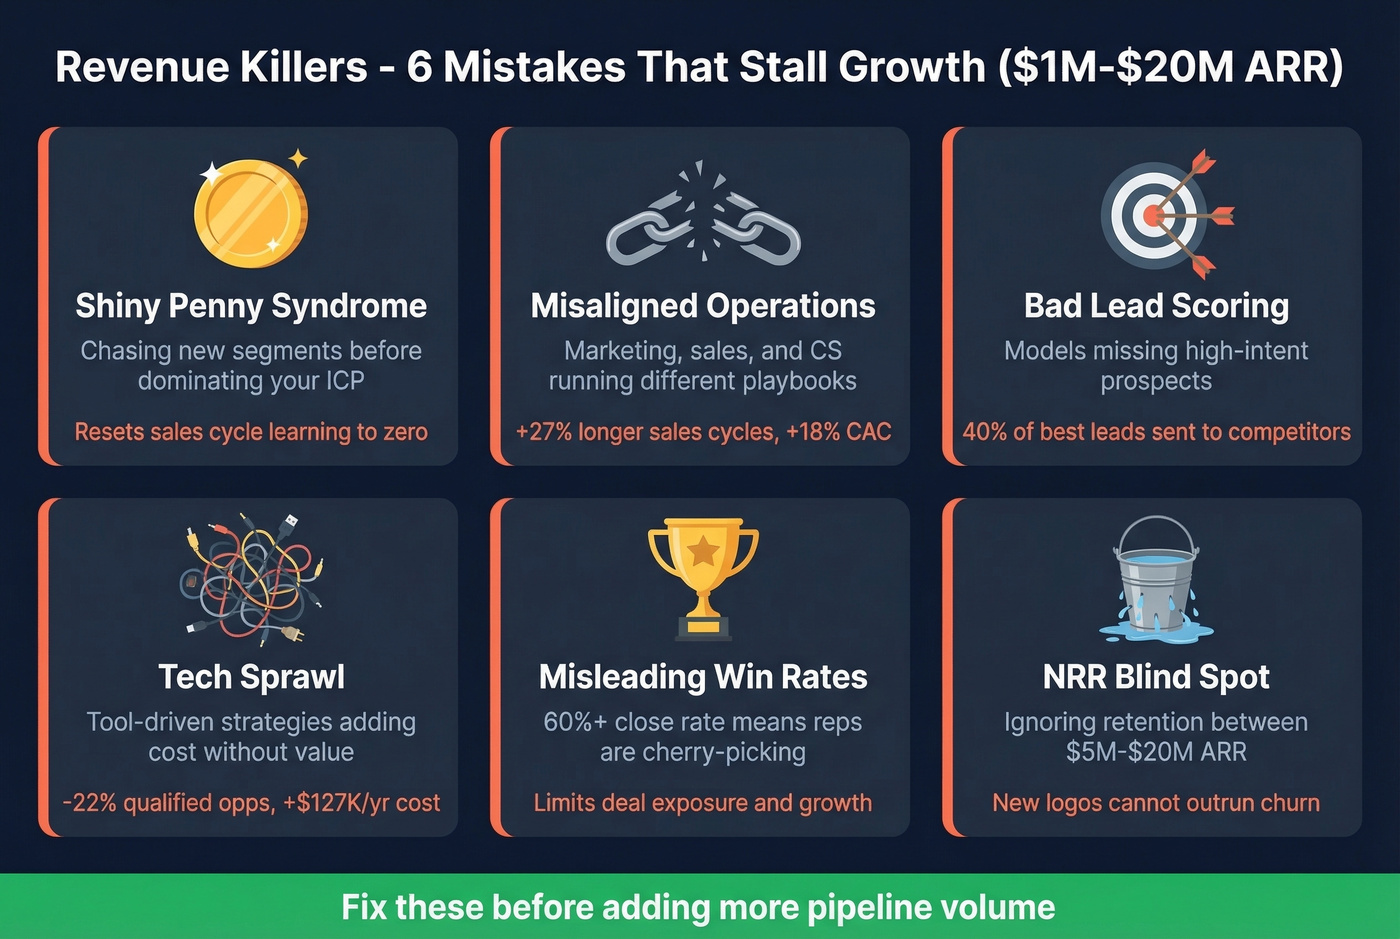
Chasing new segments before dominating your current one. The "shiny penny" problem. You haven't saturated your ICP, but someone in the room wants to try healthcare or EMEA. Every new segment resets your sales cycle learning to zero.
Misaligned operations. When marketing, sales, and CS aren't running the same playbook, sales cycles stretch 27% longer and CAC jumps 18%. That's not a theory - it's the cost of teams working in parallel instead of in sequence. A coherent approach where leadership aligns quotas, territories, and comp plans to the same pipeline velocity targets eliminates most of this drag.
Bad lead scoring. Models that miss 40% of high-intent prospects aren't just inefficient - they're actively sending your best leads to competitors while reps chase tire-kickers. (If you need a reset, start with a clean lead scoring framework.)
Tech sprawl. Tool-driven strategies generate 22% fewer qualified opportunities while increasing total cost of ownership by $127K/year. Every tool you add that doesn't directly improve a pipeline velocity variable is drag.
Two subtler patterns deserve attention. High win rates sound great in board meetings, but if your team closes 60%+ of deals, reps are probably cherry-picking rather than expanding deal exposure - win rate should decline slightly as you push into new segments and deal sizes. And then there's the NRR blind spot: you'll stall out between $5M and $20M ARR without strong customer advocacy and retention. The consensus on r/b2bmarketing has been hammering this point for months. New logo acquisition can't outrun a leaky bucket forever.
The Data Quality Multiplier
Most revenue problems are data problems in disguise.
Your team sends 10,000 outbound emails. 3,400 bounce. Your domain reputation tanks. Deliverability drops across every sequence - not just the bad list. Reps lose trust in the data, start manually researching contacts, and suddenly your $150K/year sales tool is being used as a glorified search bar. We've watched this exact pattern play out at companies that came to us after burning through two or three other data providers.
Snyk had 50 AEs prospecting 4-6 hours per week with bounce rates between 35-40%. After switching to verified data, bounces dropped under 5%, AE-sourced pipeline jumped 180%, and they were generating 200+ new opportunities per month. Meritt saw pipeline triple from $100K to $300K per week.

Bad data doesn't just waste emails - it degrades every variable in the pipeline velocity formula. Fewer valid contacts means fewer SQLs. Bounced emails mean lower engagement, which tanks win rates. Reps spending hours on manual research means longer sales cycles. It's a multiplier effect in the wrong direction.
Prospeo's 98% email accuracy and 7-day data refresh cycle exist specifically to solve this. With 300M+ professional profiles and verified contacts syncing into Salesforce, HubSpot, and sequencing tools like Lemlist, Instantly, and Outreach via native integrations, there's no manual step between finding a contact and reaching them. Free tier available, paid credits starting around $0.01 per email - built for teams that can't afford to let bad data sabotage their pipeline math.
Building a Revenue Operating System
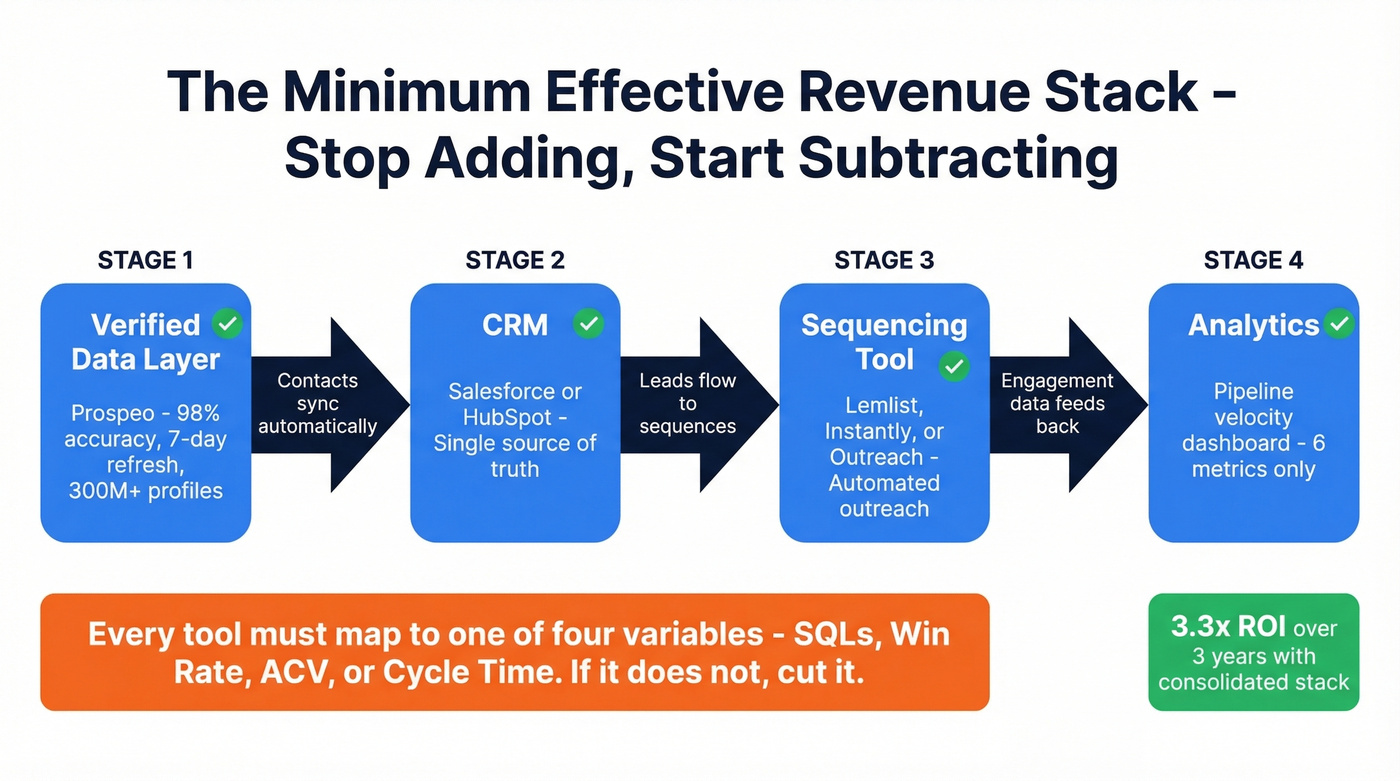
Stop adding tools. Start subtracting.
The best revenue operating systems follow a "minimum effective dosage" principle. Start with six critical metrics for your stage - not sixty. Build executive dashboards that show those six numbers and nothing else. Run weekly written updates covering key metrics, work accomplished, and blockers. Hold monthly business reviews where you actually make decisions, not just present slides.
This cadence is what separates teams systematically driving revenue from those throwing tactics at a wall.
Your tech stack should be ruthlessly simple: a verified data layer feeding your CRM, your CRM feeding your sequencing tool, your sequencing tool feeding your analytics. That's it. Salesloft's Forrester TEI study showed 3.3x ROI over three years, with 12% higher close rates and 50% higher conversion from engagement to opportunity - proof that the right tools, consolidated, outperform sprawl every time.
Skip this section if you're already running a tight three-tool stack. But for everyone else, here's the contrarian take nobody wants to hear: tech sprawl costs $127K/year on average while generating fewer qualified opportunities. Every tool in your stack should map directly to one of the four pipeline velocity variables. If it doesn't improve SQLs, win rate, ACV, or cycle time, cut it.
I'll be honest - you've probably sat in a board meeting where someone presented a "revenue growth strategy" that was really just a list of channels and a bigger budget. No formula. No benchmarks. No operating cadence. Just "do more." The operating system approach replaces hope with math, and math is what survives contact with a CFO who wants 15% cuts. Building predictability into your forecast is the single most valuable thing you can do for your board, your team, and your own sanity. (If forecasting is a pain point, start with a simple sales forecasting stack.)
If expansion ARR now drives 40% of new revenue, your enrichment data needs to be current - not six weeks stale. Prospeo refreshes 300M+ profiles every 7 days and returns 50+ data points per contact at a 92% match rate, so your CRM actually reflects who's buying today.
Real revenue acceleration costs $0.01 per verified email. Do the math.
FAQ
What are the main revenue drivers for B2B companies?
Revenue drivers fall into five categories: operations-led (process efficiency, cycle time), marketing-led (conversion, retention), pricing (packaging, expansion), lead generation (pipeline volume, quality), and sales-led (win rates, deal size, rep productivity). Pipeline velocity - (SQLs x Win Rate x ACV) / Cycle Length - ties them together into a single actionable formula.
What's a good revenue growth rate in 2026?
Median growth for VC-backed B2B SaaS is 26%, with top-quartile companies hitting 50%. Bootstrapped companies in the $3M-$20M ARR range land around 20% median, 90th percentile at 51%. The quality check is the Rule of 40: growth rate plus profit margin should equal at least 40%.
How does data quality affect revenue growth?
Bad contact data degrades every pipeline velocity variable - fewer valid SQLs, lower engagement rates, longer cycles as reps manually research contacts. Companies switching to verified data sources have seen pipeline increases of 140-180% and bounce rates drop from 35%+ to under 5%. Clean data accelerates every metric downstream.
How can teams drive revenue without increasing headcount?
The pipeline velocity formula reveals four levers that don't require more reps: improving win rates through better lead scoring, increasing ACV through smarter packaging, shortening sales cycles with verified contact data, and boosting SQL quality through tighter ICP targeting. The 48% velocity gain in our worked example came entirely from 10% improvements across existing resources.