Forecast Accuracy Formula: 7 Metrics Explained (2026)
You forecast 27 units. Three actually sell. Your forecast accuracy formula spits out -700%. This scenario shows up on r/supplychain all the time - demand planners staring at a number that's supposed to measure accuracy but has somehow gone negative. It's not a math error. It's a metric problem. And it's expensive: inventory misstocking costs retailers $1.77 trillion annually.
The right formula depends on your data, your portfolio mix, and which decisions the forecast supports. McKinsey found 77% of businesses invest in technology to improve forecasting - yet most still argue about which metric to track.
The Three-Metric Starter Kit
- WAPE as your headline accuracy KPI - weights by volume, avoiding unweighted MAPE distortions in mixed-volume portfolios
- Bias (ME) for directional diagnostics - are you consistently over- or under-forecasting?
- MASE for model comparison - is your method actually better than a naive forecast?
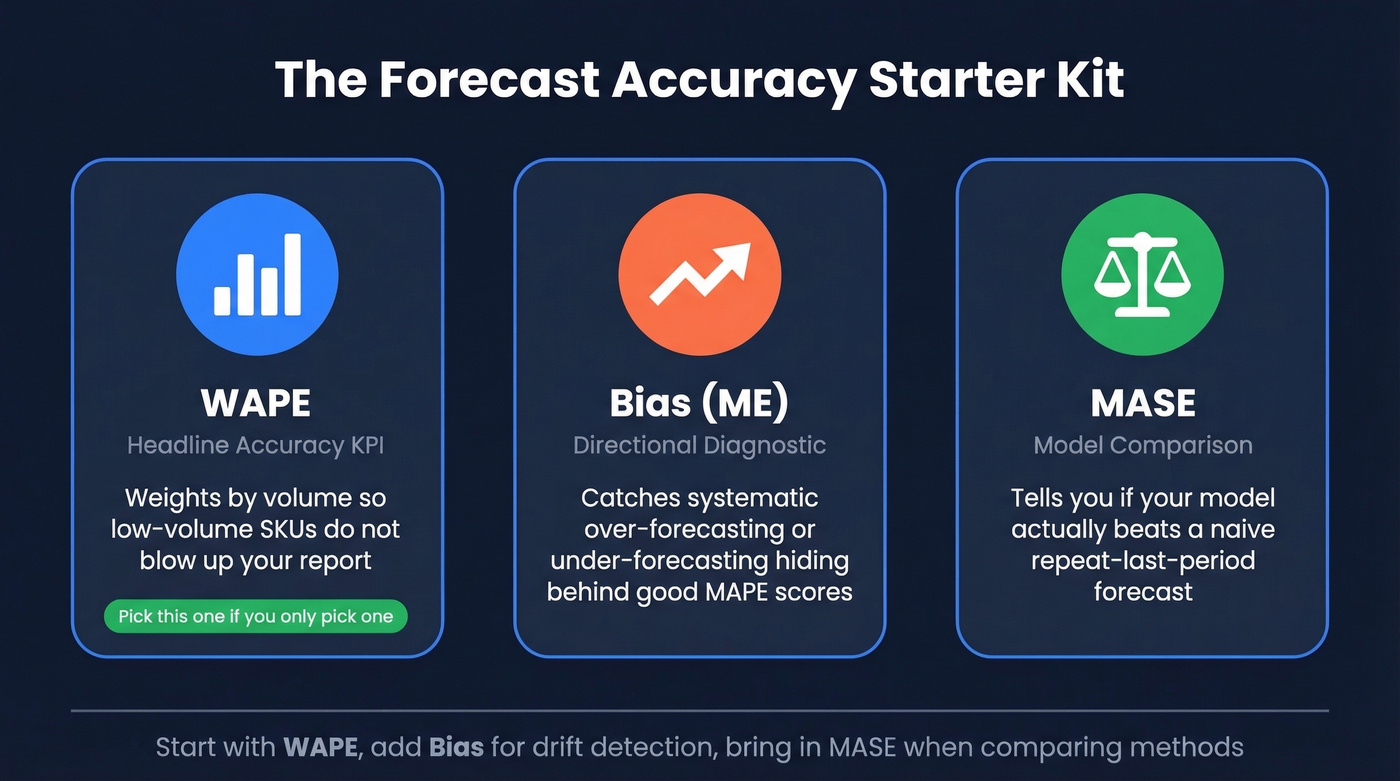
If you only pick one, pick WAPE. Stop letting a single low-volume SKU with 800% error blow up your accuracy report.
7 Forecast Error Calculations
MAE (Mean Absolute Error)
Formula: MAE = (1/n) x Sigma|Actual - Forecast|
Actuals: 100, 120, 90. Forecasts: 110, 115, 95. MAE = (10 + 5 + 5) / 3 = 6.67. It's in the same units as your data and less sensitive to outliers than RMSE, which makes it a strong starting point for consistent-performance tracking. The downside: no normalization, so you can't compare across product lines with different scales.
MAPE (Mean Absolute Percentage Error)
Formula: MAPE = (1/n) x Sigma(|Actual - Forecast| / Actual) x 100
Same data: MAPE = ((10/100) + (5/120) + (5/90)) / 3 x 100 = roughly 5.2%. Easy to communicate. Easy to misuse.
MAPE has two critical pitfalls. First, it blows up when actuals approach zero - forecast 27, actual 3, and you're at 800% error. Practitioners get stuck on whether to divide by actuals or forecasts; MAPE normalizes by actuals, which is exactly why near-zero actuals cause explosions.
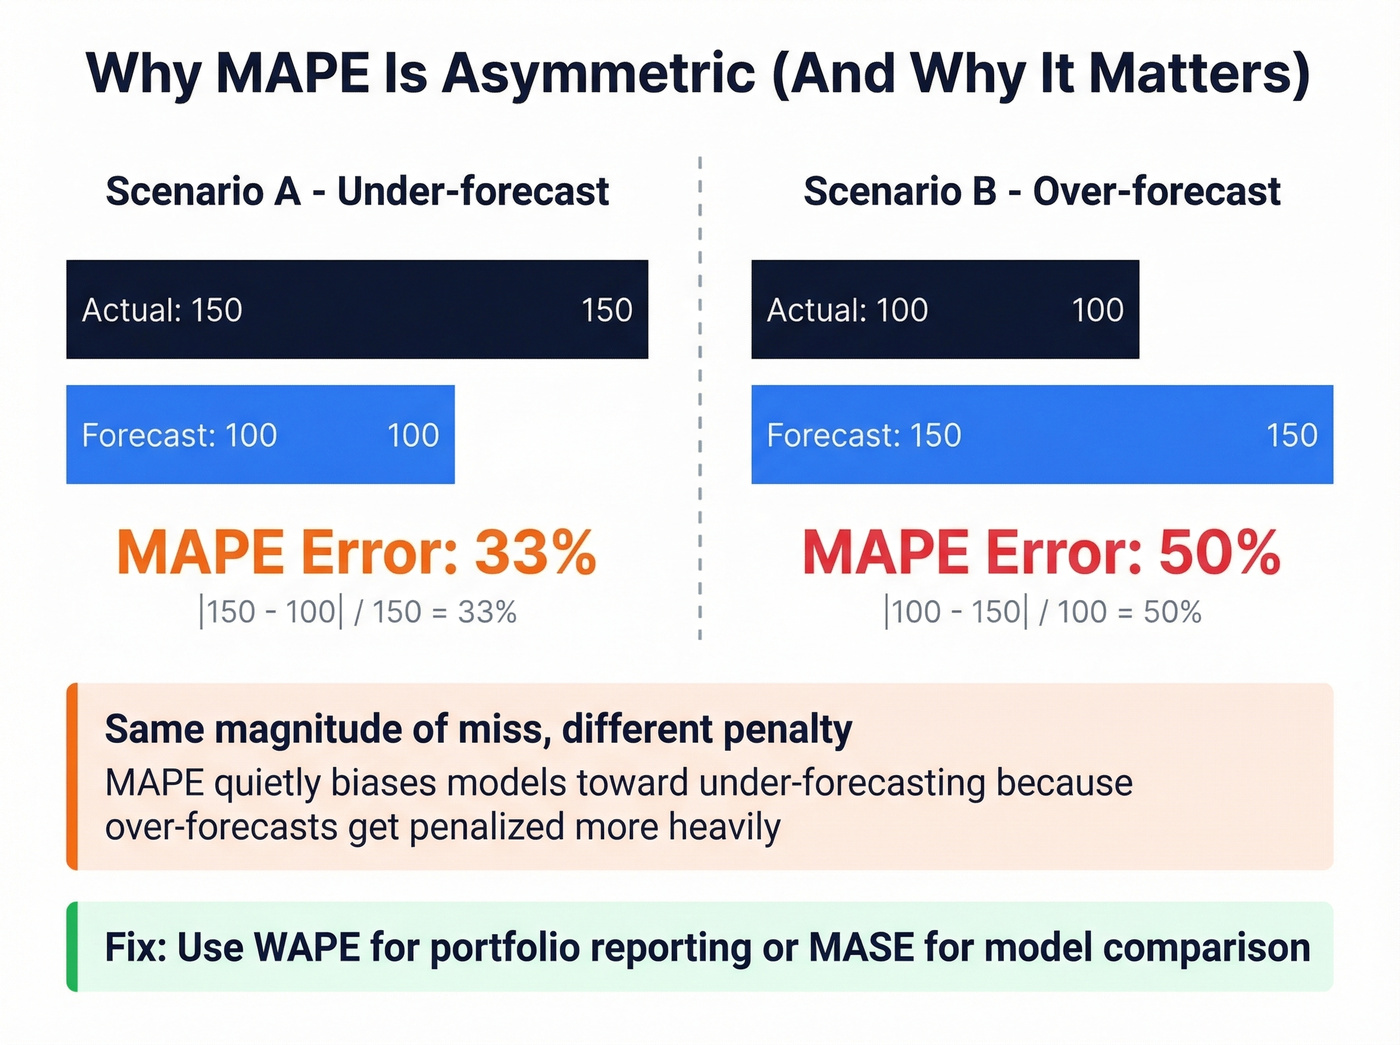
Second, it's asymmetric. Hyndman demonstrated that forecasting 100 when the actual is 150 gives 33% error, but forecasting 150 when the actual is 100 gives 50%. Same magnitude of miss, different penalty - quietly biasing models toward under-forecasting. For high-volume, stable products with no near-zero actuals, MAPE works fine. For everything else, you need something better.
WAPE / WMAPE (Weighted Absolute Percentage Error)
Formula: WAPE = Sigma|Actual - Forecast| / Sigma Actual x 100
Using the same data: WAPE = (10 + 5 + 5) / (100 + 120 + 90) x 100 = 6.5%. Instead of averaging percentage errors equally across all items - where a low-volume SKU with 500% error hijacks the result - WAPE weights by volume. 52% of survey respondents used WMAPE defined this way, making it the most popular single metric among planning professionals.
Here's the thing: WAPE outputs a single accuracy percentage for the entire portfolio, which makes it the easiest metric to present to executives who don't want SKU-level detail. For even sharper business alignment, weight by revenue or margin rather than units.
RMSE (Root Mean Squared Error)
Formula: RMSE = sqrt[(1/n) x Sigma(Actual - Forecast)^2]
Same data: RMSE = sqrt[(100 + 25 + 25) / 3] = sqrt(50) = roughly 7.07. Because errors are squared before averaging, large misses get penalized disproportionately. Use it when big errors are genuinely more costly than small ones - perishable goods, capacity-constrained manufacturing. Usually avoid it for intermittent demand with natural spikes.
Bias / Mean Error (ME)
Formula: ME = (1/n) x Sigma(Forecast - Actual)
Positive ME means over-forecasting; negative means under-forecasting. This isn't a standalone accuracy metric - it's a diagnostic. A forecast can look accurate on MAPE while systematically running 10% high, building excess inventory quarter after quarter. Pair Bias with WAPE to catch this.
MASE (Mean Absolute Scaled Error)
Formula: MASE = MAE / [(1/(n-1)) x Sigma|Actual_t - Actual_{t-1}|]
The interpretation is simple. MASE > 1 means your model is worse than a naive "repeat last period" forecast. MASE < 1 means it adds value. MASE = 0.75 means your errors are 25% smaller than naive. Proposed by Hyndman & Koehler (2006), MASE avoids MAPE blow-ups near zero and handles intermittent demand well, except for trivial all-equal histories where the denominator zeroes out.
Tracking Signal
Formula: Tracking Signal = RSFE / MAD
RSFE is the running sum of forecast errors (signed); MAD is mean absolute deviation. If your cumulative signed error is 120 and your MAD is 40, tracking signal = 3.0 - within the normal +/-4 range. Above +4 or below -4, you've got systematic bias that needs correction.
With the common convention where error = Actual - Forecast, positive tracking signal indicates under-forecasting and negative indicates over-forecasting. Think of this as your ongoing monitoring tool, not a one-time evaluation metric.
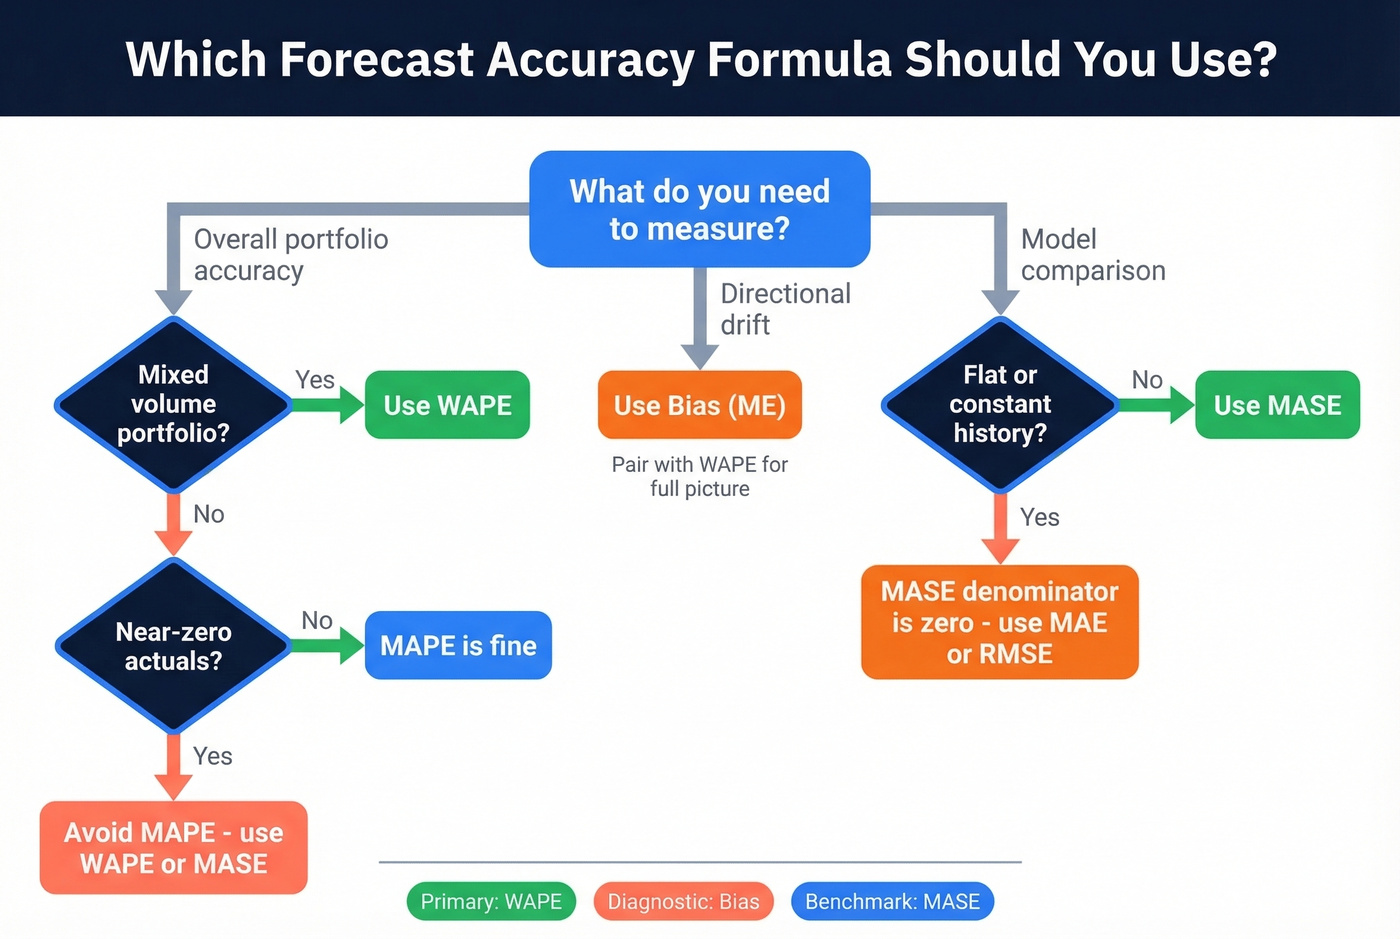
How to Choose the Right Formula
| Metric | Best For | Avoid When | Role |
|---|---|---|---|
| WAPE | Mixed portfolios | Single-item analysis | Primary KPI |
| Bias (ME) | Directional diagnosis | Standalone reporting | Complement |
| MASE | Model comparison | Flat history | Benchmarking |
| MAPE | Stable, high-volume | Near-zero actuals | Communication |
| RMSE | Costly large errors | Spikey demand | Penalty-weighted |
| MAE | Consistent tracking | Cross-scale comparison | Baseline |
| Tracking Signal | Ongoing monitoring | One-time evaluation | Alert system |
You don't need all seven. In our experience, teams that switch from MAPE to WAPE stop arguing about outlier SKUs within the first quarter. Start with WAPE, add Bias to catch directional drift, bring in MASE when comparing forecasting methods.
If you want a deeper breakdown of when each metric fails in practice, see our guide to forecast accuracy metrics.
You obsess over forecast accuracy because bad numbers destroy downstream decisions. The same logic applies to your sales pipeline: 98% email accuracy means your outreach forecasts actually convert. Prospeo's 7-day data refresh keeps contact data as fresh as your demand signals.
Stop letting stale data blow up your pipeline forecast like a near-zero MAPE denominator.
Skip sMAPE
sMAPE was supposed to fix MAPE's asymmetry. It didn't.
Hyndman's critique is damning: the literature is "littered with errors", and multiple competing definitions exist across papers. A peer-reviewed paper showed that for sufficiently intermittent demand, sMAPE is minimized by a zero forecast - the "optimal" prediction is that nothing will sell. We've seen planning teams waste months optimizing a metric that actively rewards useless forecasts. Use MASE instead.
What "Good" Accuracy Looks Like
Segment your portfolio first, then use widely cited planning benchmarks by product type:
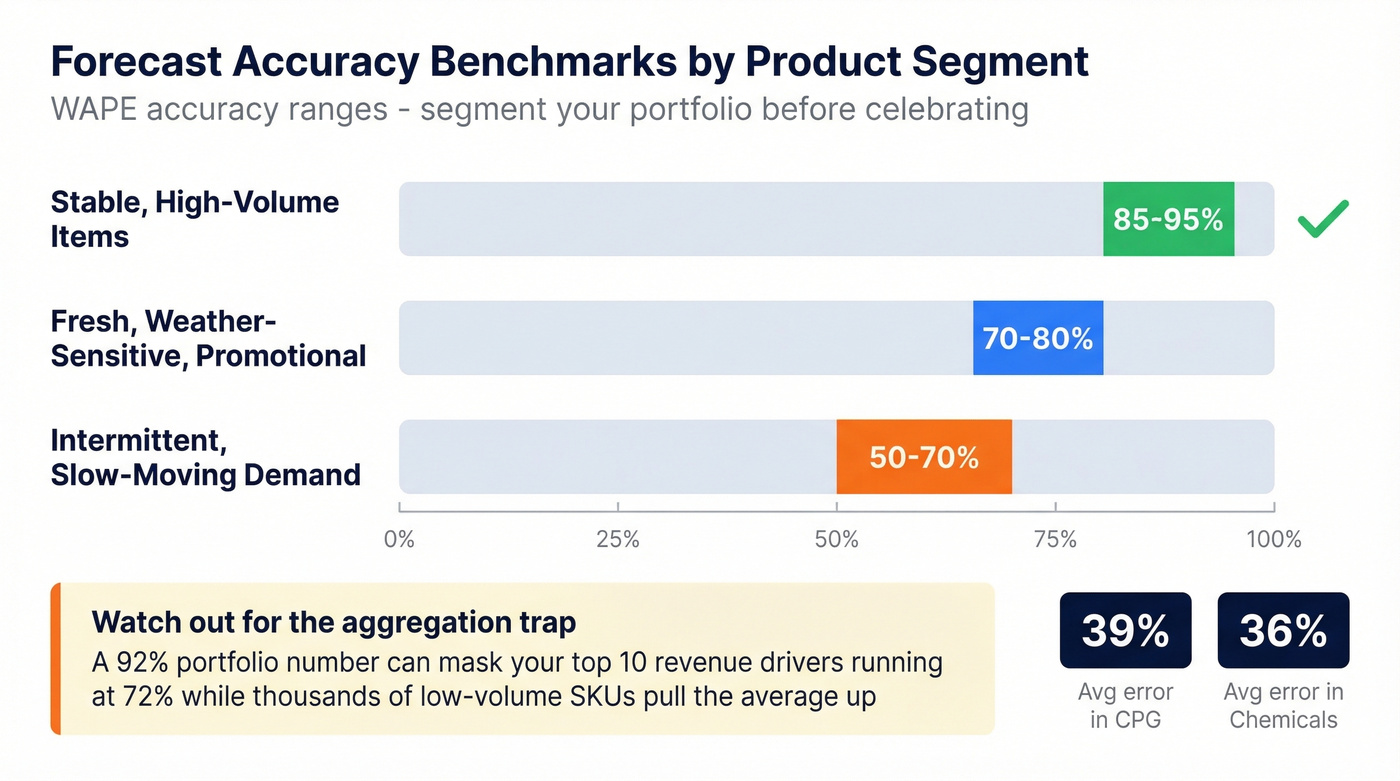
- Stable, high-volume items: 85-95% WAPE accuracy is achievable
- Intermittent / slow-moving demand: 50-70% is realistic
- Fresh / weather-sensitive / promotional: 70-80% is solid
Average forecast error runs 39% in CPG and 36% in chemicals - those numbers reflect portfolio averages across thousands of SKUs including long-tail items.
Let's be honest: if your portfolio-level accuracy looks great but you haven't segmented, you don't actually know your accuracy. A 92% aggregate number can easily mask your top 10 revenue drivers running at 72% while thousands of low-volume SKUs with trivial errors pull the average up. Always segment before celebrating.
Common Mistakes
Using sales instead of demand. If you stocked out for two weeks, sales = 0 doesn't mean demand = 0. Evaluate against actual demand, not shipments.
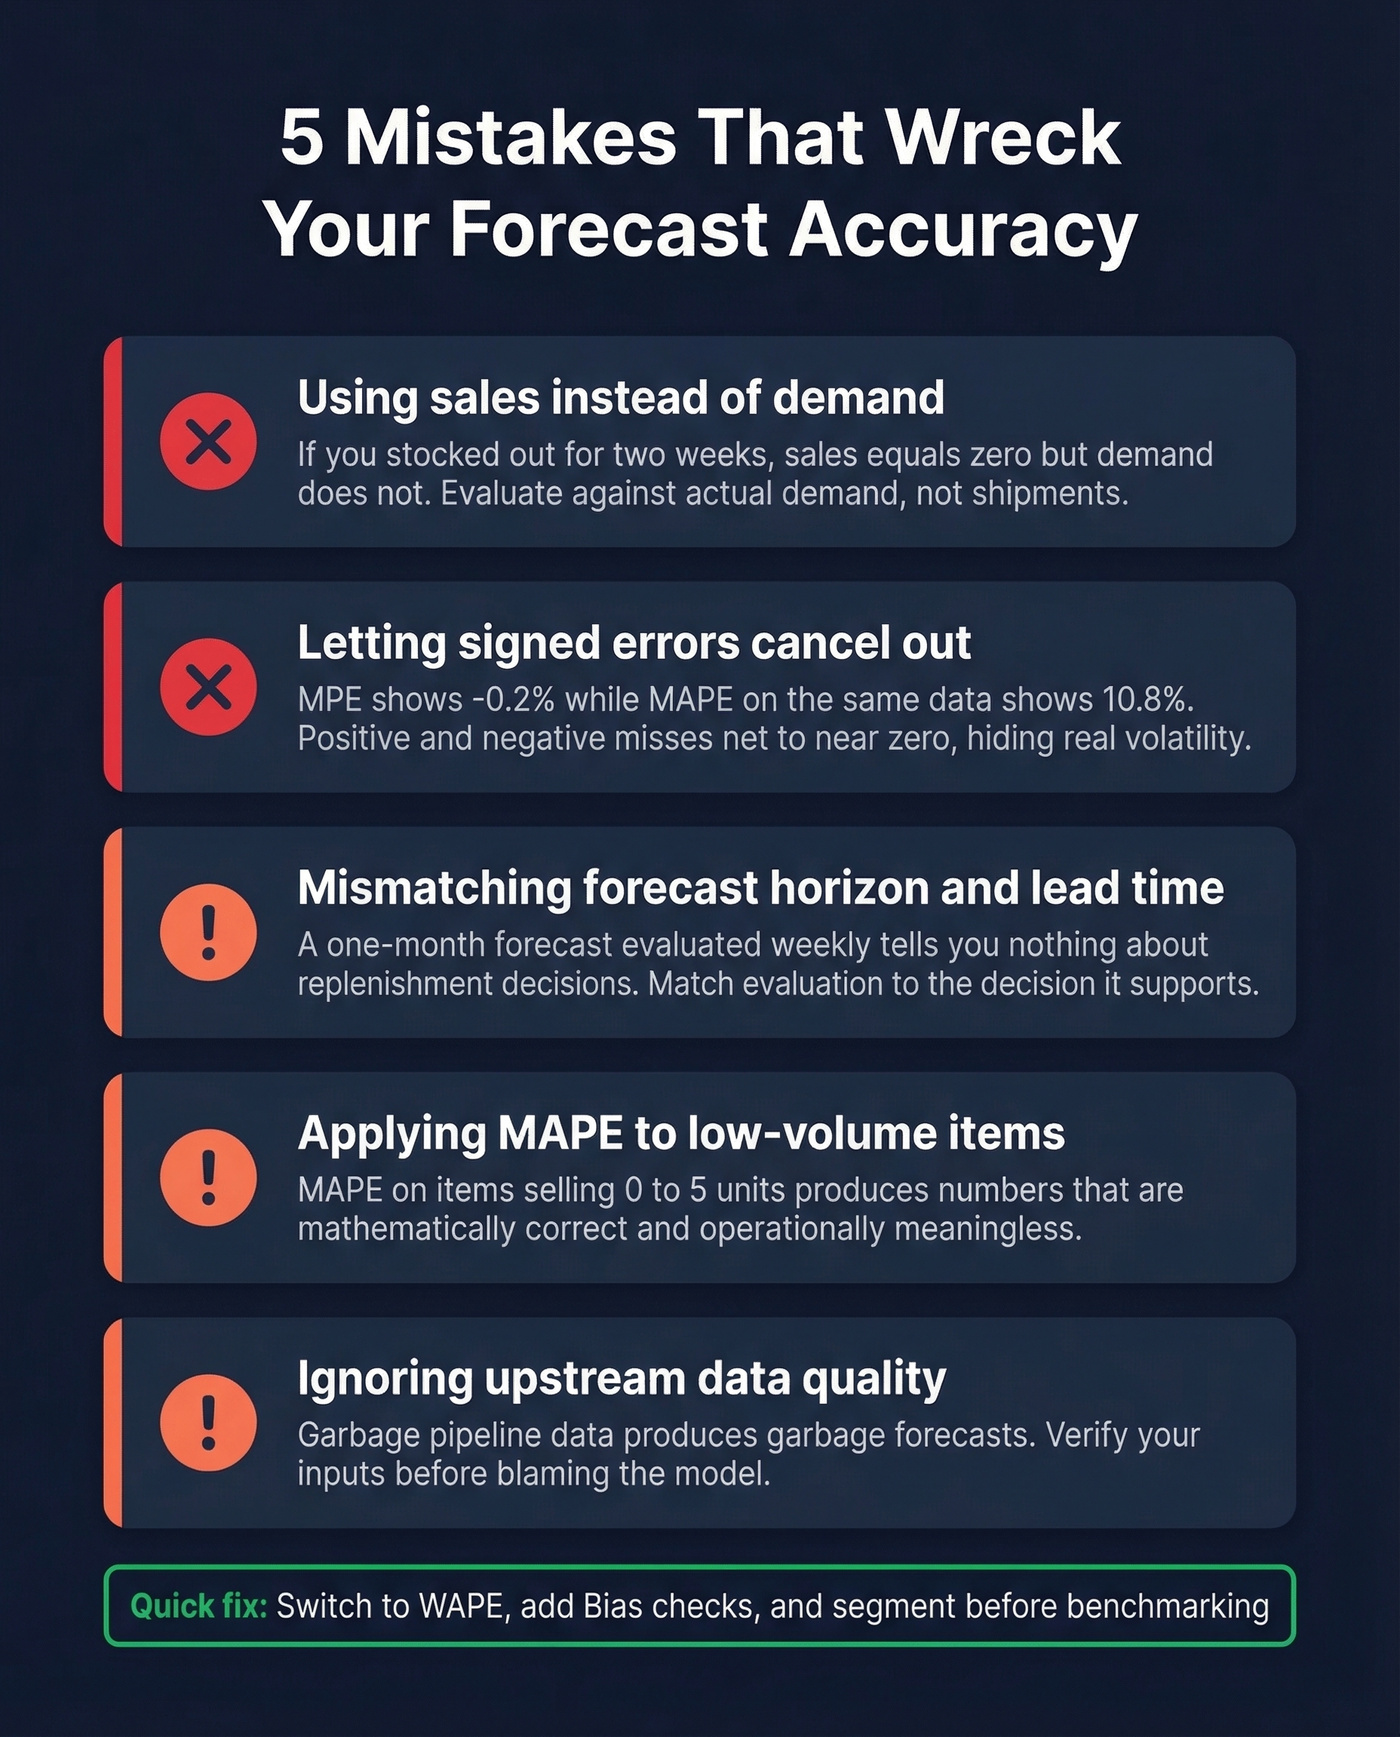
Letting signed errors cancel out. Average raw errors (MPE) and you'll get -0.2%. Average absolute errors (MAPE) on the same data: 10.8%. The signed errors look fine because positive and negative misses net to near-zero, hiding real forecast volatility.
Mismatching forecast horizon and lead time. A one-month forecast evaluated weekly tells you nothing about replenishment decisions. Match your evaluation window to the decision it supports.
Applying MAPE to low-volume items. MAPE on items selling 0-5 units produces numbers that are mathematically correct and operationally meaningless.
Ignoring upstream data quality. The same principle applies to revenue forecasting - garbage pipeline data produces garbage forecasts. If a meaningful share of your contacts bounce when reps email them, your revenue forecast is built on phantom deals. Prospeo verifies emails at 98% accuracy so pipeline numbers reflect reality rather than wishful thinking.
If you're building a pipeline forecast from CRM stages, it helps to standardize your sales pipeline stages and keep tight pipeline hygiene so your inputs don't drift.
Bias kills forecasts - and bad contact data biases your entire revenue model. Teams using Prospeo book 26% more meetings than ZoomInfo users because 98% verified emails and 125M+ direct dials eliminate the noise from your outbound predictions.
Get a MASE below 1 on your pipeline - start with data that actually connects.
FAQ
Can forecast accuracy be negative?
Accuracy itself can't be negative, but 100% - MAPE produces negative numbers when percentage error exceeds 100%. This typically happens with low-volume items where actuals approach zero. Switch to WAPE or MASE to avoid nonsensical outputs.
What's a good forecast accuracy percentage?
Stable, high-volume items should hit 85-95% WAPE accuracy. Intermittent demand realistically lands at 50-70%. Always segment by demand pattern before setting benchmarks - a single portfolio-wide number hides more than it reveals.
What's the difference between MAPE and WMAPE?
MAPE averages percentage errors equally, so a low-volume SKU with 500% error skews everything. WMAPE weights by volume, ensuring high-impact items drive the number. For mixed portfolios, WMAPE is the more reliable forecast accuracy formula for executive reporting.