Go-to-Market Objectives: Benchmarks and Templates Every Other Guide Leaves Out
Bain found that only 9% of companies achieved 5.5%+ annual revenue and profit growth over a decade. Their takeaway isn't "set more goals." It's that winners build adaptive, repeatable go-to-market systems with fast feedback loops instead of relying on vague plans and broken handoffs. If you're setting go-to-market objectives for 2026, you don't need 20. You need 3-5, with real benchmarks behind them.
What Are Go-to-Market Objectives?
Go-to-market objectives are the specific, measurable outcomes your GTM plan must produce. They sit between strategy (how you'll win) and KPIs (what you'll track daily). TechTarget identifies five core categories: awareness, lead generation and conversion, market share expansion, brand positioning, and cost optimization. Most B2B teams should pick one from each of the first three and stop there.
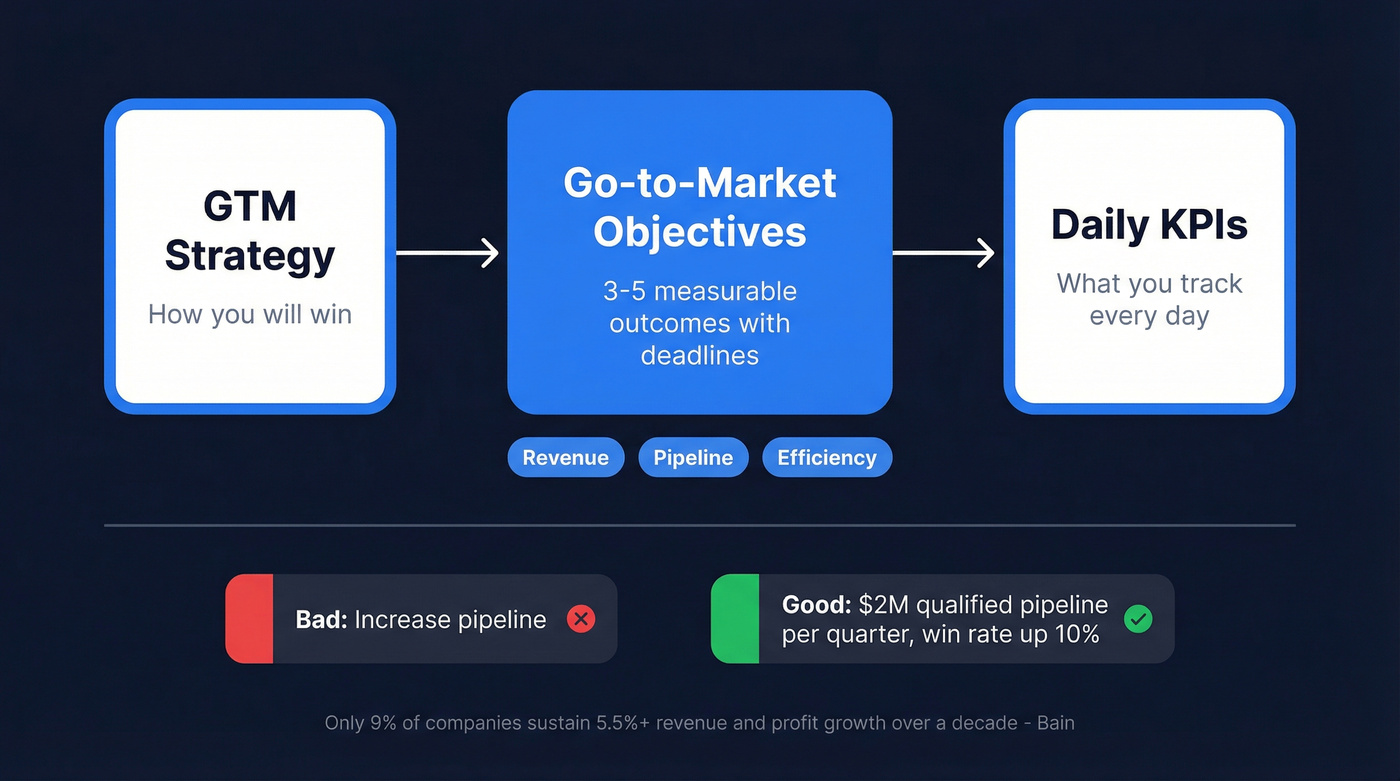
Here's the thing: the typical management team promises revenue growth 2x the market average and earnings 4x. Almost none deliver. The problem isn't ambition. It's writing objectives without anchoring to what "good" actually looks like for your motion, segment, and stage. "Increase pipeline" isn't an objective - it's a wish. An objective has a number, a timeframe, and a threshold that tells you whether execution is broken.
Go-to-Market Objectives Examples by Function
Real OKR-style objectives across four functions. These are stretch targets - hitting roughly 70% means you're on track.
| Function | Objective | Key Results |
|---|---|---|
| Marketing | Drive efficient demand | 300 MQLs/quarter · CPL $40 to $28 · MQL-to-SQL 20%+ |
| Sales | Build qualified pipeline | $2M pipeline/quarter · Win rate +10% · Enterprise cycle 90 to 65 days |
| CS | Reduce churn, grow NPS | NPS 35 to 45 · Gross churn <5% · NRR 105% to 115% |
| Product | Improve trial conversion | Abandonment 40% to 30% · Trial-to-paid 20% to 30% · Feature adoption +30% in 90 days |
The Sales row is where most plans collapse. Hitting $2M/quarter in qualified pipeline starts with accurate contact data. If your bounce rate exceeds 5%, your outbound metrics break down and your pipeline math stops being trustworthy. When 1 in 20 emails bounces - before counting spam folder losses - you can't measure real performance against objectives.
Prospeo closes that gap with 98% email accuracy, 143M+ verified emails, and a 7-day data refresh cycle versus the industry average of six weeks. If your list quality drifts week to week, your "pipeline created" number becomes a vanity metric fast.

Benchmarks for Go-to-Market Objectives
These are the numbers your objectives should be calibrated against. A 2026 benchmark compilation pegs CAC at roughly $2.00 per new ARR dollar, making efficiency objectives non-negotiable.
| Metric | Benchmark Range | Top Quartile | Red Flag |
|---|---|---|---|
| CAC Payback | Median 15 months | <12 months | >18 months |
| NRR | 101-102% | >110% | <100% |
| Win Rate | 20-30% | >30% | <15% (qualification broken) |
| Sales Cycle | Median 84 days | 46-75 days | >120 days |
| Lead-to-Customer | 2-5% | >5% | <1.5% |
| Pipeline Coverage | 3-4x (mature) | 4-5x (growth) | <2.5x |
| MQL-to-SQL | 15-21% | >25% | <10% |
| Time-to-Revenue (SMB) | 30-45 days | <30 days | >60 days |
| Time-to-Revenue (Mid-Market) | 60-120 days | <60 days | >150 days |
| Time-to-Revenue (Enterprise) | 170+ days | <150 days | >250 days |
If your win rate is below 15%, don't blame your closers. Your qualification criteria are broken. And if MQL-to-SQL is under 10%, marketing and sales aren't aligned on what "qualified" means.
Your GTM objectives are only as good as the pipeline behind them. If bounce rates exceed 5%, every metric downstream - win rate, CAC payback, MQL-to-SQL - becomes unreliable. Prospeo delivers 98% email accuracy and 125M+ verified mobiles on a 7-day refresh cycle, so your pipeline numbers reflect reality.
Hit your pipeline targets with data that doesn't decay between reviews.
Setting a $2M/quarter pipeline objective means nothing if your contact data is six weeks stale. Prospeo refreshes 300M+ profiles every 7 days - 6x faster than the industry average - so your outbound execution keeps pace with your GTM plan. At $0.01 per email, your CAC payback math stays intact.
Stop calibrating objectives against data you can't trust.
GTM Objectives by Motion
Your motion determines your objectives, not the other way around. A PLG company optimizing for 18-month CAC payback is playing the wrong game entirely.
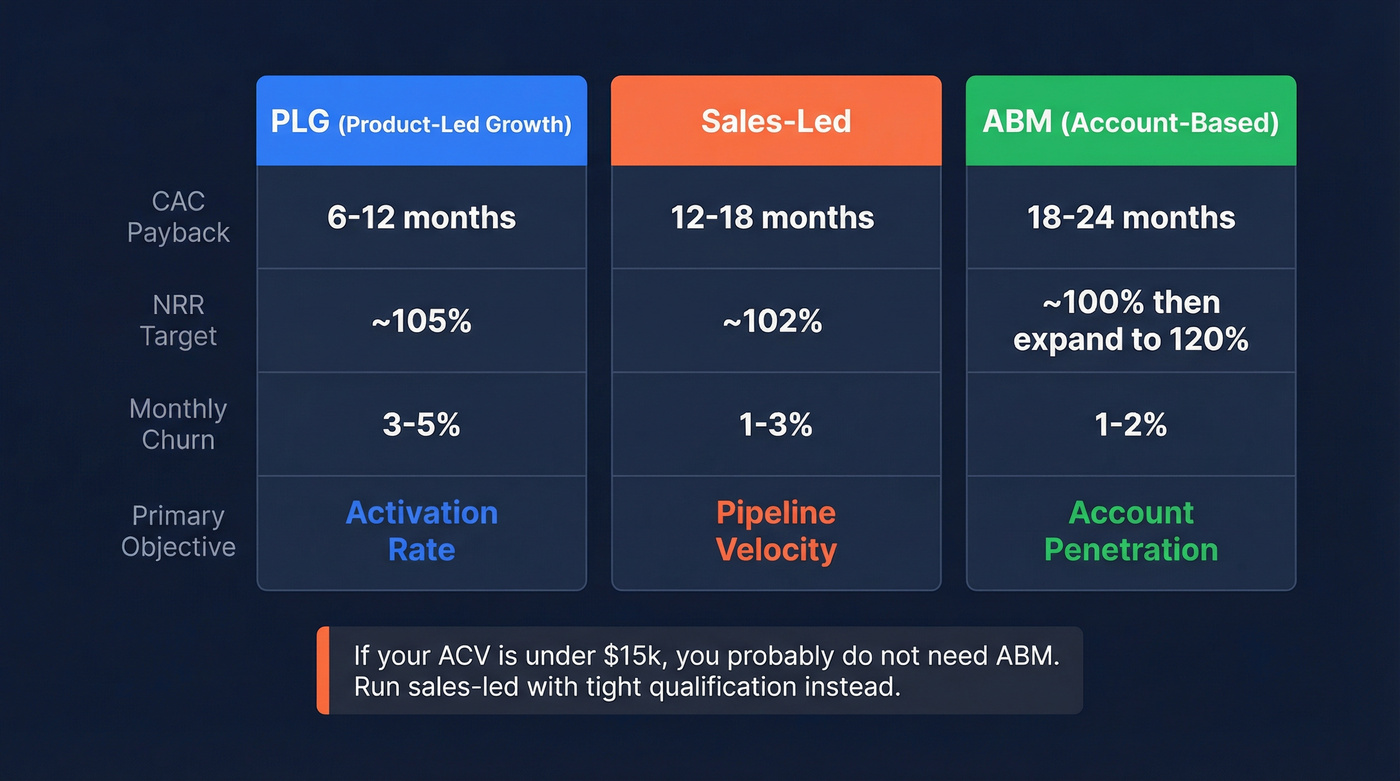
| Metric | PLG | Sales-Led | ABM |
|---|---|---|---|
| CAC Payback | 6-12 months | 12-18 months | 18-24 months |
| NRR Target | ~105% | ~102% | ~100% (expand to 120%) |
| Monthly Churn | 3-5% | 1-3% | 1-2% |
| Primary Objective | Activation rate | Pipeline velocity | Account penetration |
ABM teams often panic at higher CAC payback numbers. Don't. A 20-month payback on a $200k ACV deal with 1% monthly churn is a great business. The red flag is when payback exceeds expected customer lifetime - that's when the math breaks.
Let's be honest: if your average contract value is under $15k, you almost certainly don't need ABM-level complexity. Run a sales-led motion with tight qualification and save yourself six months of "account mapping" that produces three deals. The consensus on r/sales tends to agree - ABM without enterprise deal sizes is just expensive outbound with extra steps.
Leading vs. Lagging Indicators
Every objective needs both. Leading indicators tell you if you're on track this week. Lagging indicators tell you if the quarter worked.
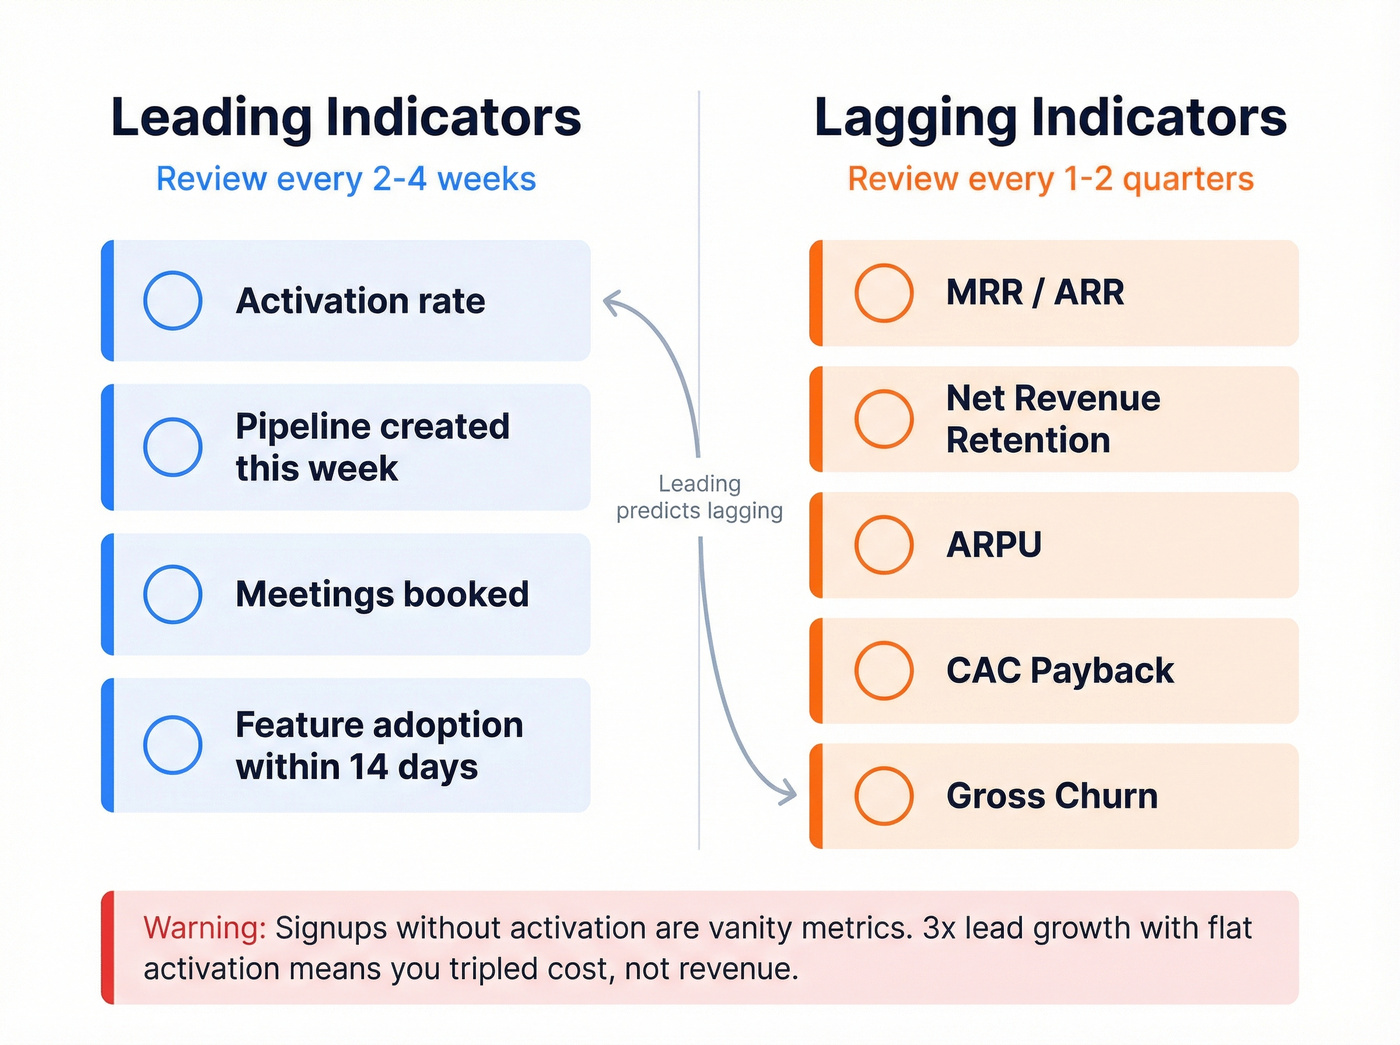
Leading: activation rate, pipeline created this week, meetings booked, feature adoption within 14 days.
Lagging: MRR/ARR, NRR, ARPU, CAC payback, gross churn.
Signups without activation are vanity metrics. We've seen teams celebrate 3x lead growth while activation stayed flat - tripling cost without tripling revenue. Set your review cadence before launch: 2-4 weeks for leading indicators, 1-2 quarters for lagging.
Choosing a Framework
You don't need all of these. You need one.
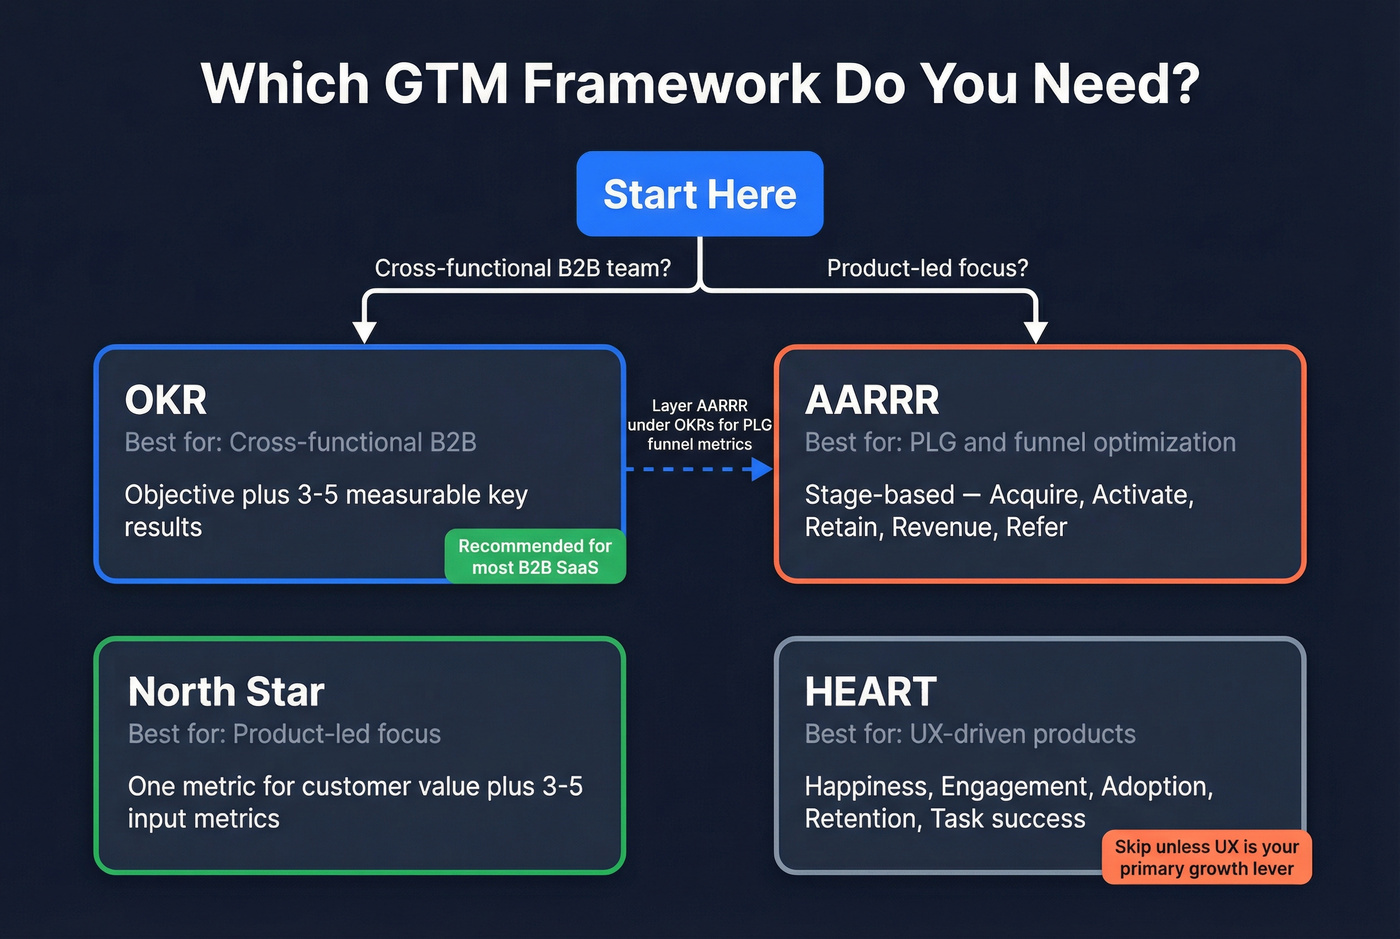
| Framework | Best For | Core Idea |
|---|---|---|
| OKR | Cross-functional B2B | Objective + 3-5 measurable key results |
| AARRR | PLG / funnel optimization | Stage-based: Acquire, Activate, Retain, Revenue, Refer |
| North Star | Product-led focus | One metric for customer value + 3-5 input metrics |
| HEART | UX-driven products | Happiness, Engagement, Adoption, Retention, Task success |
Most B2B SaaS teams should default to OKRs. They force cross-functional alignment, cascade cleanly from company to team to individual contributor, and they're the only framework that naturally accommodates sales, marketing, CS, and product in one system. Running PLG? Layer AARRR underneath your OKRs to structure funnel-stage metrics. Skip HEART unless you're a product-led company where UX is the primary growth lever - for most B2B teams, it adds complexity without adding clarity.
Common Mistakes
Five anti-patterns that kill GTM plans.
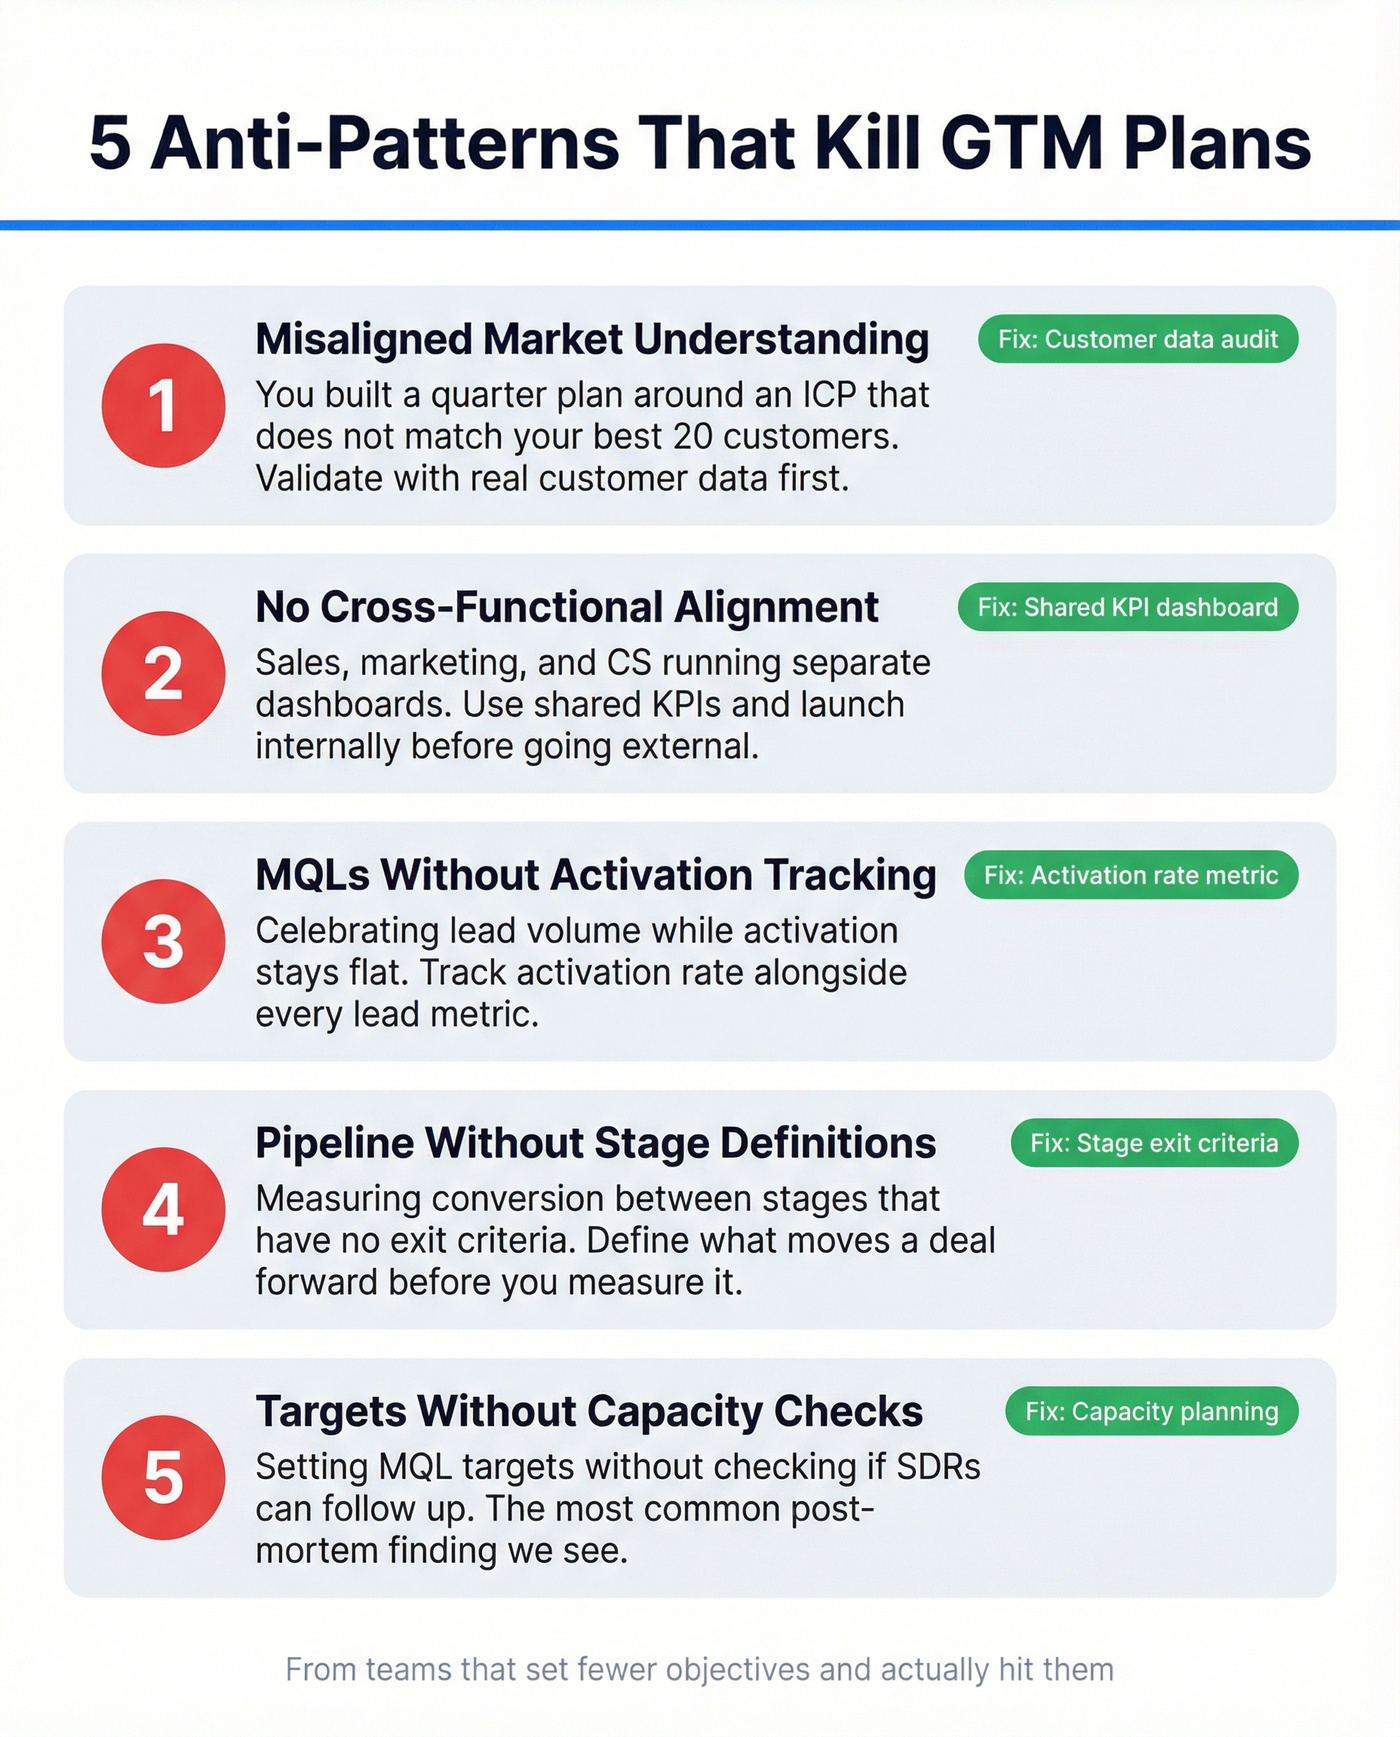
- Misaligned market understanding. Validate your ICP with actual customer data before setting any targets. We've watched teams build entire quarter plans around an ICP that didn't match their best 20 customers.
- No cross-functional alignment. Use shared KPIs across sales, marketing, and CS - not separate dashboards. Launch internally before going external.
- MQLs without activation tracking. Track activation rate alongside lead volume. Leads that don't activate aren't leads.
- Pipeline without stage definitions. Define exit criteria per stage before you measure conversion between them.
- Setting targets without checking capacity. In our experience, the most common post-mortem finding is that teams set MQL targets without checking SDR capacity - they generated leads nobody could follow up on.
FAQ
What's the difference between go-to-market goals and go-to-market objectives?
Goals are directional ("grow revenue"). Objectives have a number and a deadline ("increase ARR 30% in Q3, CAC payback under 12 months"). Goals set direction; objectives define the measurable milestones that prove you're getting there, and they should map to 3-5 key results you can review every 2-4 weeks.
How many go-to-market objectives should a team set?
Three to five. One revenue outcome, one pipeline outcome, and one efficiency outcome are the core. Add one retention/expansion objective if you have meaningful existing revenue. Once you go past five, teams start trading focus for paperwork and your weekly operating cadence collapses.
How do you build the pipeline to hit GTM objectives?
Start with accurate contact data - bounce rates above 5% mean your outbound metrics are lying to you. From there, it's about matching your prospecting volume to your pipeline coverage target, defining clear stage exit criteria, and reviewing leading indicators every two weeks so you catch problems before the quarter's already lost.
Set Fewer Objectives, Make Them Measurable
The best go-to-market objectives are boring in the right way: a small set of measurable outcomes tied to benchmarks, reviewed on a cadence, and backed by inputs you can actually control. Pick 3-5, calibrate them to your motion, and make sure your data quality is good enough that you can trust the scoreboard.