How to Calculate Total Addressable Market (2026 Guide)
The formula fits on a napkin: customers x price. The reason founders spend weeks on TAM isn't the math - it's finding the inputs. As one founder on r/startups put it, they could find only "loose data" for broad market size but struggled to get a customer count for their specific segment. That's the real problem, and it's the one most TAM guides skip over.
Bottom-up is the most defensible method. Use government databases for free baseline data, a sales prospecting database for firmographic account lists, and validate against one analyst report. The rest of this guide walks through the math, the data sources, and the mistakes that make investors tune out.
What Is Total Addressable Market?
Total addressable market is the total revenue opportunity if you captured 100% of your market with zero competition. It's a ceiling, not a forecast. Nobody gets 100% - the point is to define the boundary of your ambition and then narrow from there.
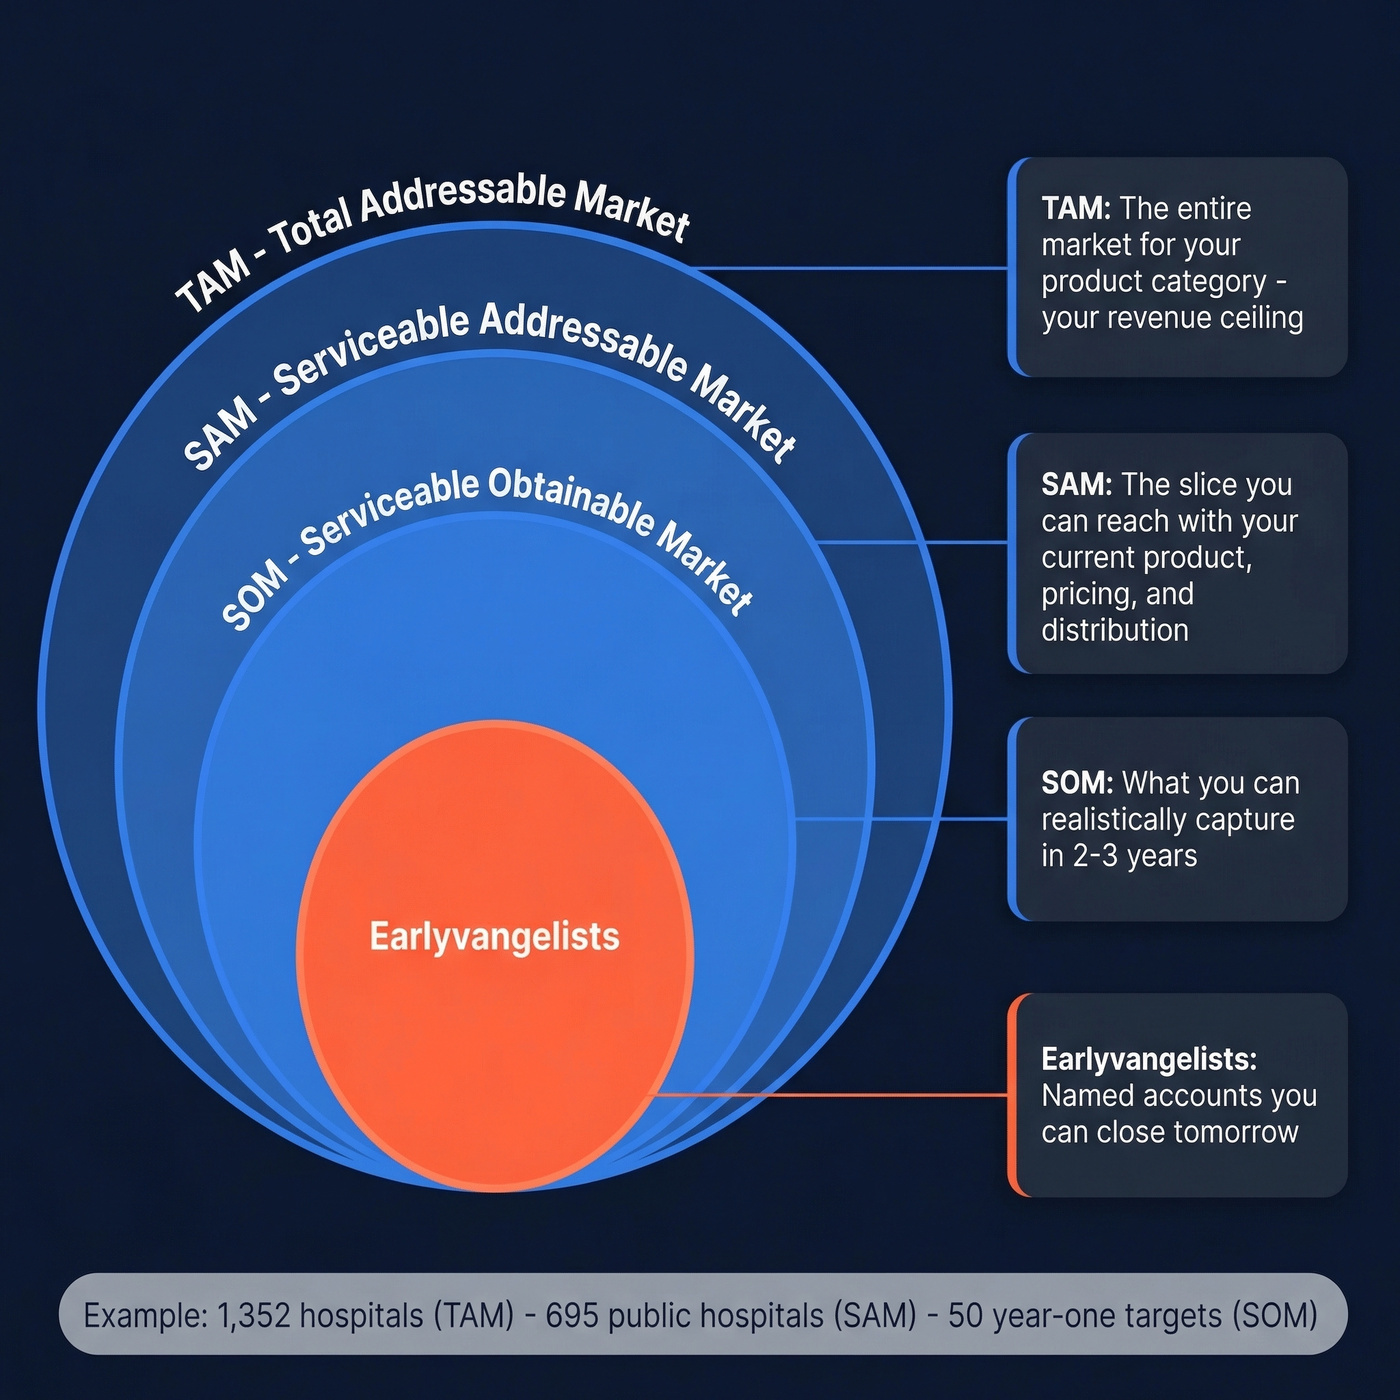
TAM breaks into three concentric layers:
- TAM - the entire market for your product category, globally or within your defined geography.
- SAM (Serviceable Addressable Market) - the slice you can actually reach with your current product, pricing, and distribution.
- SOM (Serviceable Obtainable Market) - the portion you can realistically capture in the next 2-3 years given your team, budget, and competitive position.
Some frameworks add a fourth layer below SOM: earlyvangelists. These are your first customers who validate your assumptions before you scale - the accounts you can name by company, describe their pain, and explain why they'd buy tomorrow. Grounding your pitch in specific, nameable prospects rather than abstract percentages is what separates credible founders from hand-wavers.
Here's a concrete example from Antler's framework: imagine you're selling medical software to hospitals in Australia at $1,000/year per license. There are 1,352 hospitals in the country. TAM = 1,352 x $1,000 = $1.35M. Only 695 are public hospitals that match your buyer profile, so SAM = $695K. Your beachhead market is 50 hospitals in year one - SOM = $50K. Each layer forces you to get more honest about what you can actually win.
Three Methods for TAM Calculation
Top-Down
Start with a published market size from an analyst report (Gartner, IDC, IBISWorld) and filter down to your segment. If the global CRM market is $80B and you sell exclusively to healthcare companies in North America, you'd apply percentage filters - healthcare share, North America share, your product tier - until you reach a number that represents your addressable slice.
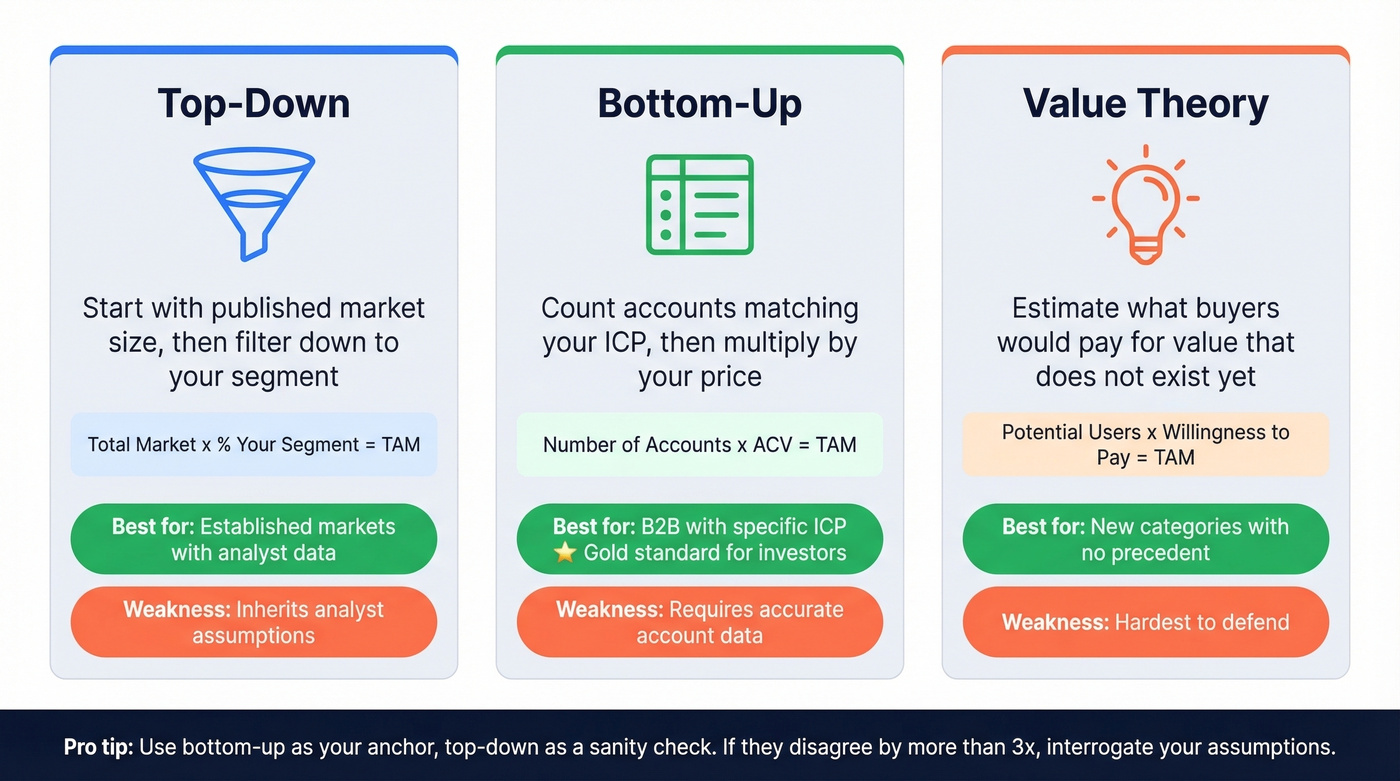
Top-down works best when established market data exists and you need a quick sanity check. The weakness: you're inheriting every assumption the analyst baked in. If their definition of "CRM" includes categories you don't compete in, your TAM is inflated before you start.
Bottom-Up
Count the accounts that match your ideal customer profile, then multiply by your average contract value. This is the gold standard for B2B because it forces you to define exactly who you sell to - industry, NAICS/SIC code, company size, geography, tech stack - and then prove those accounts exist.
We've found bottom-up to be the most defensible method for investors because every input is auditable. If someone challenges your number, you can show the filter criteria and the account list. No hand-waving required.
Value Theory
Value theory estimates what buyers would pay for a new kind of value, even if the market doesn't exist yet. Before Uber, there was no "ridesharing market." You couldn't size it by looking at taxi revenue because the product fundamentally changed who would pay for rides, how often, and at what price.
Use value theory when your product expands or creates a market. It's the hardest to defend but sometimes the only honest approach.
Which Method Should You Use?
| Situation | Best Method |
|---|---|
| Established market, data exists | Top-down |
| Specific ICP, B2B product | Bottom-up |
| New category, no precedent | Value theory |
Use bottom-up as your anchor and top-down as a sanity check. If they disagree by more than 3x, interrogate your assumptions - one of your inputs is wrong. For new categories, lead with value theory but include a bottom-up estimate of early adopters to keep investors grounded.
Step-by-Step Worked Examples
Simple Product: Hospital Software
- Define the product: Medical records software, $1,000/year per hospital license.
- Count total potential customers: 1,352 hospitals in Australia.
- Calculate TAM: 1,352 x $1,000 = $1.35M.
- Narrow to SAM: Only public hospitals match your buyer profile - 695 x $1,000 = $695K.
- Estimate SOM: Your sales team can realistically close 50 hospitals in year one = $50K.
The hard part wasn't the multiplication. It was knowing there are 1,352 hospitals.
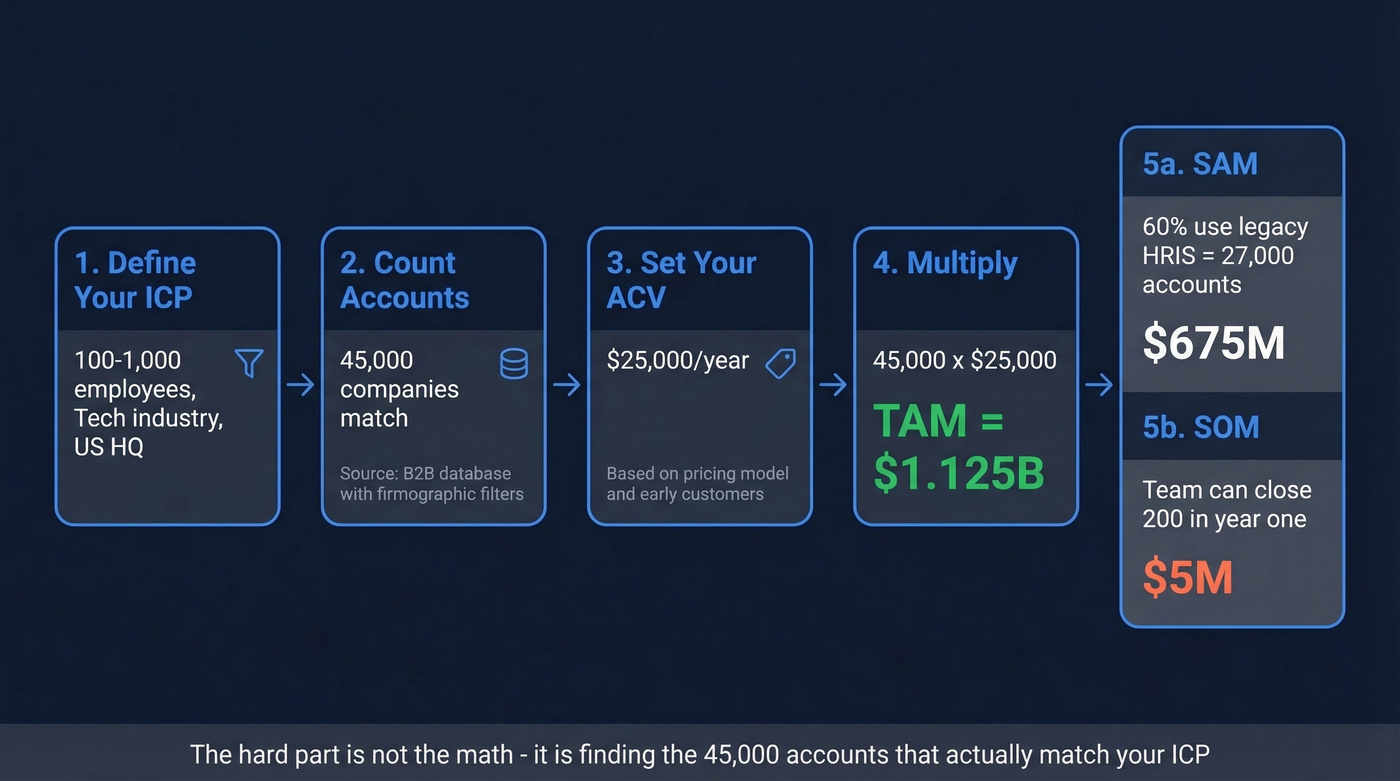
B2B SaaS: HR Analytics Platform
- Define your ICP: Companies with 100-1,000 employees in the technology industry, headquartered in the US.
- Count addressable accounts: Using firmographic filters - employee count, industry code, geography - you identify 45,000 companies that match. A B2B data platform with 30+ search filters lets you build and refine this list far faster than manual research.
- Set your ACV: Based on your pricing model and early customer data, average annual contract value is $25,000.
- Calculate TAM: 45,000 x $25,000 = $1.125B.
- Narrow to SAM: You only sell to companies using legacy HRIS systems - roughly 60% of the 45,000 = 27,000 accounts x $25,000 = $675M.
- Estimate SOM: With your current team and pipeline, you can close 200 accounts in year one = $5M. A useful SOM shortcut: last year's market share x this year's SAM.
Structure this in a spreadsheet. Create columns for segment name, account count source, account count, ACV, and segment TAM. Sum the segments for your total. This makes your assumptions transparent and easy to update quarterly - which you'll need to do, because your assumptions from 12 months ago are already stale.
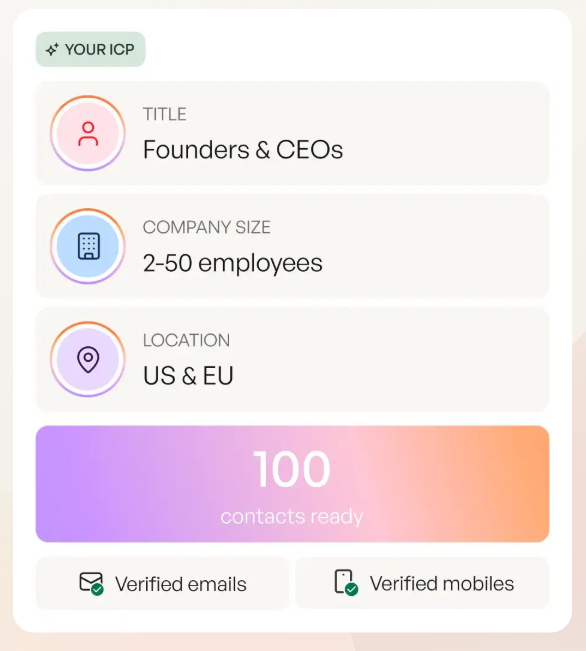
The hardest part of bottom-up TAM is counting accounts that actually match your ICP. Prospeo's B2B database gives you 300M+ profiles with 30+ filters - industry, employee count, tech stack, geography, funding, and more - so you can build an auditable account list in minutes, not weeks.
Turn your TAM from a guess into a named account list for ~$0.01 per lead.
Where to Find Market Sizing Data
Every TAM guide says "use Gartner reports" as if they're free. They cost $2,000-$10,000 each. Here's what's actually available:
| Source | Free/Paid | Best For | ~Cost |
|---|---|---|---|
| US Census Bureau | Free | Business counts by NAICS code/size/state | $0 |
| BLS | Free | Employment by role/industry | $0 |
| SEC Filings | Free | Public company benchmarks | $0 |
| UN Data | Free | Global population/trade stats | $0 |
| ITC Trade Map | Free | Import/export market data | $0 |
| Crunchbase | Paid | Startup/company data | $49-$149/mo |
| Prospeo | Free tier + paid | B2B account lists, firmographics | ~$0.01/lead |
| IBISWorld | Paid | Industry reports | $1K-$3K/report |
| PitchBook | Paid | Institutional market data | ~$20K-$50K/yr |
| Gartner/Forrester | Paid | Analyst market sizing | $2K-$10K+/report |
In our experience, combining three sources produces the most defensible number: start with Census Bureau data for total business counts, use a B2B database to filter down to your ICP, and validate the resulting number against one analyst report. Three sources, three perspectives, one defensible TAM.
Your TAM spreadsheet is only as good as your account count. Instead of cobbling together loose data from five sources, use Prospeo's firmographic filters to pull exact company counts by NAICS code, headcount range, revenue band, and tech stack - then export the list with verified contacts attached.
Go from TAM calculation to pipeline in the same platform.
What Investors Want to See
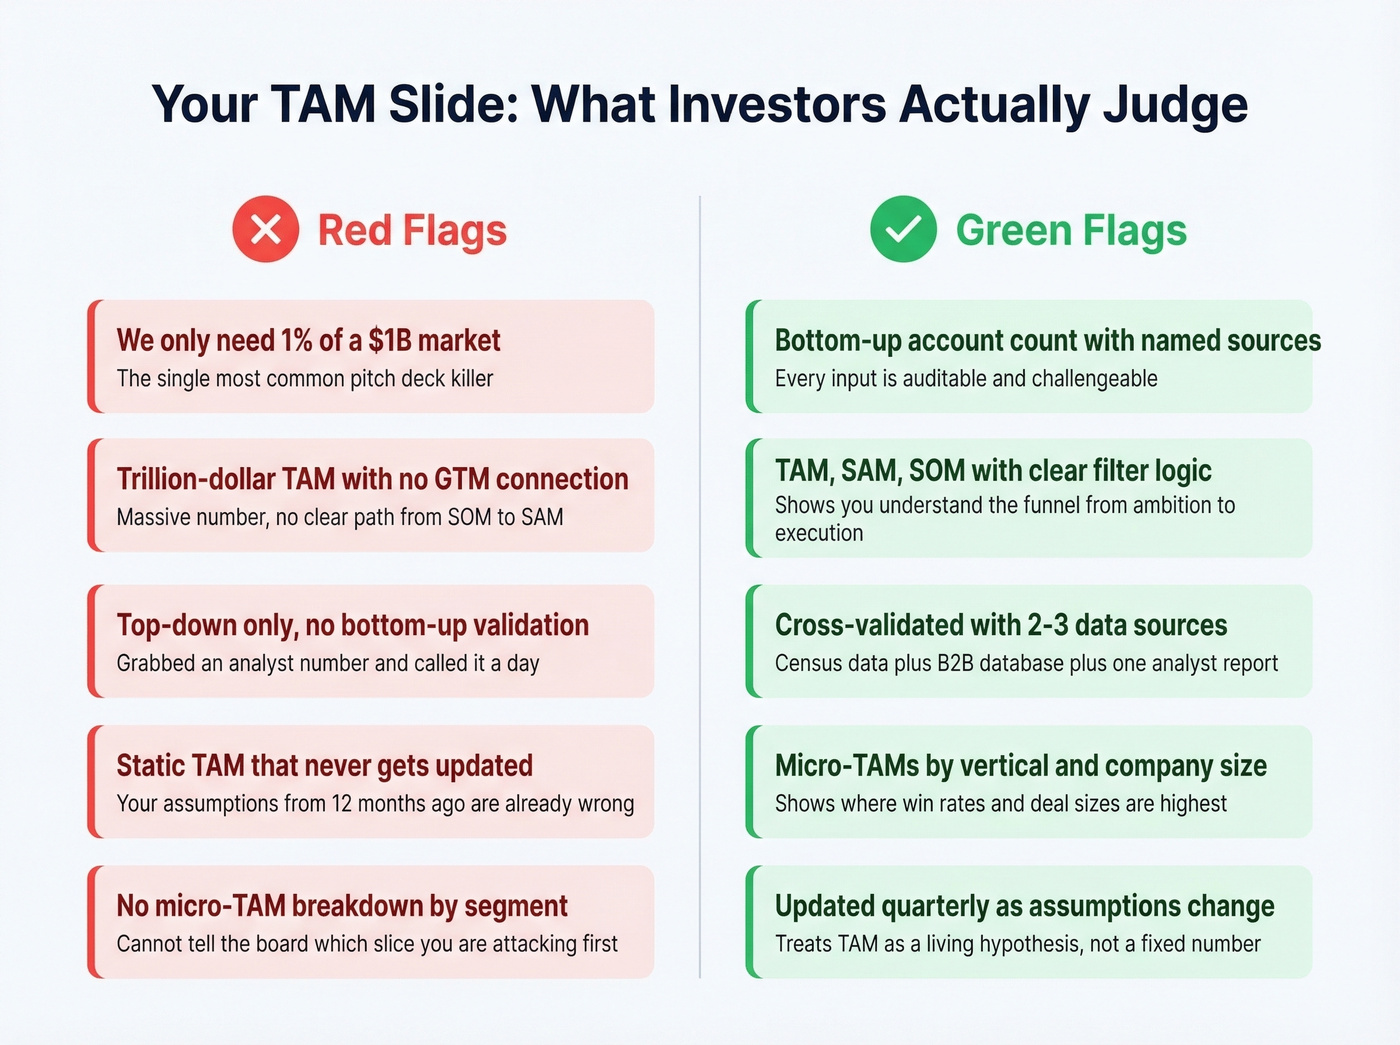
Your TAM slide is a trust test. VCs use it to gauge whether you actually understand your market or just Googled a number. GoingVC's framework breaks down what gets scrutinized at each layer: TAM shows the boundary of your ambition (credible, not trillion-dollar fantasy), SAM shows your focus and GTM alignment, and SOM shows execution realism grounded in actual pipeline math.
If your TAM slide says "$50B market" with no explanation, investors tune out before your next slide.
The red flags that kill credibility:
- "We only need 1% of a $1B market." The single most common pitch-deck killer. It signals you haven't done the work.
- Trillion-dollar TAMs with no GTM connection. A massive number without a clear path from SOM to SAM reads as fantasy.
- No bottom-up validation. Top-down only means you grabbed an analyst number and called it a day.
- Static TAM that never updates. Markets shift. Your assumptions from 12 months ago are already wrong.
Once you have your TAM, break it into micro-TAMs by industry vertical and company size. This tells you where your win rate is highest and where deal sizes are largest - which is what actually drives territory planning and quota allocation. A $1B TAM means nothing if you can't tell your board which $50M slice you're attacking first.
If you want a deeper breakdown of the layers and how they map to GTM, see our guide to the addressable market.
Why Uber's TAM Was Wrong by 25x
In 2014, NYU professor Aswath Damodaran valued Uber by sizing the global taxi and car-service market at $100B and assuming Uber could capture 10%. Bill Gurley's response became one of the most cited pieces in startup strategy: Damodaran's core assumptions were off by "a factor of 25 times, perhaps even more."
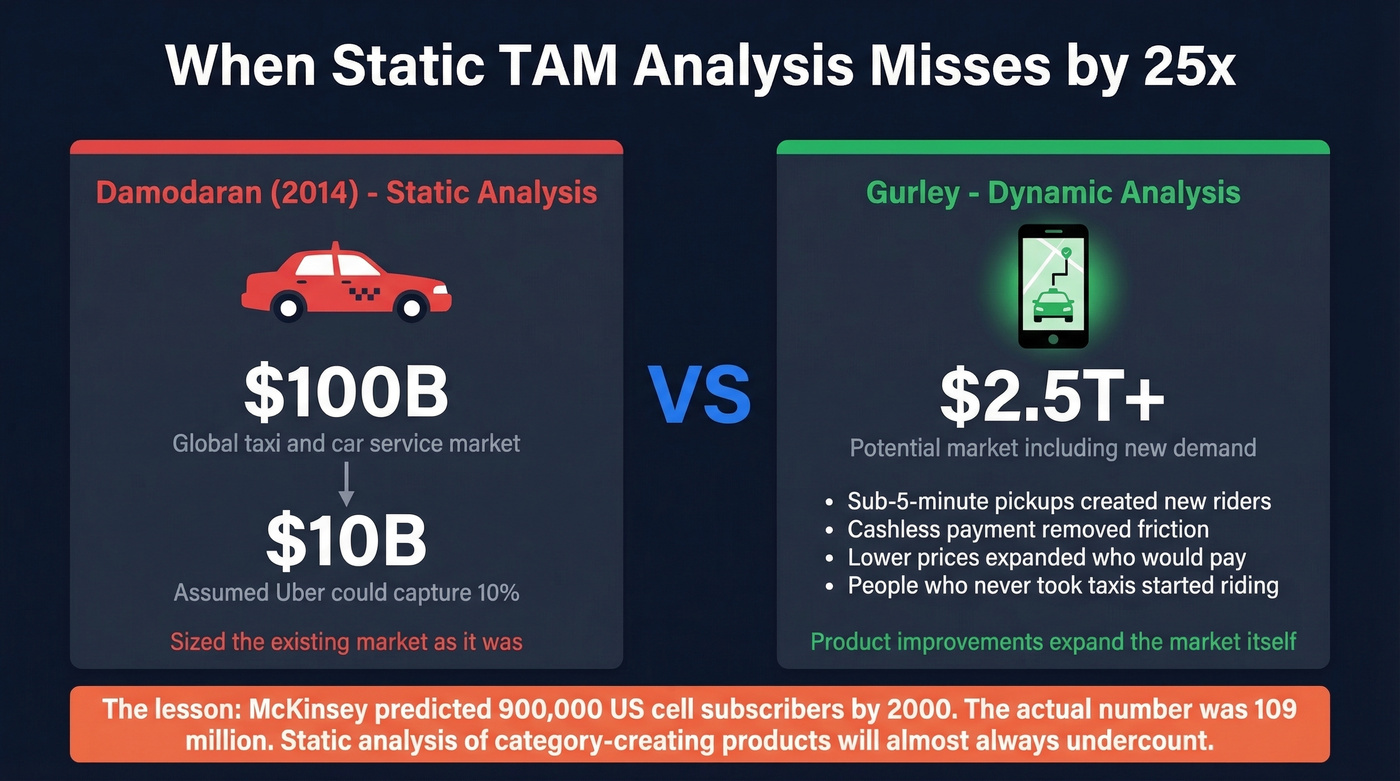
Gurley's critique wasn't about the math. It was about the mental model. Damodaran sized the existing taxi market. Gurley argued that Uber's product improvements - sub-5-minute pickups, cashless payment, a dual-rating system - would expand the market itself. People who never took taxis would start taking Uber.
This isn't a one-off. McKinsey famously forecast 900,000 US cellular subscribers by 2000. The actual number was 109 million. The lesson: when you size a category-creating product, static analysis based on existing behavior will almost always undercount. Your TAM is a hypothesis, not a fact. The best analyses acknowledge this and build in mechanisms to update as the market evolves.
TAM Mistakes That Kill Your Strategy
Here's the thing - bad TAM math doesn't just lose you a pitch. It warps your entire go-to-market strategy. These are the mistakes we've seen sink the most pitch decks and strategy docs:
Using only top-down without bottom-up validation. An analyst number gives you a ceiling, not a strategy. Without account counts, you can't build territory plans or set quotas.
Ignoring competition and nicheness. An "AI-driven CRM" startup sizing TAM against the entire CRM market is lying to itself. Your addressable market is the slice where your differentiation matters.
Treating TAM as static. Markets expand, compress, and fragment. A TAM calculated in early 2026 will be off by 2-5x by year-end in fast-moving categories. Revisit quarterly.
Conflating TAM with revenue opportunity. TAM is a theoretical ceiling. It doesn't account for churn, sales cycles, or competitive losses.
The "we only need 1%" framing. Skip this entirely. It signals you haven't identified your beachhead customers or built a credible path from SOM to SAM.
How AI Changes Your TAM in 2026
Before you finalize your TAM, run it through four questions that didn't exist three years ago.
AI can expand your market. If automation makes your product accessible to smaller buyers who couldn't afford the manual version, your addressable account count could be 10-100x larger than traditional sizing suggests. Adoption curves that used to take 5-7 years are compressing to 12-18 months.
Watch for compression. If AI commoditizes what you sell - basic content generation, simple data entry, standard reporting - willingness to pay drops and your TAM shrinks.
New buyer personas are emerging. Chief AI Officer, MLOps lead, AI Ethics & Compliance - these roles are showing up as companies operationalize AI. If they're your buyers, traditional firmographic filters won't capture them without updating your ICP.
Geography used to be a constraint. AI-powered translation and localization can turn a US-only product into a global one fast. If you're still sizing TAM by domestic accounts only, you're probably underselling the opportunity.
Let's be honest: if your average deal is under $15K and you're selling to SMBs, AI is about to blow your TAM wide open - but it's also about to create five new competitors who use AI to build what you spent two years building. Size the market, but move fast.
Your TAM from January is already wrong by July. Build a quarterly review into your board prep - update account counts, refresh ACV assumptions, and check whether AI has expanded or compressed your addressable market since last quarter.
FAQ
What is a good TAM for a startup?
Venture-scale TAMs are typically $1B+ for VC-backed startups, but a defensible $500M TAM built bottom-up beats an inflated $10B number pulled from a headline. Investors care about methodology, not magnitude. Seed-stage companies can get away with smaller TAMs if the expansion path is clear.
What's the difference between TAM, SAM, and SOM?
TAM is the total revenue if you captured 100% of the market. SAM is the slice you can realistically serve with your current product and geography. SOM is the portion you can capture in 2-3 years given your resources and competition. Each layer forces increasing honesty about what you can actually win.
How do you calculate TAM for a SaaS company?
Define your ICP, count addressable accounts using firmographic filters, then multiply by your average annual contract value. Validate against one top-down analyst estimate. If the two numbers diverge by more than 3x, revisit your assumptions.
What free data sources work for TAM sizing?
US Census Bureau for business counts by NAICS code, BLS for employment by role and industry, SEC filings for public company revenue benchmarks, and UN Data for global population and trade stats - all free. Pair them with a B2B database's free tier for ICP-filtered account counts to bridge the gap between macro data and your specific segment.
How often should you update your TAM?
Quarterly if your market is shifting due to AI, regulation, or new competitors. Annually at minimum. Your assumptions from 12 months ago are already stale, especially in fast-moving categories where adoption curves are compressing from years to months.