How to Measure and Improve Lead Generation Quality
You're pulling 500 leads a week from your database, running them through sequences, and watching reply rates flatline at 2%. The problem isn't volume. It's that half those leads have wrong titles, stale emails, or zero buying intent.
Lead generation quality is the gap between "leads in the CRM" and "leads that actually convert," and most teams don't have a framework for closing it. We've watched this play out dozens of times - a team celebrates hitting their MQL target while pipeline stays flat, and nobody connects the dots until the quarter's already gone.
The r/sales threads capture this tension well. One poster said they'd rather have correct contact names and titles than "just a stack of phone numbers to call." Another nailed the filter-fatigue problem - teams using ZoomInfo, Apollo, and Sales Navigator still spend hours tweaking filters, "hoping we're not missing out on good prospects." The tools expect you to already know the perfect criteria, but the real goal is finding leads that turn into revenue.
Two Dimensions Most Teams Miss
Lead quality isn't one thing. It's two.
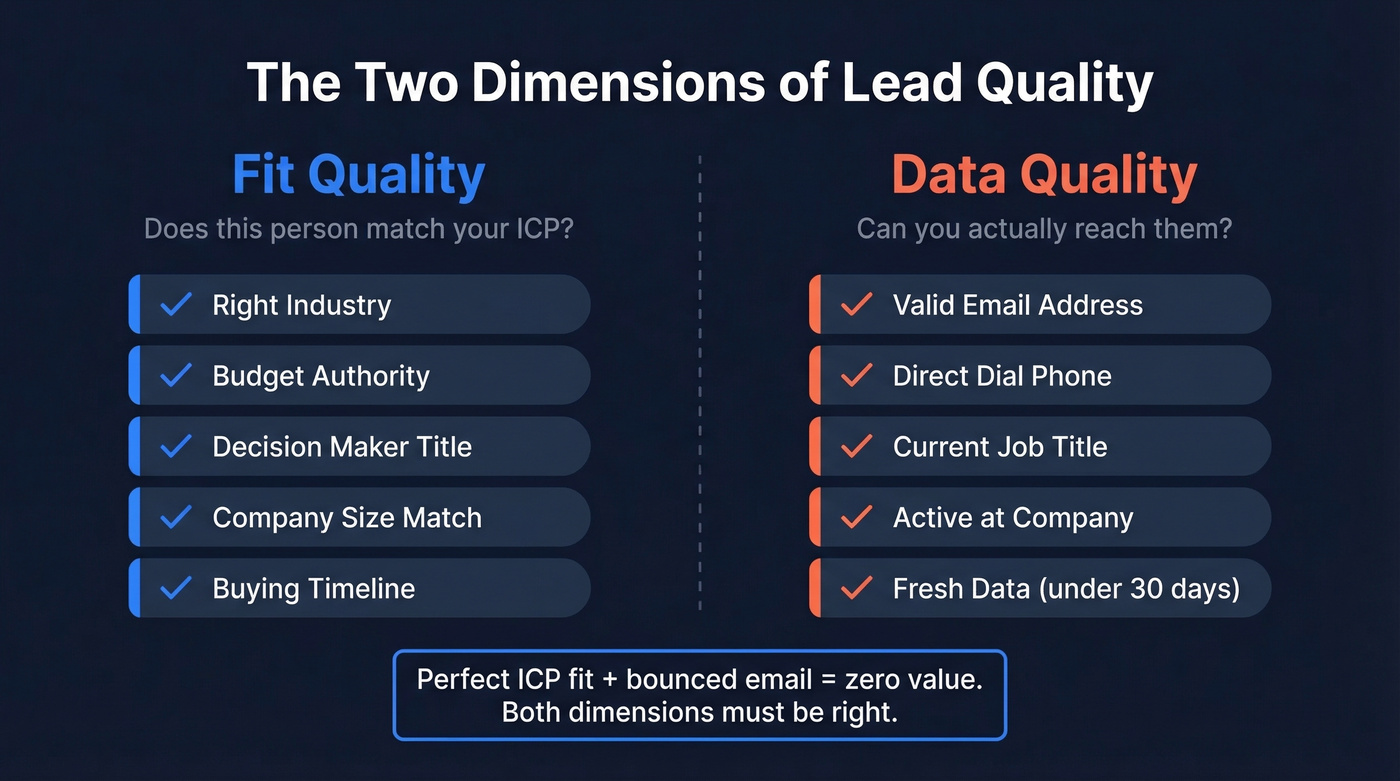
Fit quality is what marketers usually mean: does this person match your ICP? Do they have budget, authority, need, and timeline? Are they in the right industry, role, and company size?
Data quality is what sales teams actually feel: is the email valid? Is the phone number a direct dial or a switchboard? Is the job title current, or did this person change roles six months ago? You can have a perfect ICP match that's completely unreachable because the underlying contact data is stale.
Most lead quality conversations focus exclusively on fit. That's a mistake. A lead with perfect ICP fit and a bounced email is worth zero. Both dimensions have to be right.
The Cost of Getting It Wrong
Sales reps spend nearly 50% of their time on unproductive prospecting. That's not a rounding error - that's half your headcount cost going to waste.
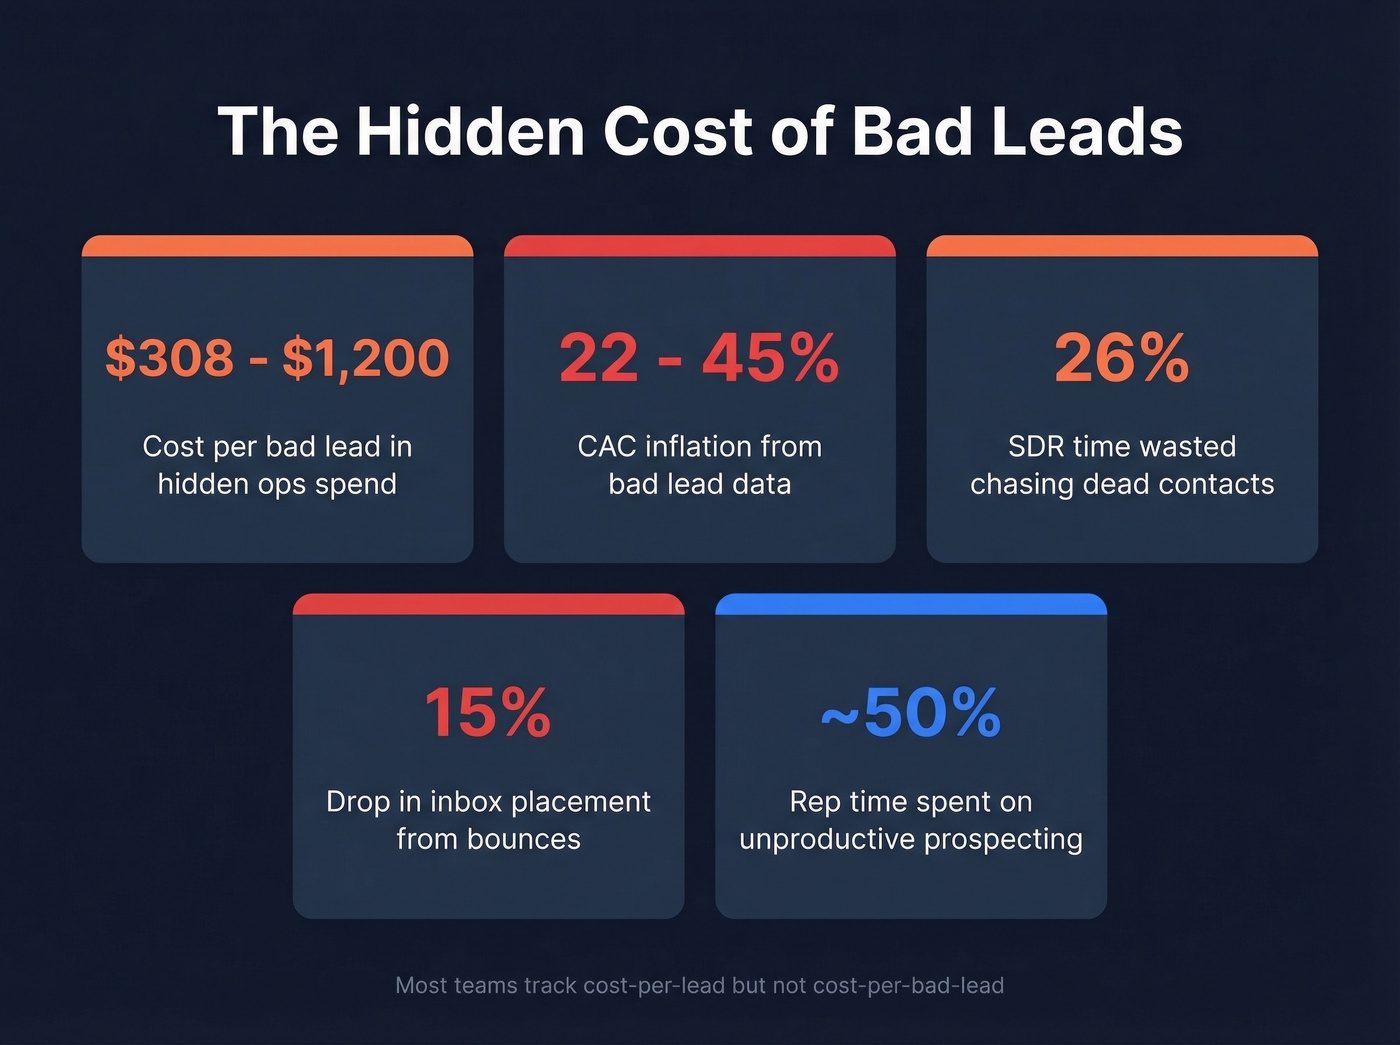
The downstream math gets worse. A single bad lead wastes $308-$1,200 in hidden operational cost when you add up SDR time, CRM processing, automation scoring, and follow-up sequences that go nowhere. Bad leads inflate CAC by 22-45%, and SDRs burn roughly 26% of their time chasing contacts that will never convert. Then there's domain reputation damage - send enough emails to invalid addresses and your deliverability tanks, with inbox placement dropping by up to 15%. That doesn't just hurt the bad leads. It hurts every email you send, including the ones going to perfect-fit prospects.
Here's the thing: most teams track cost-per-lead but not cost-per-bad-lead. They celebrate a $15 CPL without realizing that 40% of those leads are unworkable, making the real cost-per-qualified-lead closer to $25.
Benchmarks Worth Knowing
Benchmarks give you a baseline. If you're below these numbers, you've got a quality problem - not just a volume problem.
Lead-to-MQL by Channel
| Channel | Lead-to-MQL Rate |
|---|---|
| Client referrals | 56% |
| Executive events | 54% |
| SEO | 41% |
| Email marketing | 38% |
| Social media | 30% |
| PPC | 29% |
| Conferences | 28% |
| Trade shows | 24% |
| Podcasts | 21% |
| Webinars | 19% |
Source: FirstPageSage benchmarks, 10-year dataset.
The cross-industry average is 31%. B2B SaaS and cybersecurity convert at 39%, biotech at 42%, while construction lags at 17%. If you're running paid campaigns at 15% lead-to-MQL, your targeting or your landing page qualification is broken.
MQL-to-SQL by Industry
| Industry | MQL-to-SQL Rate |
|---|---|
| Consumer Electronics | 21% |
| FinTech | 19% |
| Automotive | 18% |
| Aerospace & Aviation | 17% |
| Cybersecurity (SMB) | 15-18% |
| Biotech | 14% |
| Healthcare | 13% |
| Oil & Gas | 12% |
Source: Data-Mania 2026 benchmarks.
One stat that doesn't get enough attention: follow-up within the first hour increases conversion rates to 53%. Speed-to-lead is a quality multiplier. A great lead that sits untouched for 48 hours is a dead lead.
For the rest of the funnel, B2B ranges run 10-20% SQL-to-opportunity and 15-30% opportunity-to-won. If your SQL-to-won rate is below 10%, the problem is almost certainly upstream.
How to Build a Lead Scoring Model
Scoring is how you operationalize lead quality. Without it, "quality" is just a feeling. With it, you've got a number that sales and marketing can argue about productively.
Pick Your Criteria
Start by analyzing your last 10-20 closed-won deals with sales and marketing in the same room. Look for patterns in role, company size, industry, and the behaviors that preceded the deal. Build a model with positive and negative signals:
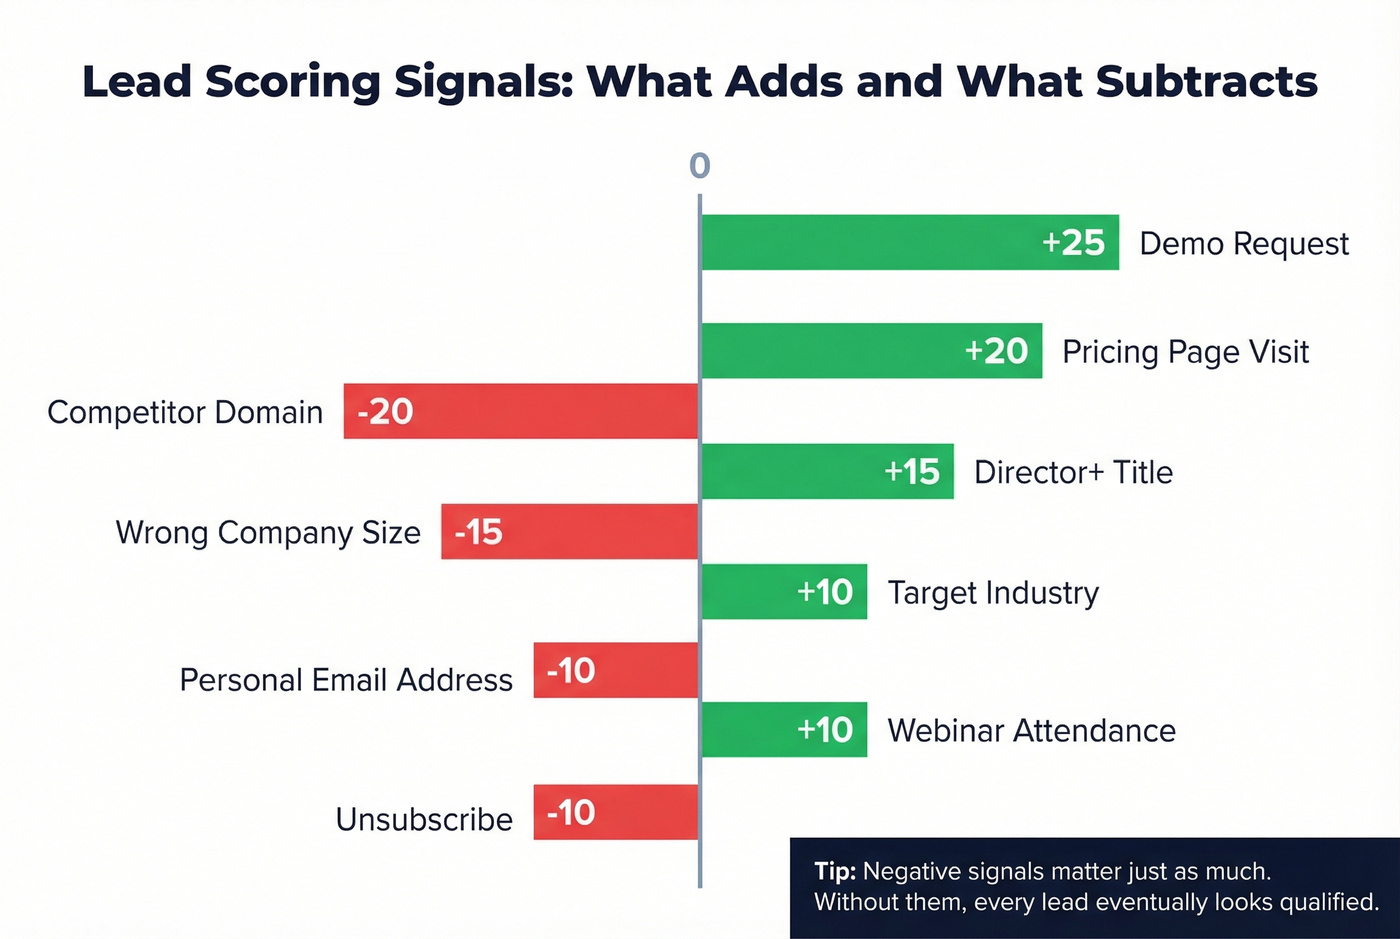
- Positive: Demo request (+25), pricing page visit (+20), director+ title (+15), target industry (+10), webinar attendance (+10)
- Negative: Personal email address (-10), competitor domain (-20), wrong company size (-15), unsubscribe (-10)
The negative signals matter as much as the positive ones. We've seen teams where scores only go up, which means every lead eventually looks "qualified" if they stick around long enough. That defeats the purpose.
Thresholds and Decay
Set your MQL threshold to capture the top 20% of leads by score. On a 100-point scale, that typically lands around 50-75 points, yielding 15-25% conversion rates from qualified leads to closed deals.
You also need score decay. A lead who downloaded a whitepaper six months ago and went silent isn't the same as one who visited your pricing page yesterday. Subtract about 5 points per 30 days of inactivity, or use a percentage decay like 25% monthly reduction. This keeps your pipeline honest and prevents stale leads from clogging the queue.
Predictive Scoring
Rules-based models work, but they hit a ceiling. Predictive scoring uses machine learning to analyze your closed-won data and surface patterns humans miss - combinations of firmographic, behavioral, and intent signals that correlate with revenue. The biggest advantage is that predictive models self-correct as your data changes, while rules-based models rot unless someone manually updates them every quarter.
Skip predictive scoring if your deal size is under $15k and your sales cycle is under 30 days. A simple rules-based model with 5-7 signals and proper decay will get you 80% of the way there. Save the ML budget for hiring another SDR.
Mistakes That Break Scoring
The most common failure mode is score inflation. Rules-based scores spiral into the thousands, making them impossible to interpret. A lead at 2,847 points doesn't mean anything to a rep - use a relative 0-100 scale where scores stay contextual to your database.
Black-box algorithms are the second trap. Automated scoring tools can become opaque, and nobody can explain why a lead scored 85 vs. 60. Sales loses trust in the system fast. The third mistake is skipping negative scoring entirely. If competitor employees, students, and wrong-size companies can accumulate points without penalty, your MQL list will be full of noise.
You just read that bad leads cost $308-$1,200 each in hidden costs. Prospeo's 5-step verification and 7-day data refresh cycle eliminate the stale emails and wrong titles that tank your lead quality. 98% email accuracy means under 4% bounce rates - not the 35%+ teams see with other providers.
Stop scoring leads that were dead before they hit your CRM.
The Data Freshness Problem
This is where most lead quality guides stop - and where the real gains are. You can build a perfect scoring model, nail your ICP definition, and still watch campaigns fail because the underlying contact data is stale.
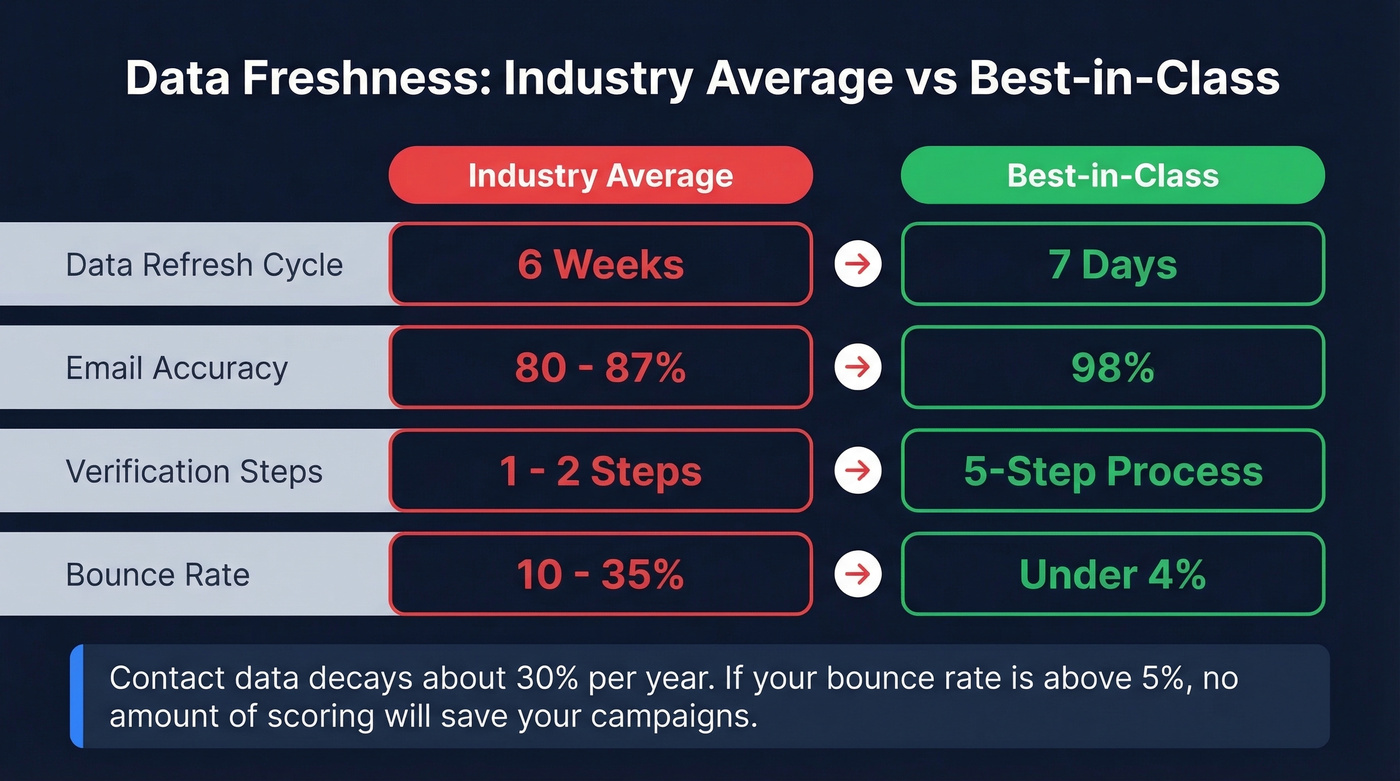
Contact data decays around 30% per year. People change jobs, get promoted, switch companies, update email addresses. The industry average refresh cycle is six weeks, which means by the time you're emailing a list, a meaningful percentage of contacts have already moved on.
| Factor | Industry Avg | Best-in-Class |
|---|---|---|
| Data refresh | 6 weeks | 7 days |
| Email accuracy | ~80-87% | 98% |
| Verification steps | 1-2 | 5-step |
| Bounce rate impact | 10-35% | Under 4% |
Prospeo's 7-day refresh cycle and 5-step verification process - including catch-all handling, spam-trap removal, and honeypot filtering - deliver 98% email accuracy across 143M+ verified addresses. Meritt, an agency running outbound at scale, saw their bounce rate drop from 35% to under 4% after switching. That's the difference between a healthy sending domain and one headed for the spam folder.
If your bounce rate is above 5%, no amount of scoring sophistication will save your campaigns. The infrastructure layer - fresh, verified data - is the foundation everything else sits on.
Seven Common Failure Modes
When lead quality breaks down, it's usually one of these problems. Diagnose before you prescribe.
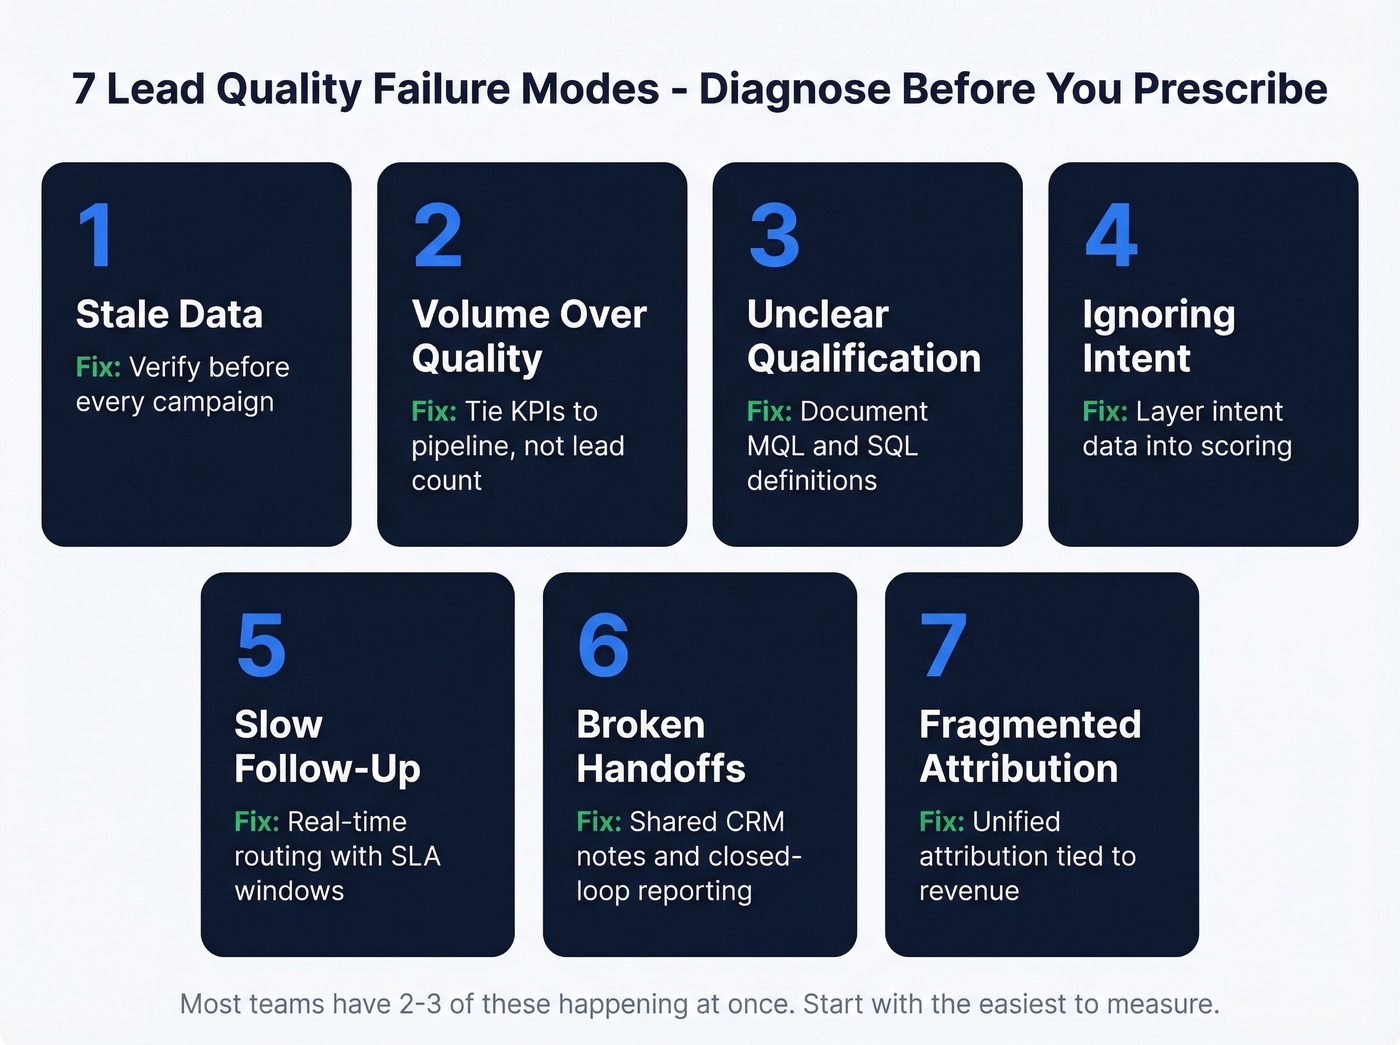
- Stale or missing data. Contacts have changed roles, emails bounce, phone numbers ring out. Fix: verify before every campaign, not once at import.
- Volume-over-quality culture. Marketing gets measured on MQLs, so they optimize for volume. Fix: tie marketing KPIs to SQL and pipeline, not lead count.
- Unclear qualification criteria. Sales and marketing use different definitions of "qualified." Fix: document MQL and SQL definitions in writing and review quarterly.
- Ignoring intent signals. You're scoring on fit alone without factoring in buying behavior. Fix: layer first-party and third-party intent data into scoring.
- Slow follow-up. High-intent leads sit in a queue for 48+ hours. Fix: route hot leads in real time with SLA-backed response windows.
- Broken handoffs. Marketing passes leads to SDRs who pass to AEs, and context evaporates at each step. Fix: shared CRM notes, standardized handoff fields, and closed-loop reporting.
- Fragmented attribution. You can't tell which channels produce quality because tracking is broken across tools. Fix: unified attribution tied to revenue, not just first touch.
Most teams have two or three of these happening simultaneously. Start with the one that's easiest to measure - usually bounce rate or speed-to-lead - and work outward.
The Sales-Marketing Feedback Loop
Lead quality isn't a marketing problem or a sales problem. It's an alignment problem.
87% of sales and marketing leaders say collaboration between the two teams enables critical business growth, and companies with strong lead nurturing programs see a 20% increase in sales opportunities. The operational playbook is straightforward: document what MQL and SQL mean before you generate a single lead, then build your ICP from closed-won patterns - firmographic, technographic, and behavioral signals that actually predicted revenue, not the ones that sounded good in a planning meeting.
Establish a cadence. Weekly meetings between sales and marketing to review lead quality, disposition data, and pipeline movement. Monthly reviews to adjust scoring thresholds. Quarterly planning to revisit ICP definitions based on new win/loss data.
The most common misalignment symptom we see: sales ignores marketing leads and builds their own lists. If that's happening, it's not a sales discipline problem - it's a signal that marketing isn't delivering leads worth working. Fix the quality, and adoption follows.
Three Levers for 2026
Let's break down what's actually changing the game for teams focused on lead generation quality this year.
Intent data matters most in high-ticket B2B, where content-driven lead gen alone falls short. The Reddit consensus is clear: content marketing works for low-cost B2C products but struggles for enterprise deals with 6-person buying committees and 9-month cycles. First-party intent tells you who's already interacting with your brand. Third-party intent tells you who's in-market before they ever visit your site. Layer both into scoring rather than treating them as standalone qualifiers.
Technographic and job-change signals add context that firmographics miss. A company that just adopted a competitor's tool is a different conversation than one with no solution in place. A VP who started a new role 90 days ago has budget and mandate to make changes - these signals separate "fits the ICP" from "fits the ICP and is likely to buy right now." ABM-focused teams should weight these fit signals more heavily and score at the account level, not just the contact level.
Real-time verification closes the data quality gap. When you can identify in-market buyers and confirm their contact data is valid in the same motion - fit, intent, and data accuracy working together - that's how you consistently produce high-quality leads instead of bloated lists that waste rep time.
Your scoring model is only as good as the data underneath it. A perfect ICP match with a bounced email scores high and converts at zero. Prospeo delivers 50+ enrichment data points per contact at 92% match rates - fresh titles, verified emails, direct dials - so your scores reflect reality, not six-month-old records.
Feed your lead scoring model data that's actually current - refreshed every 7 days.
FAQ
What's the difference between lead quality and lead scoring?
Lead quality is the outcome - how well a lead matches your ICP, how accurate their contact data is, and how likely they are to convert. Lead scoring is one method to measure it, assigning numerical values to fit and behavior signals. You can have a scoring model and still have poor lead quality if the underlying data is stale or the criteria are wrong.
What's a good lead-to-MQL conversion rate?
The cross-industry average is 31%. Client referrals convert at 56%, SEO at 41%, PPC at 29%. If you're significantly below your channel's benchmark, your targeting is off or your qualification criteria need tightening.
How often should contact data be refreshed?
Contact data decays around 30% per year, and the industry average refresh cycle is six weeks. Best-in-class teams refresh weekly. That's the standard to aim for if you want bounce rates under 5% and healthy domain reputation.
How do I know if my quality problem is really a data problem?
Check your email bounce rate first - above 5% means stale or unverified contacts. Second signal: are reps manually researching leads before outreach? If SDRs spend 20 minutes per lead verifying titles and finding direct emails, your data infrastructure is failing them. Fixing this foundation is the fastest path to higher conversions.