Net Revenue Churn: The SaaS Metric You're Probably Measuring Wrong
A RevOps lead we know reported 120% NRR to the board last quarter. Impressive - until you dug in and realized one customer had expanded from $50k to $300k ARR. The other 47 customers in the cohort were retaining at 95%. That's not a healthy business. That's concentration risk dressed up as a growth metric.
Net revenue churn is one of the best indicators of whether your existing customer base is growing or shrinking. But most SaaS teams measure it wrong, benchmark it against the wrong peers, or conflate it with three other metrics that sound identical but aren't. Let's fix all of that.
The formula: (Contraction + Cancellation - Expansion - Reactivation) / Starting MRR
The NRR inverse: NRR of 110% = net MRR churn of -10%. Same dynamics, opposite direction.
The benchmark: Median monthly net MRR churn drops from 6.2% at sub-$300k ARR to 1.8% at $15-30M ARR.
What Is Net Revenue Churn?
Net revenue churn measures the percentage of recurring revenue lost from your existing customer base in a given period - after accounting for expansion revenue from those same customers. It's fundamentally different from logo churn, which counts customers lost, or gross revenue churn, which ignores expansion entirely.
The reason investors obsess over this metric is simple: it tells you whether your installed base is a growth engine or a leaky bucket. A company with negative net revenue churn can grow without adding a single new customer. That's why NRR shows up in every SaaS board deck and every PE due diligence checklist.
Here's the critical nuance: this metric can go negative. When expansion revenue from existing customers exceeds contraction and cancellation, you're in "negative churn" territory - and that's exactly where you want to be.
Formula + Worked Examples
The standard net MRR churn formula:
Net MRR Churn Rate = (Contraction MRR + Cancellation MRR - Expansion MRR - Reactivation MRR) / Starting MRR
Example 1 - Positive churn (bad): You start the month with $100k MRR. You lose $5k to cancellations, $3k to downgrades, gain $2k from upsells, and $500 from a reactivation. Net MRR churn = ($3k + $5k - $2k - $0.5k) / $100k = 5.5%. You're shrinking.
Example 2 - Negative churn (good): Same $100k starting MRR. You lose $3k to cancellations, $1k to downgrades, but gain $7k from expansions and $500 from reactivations. Net MRR churn = ($1k + $3k - $7k - $0.5k) / $100k = -3.5%. Your existing base grew by 3.5% without a single new logo.
The sign tells the whole story. Positive means you're losing ground. Negative means your customers are worth more every month.
Gross vs. Net Revenue Churn
These two metrics look similar but answer very different questions:
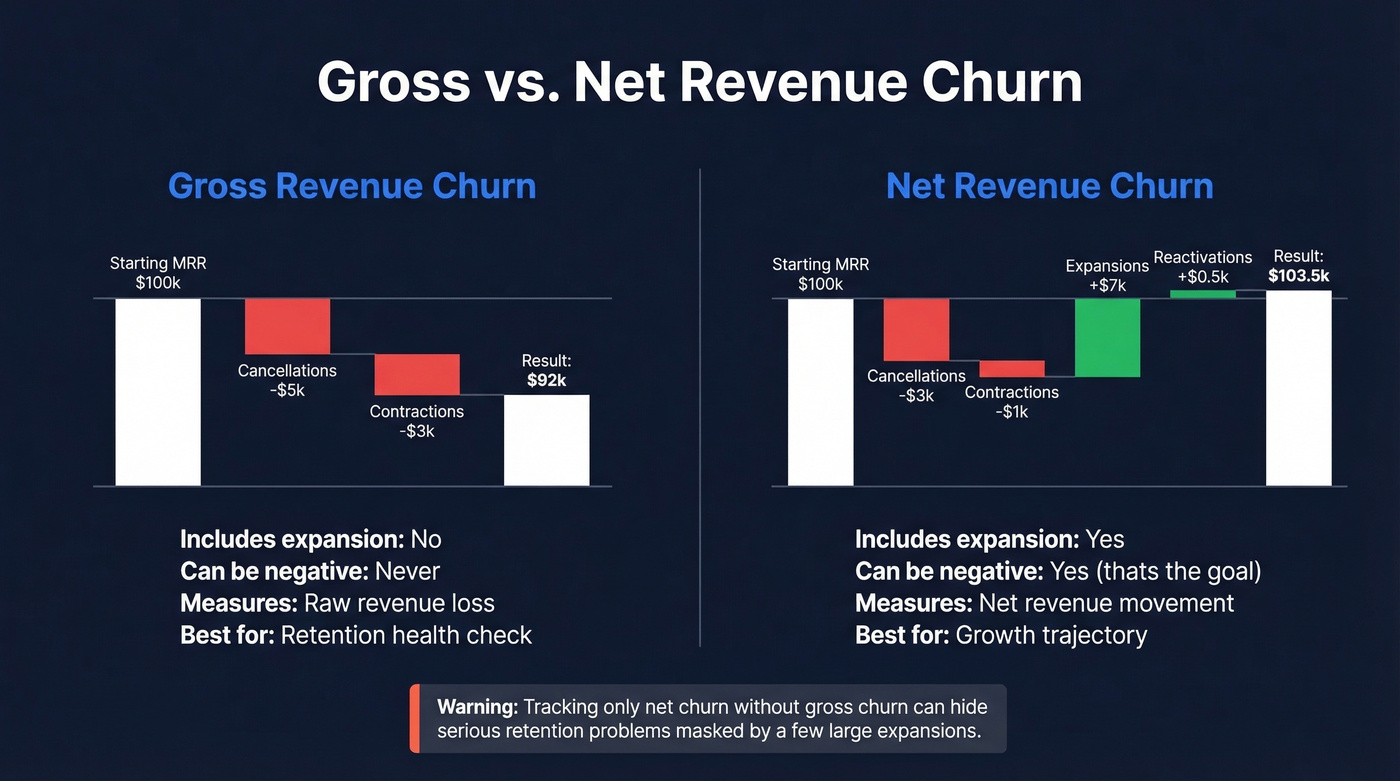
| Gross Revenue Churn | Net Revenue Churn | |
|---|---|---|
| Includes expansion | No | Yes |
| Can be negative | Never | Yes (negative churn) |
| What it measures | Raw revenue loss | Net revenue movement |
| Best for | Retention health | Growth trajectory |
Here's the thing: if you're only tracking net churn without gross churn, you're lying to yourself. A company can show -2% net churn while losing 8% of revenue to cancellations - the expansion from a few large accounts just masks the bleeding. You need both numbers.
NRR vs. NDR vs. Net MRR Churn
The fact that every SaaS glossary defines these differently is maddening.
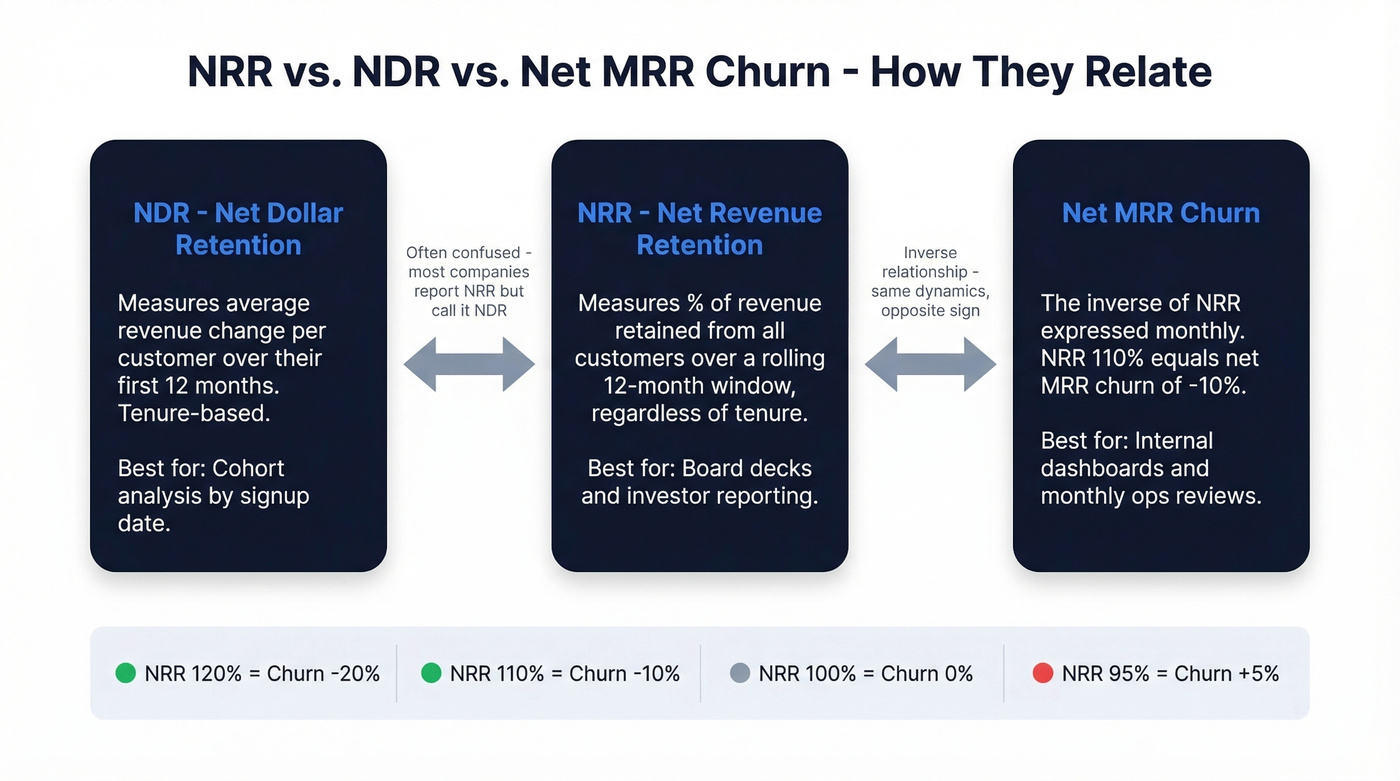
Seth Levine's framework draws the cleanest line. NDR (Net Dollar Retention) measures the average percentage change in revenue over a customer's first 12 months - it's tenure-based. NRR (Net Revenue Retention) measures the percentage of revenue retained from all customers over a rolling 12-month window, regardless of tenure. In practice, most companies report NRR but call it NDR, which creates endless confusion.
The inverse mapping between NRR and net MRR churn is straightforward:
- NRR 110% = Net MRR churn of -10%
- NRR 95% = Net MRR churn of +5%
They describe the same underlying dynamics from opposite perspectives. NRR is the investor-facing metric - it sounds better to say "we retain 115% of revenue" than "our net churn is negative 15%." Net MRR churn is the operational metric, the one your RevOps team tracks monthly to spot problems early. Use NRR in board decks. Use net MRR churn in your internal dashboards.
Expansion revenue drives negative churn - but only if your sales team is talking to real decision-makers. Prospeo's 300M+ profiles with 98% email accuracy and 30+ intent filters help you identify upsell-ready accounts before they churn.
Stop masking churn with lucky expansions. Build a repeatable upsell engine.
2026 Benchmarks by Stage
Benchmarks only matter if you're comparing against the right peer group. SaaS Capital's research makes a strong case that ACV is the best starting point for benchmarking retention - more informative than company age, revenue, or industry for private B2B SaaS. For the ACV $25k-$50k band, median NRR sits at 102%, top quartile at 111%, and bottom quartile at 97%.
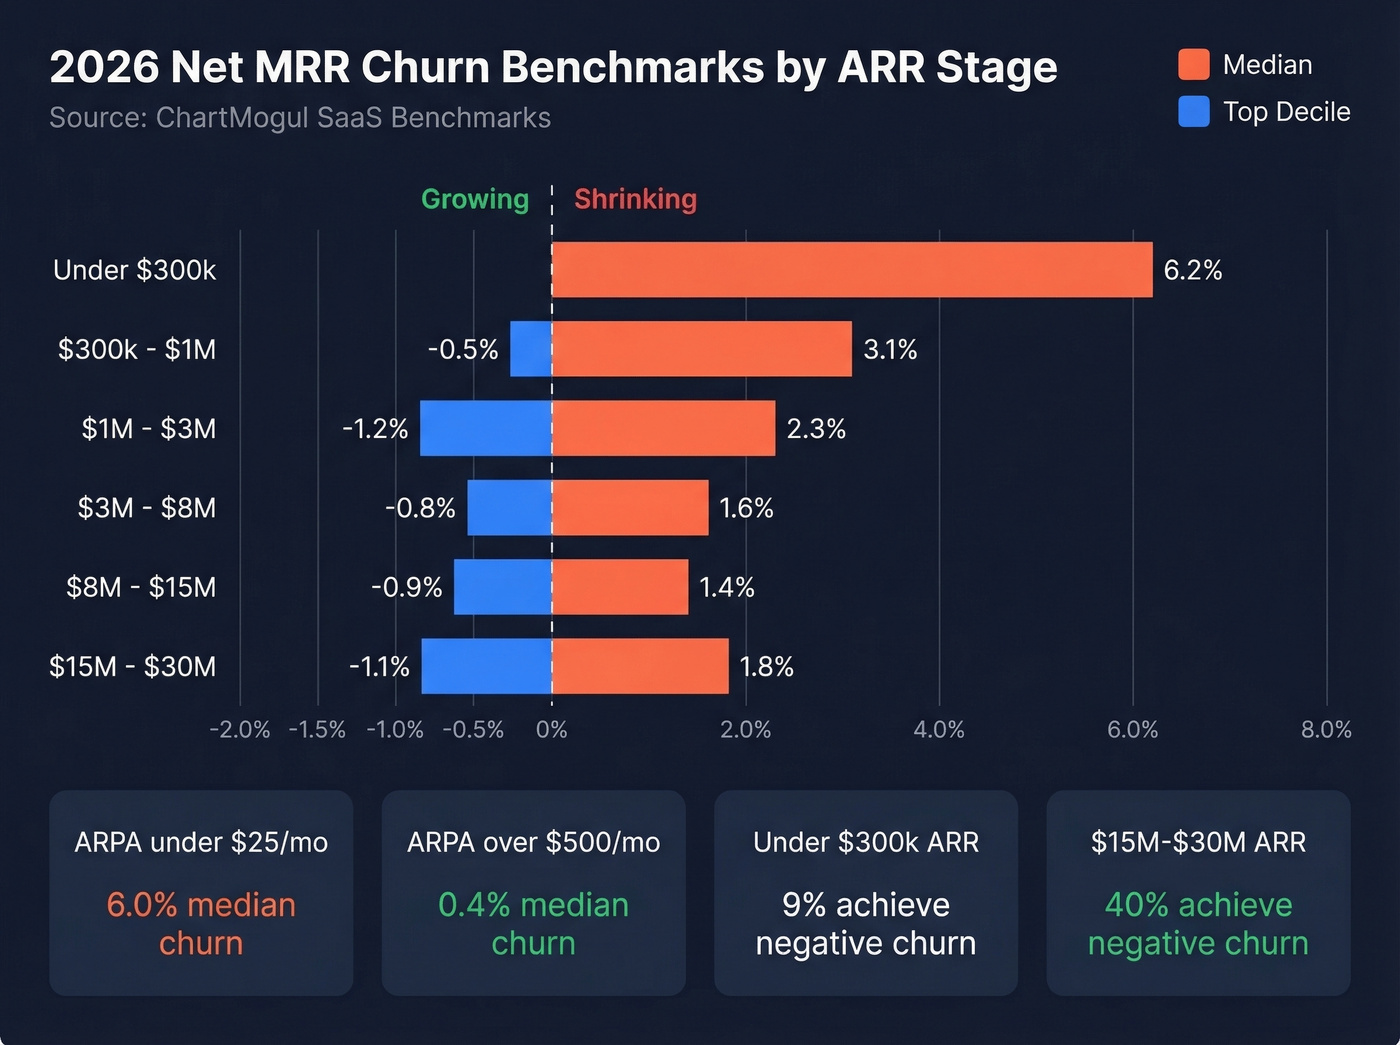
For stage-based benchmarks, ChartMogul's data is the most granular:
| ARR Range | Median Net MRR Churn | Top Decile |
|---|---|---|
| <$300k | ~6.2% | ~0% |
| $300k-$1M | ~3.1% | ~-0.5% |
| $1M-$3M | ~2.3% | ~-1.2% |
| $3M-$8M | ~1.6% | ~-0.8% |
| $8M-$15M | ~1.4% | ~-0.9% |
| $15M-$30M | ~1.8% | ~-1.1% |
The ARPA dimension matters too. Companies with ARPA under $25/mo see median net churn of 6.0%. At ARPA above $500/mo, that drops to roughly 0.4%. Higher contract values correlate with stickier customers - no surprise there.
What's more telling is the negative churn prevalence by ARR: only 9% of companies under $300k ARR achieve negative churn, rising to 19% at $1-3M, 26% at $8-15M, and 40% at $15-30M. Negative churn isn't magic - it's a sign your expansion motion works. And it takes time and scale to build one.
The Valuation Impact
This isn't abstract. It's the difference between a ~$31M and a ~$93M valuation at the same revenue.
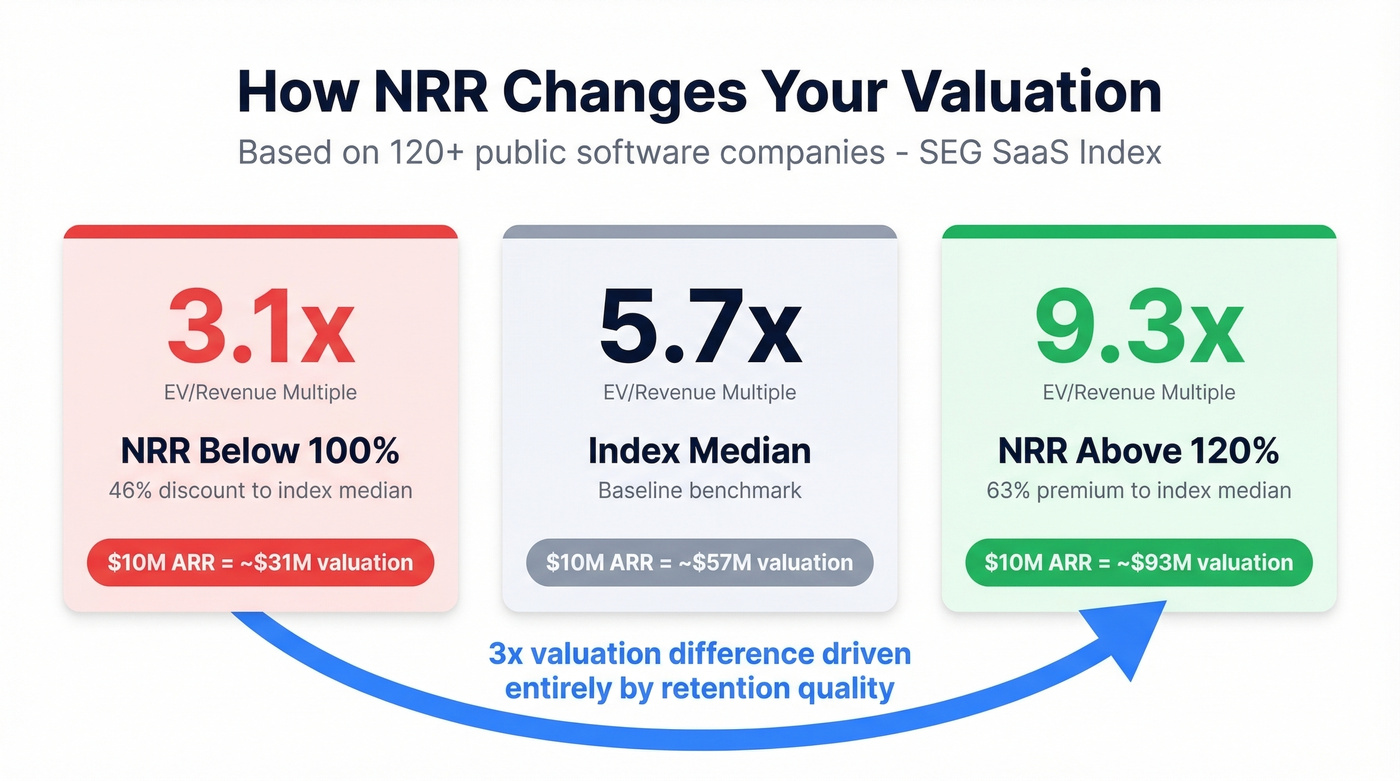
The SEG SaaS Index analyzed 120+ public software companies and found a stark valuation gap by NRR bucket. Companies with NRR below 100% traded at a median 3.1x EV/TTM revenue - a 46% discount to the overall index median of 5.7x. Companies with NRR above 120% traded at 9.3x - a 63% premium.
Put dollar signs on it: a $10M ARR company with sub-100% NRR is worth roughly $31M. The same revenue with 120%+ NRR? About $93M. That's a 3x difference driven entirely by retention quality. If your CFO doesn't care about net revenue churn, show them these multiples.
Our take: Most SaaS companies under $3M ARR shouldn't obsess over NRR at all. At that stage, your sample sizes are too small, one contract skews everything, and your time is better spent on product-market fit than retention engineering. Once you cross $3M and have 100+ customers, this becomes the metric that matters most.
How to Measure It Correctly
Getting the formula right is step one. Getting the inputs right is where most teams fail.
Compute per-customer first, then aggregate. SaaS Capital's methodology guidance is clear: calculate retention at the individual customer level before rolling up. Otherwise, expanding customers mask churning ones, and you end up with the exact concentration-risk problem we described at the top of this article.
Use month-over-year-ago-month. Compare each month's retained revenue to the same month 12 months prior. This avoids the volatility of annualizing a single month's churn rate.
Get the denominator timing right. A common mistake - flagged by Ordergroove - is dividing cancellations by the current period's subscriber base instead of the prior period's base. Their example shows this can materially understate churn, turning a 9% rate into a reported 6%.
Report median alongside average, and segment by customer size. We've seen this play out repeatedly: a blended NRR of 120% that's driven by one whale while the rest of the cohort sits at 95%. The consensus on r/SaaS backs this up - one blended number hides more than it reveals. Segment by customer size, channel, and use case.
How to Reduce Net Revenue Churn
Reducing this metric isn't one lever - it's four, and they compound.
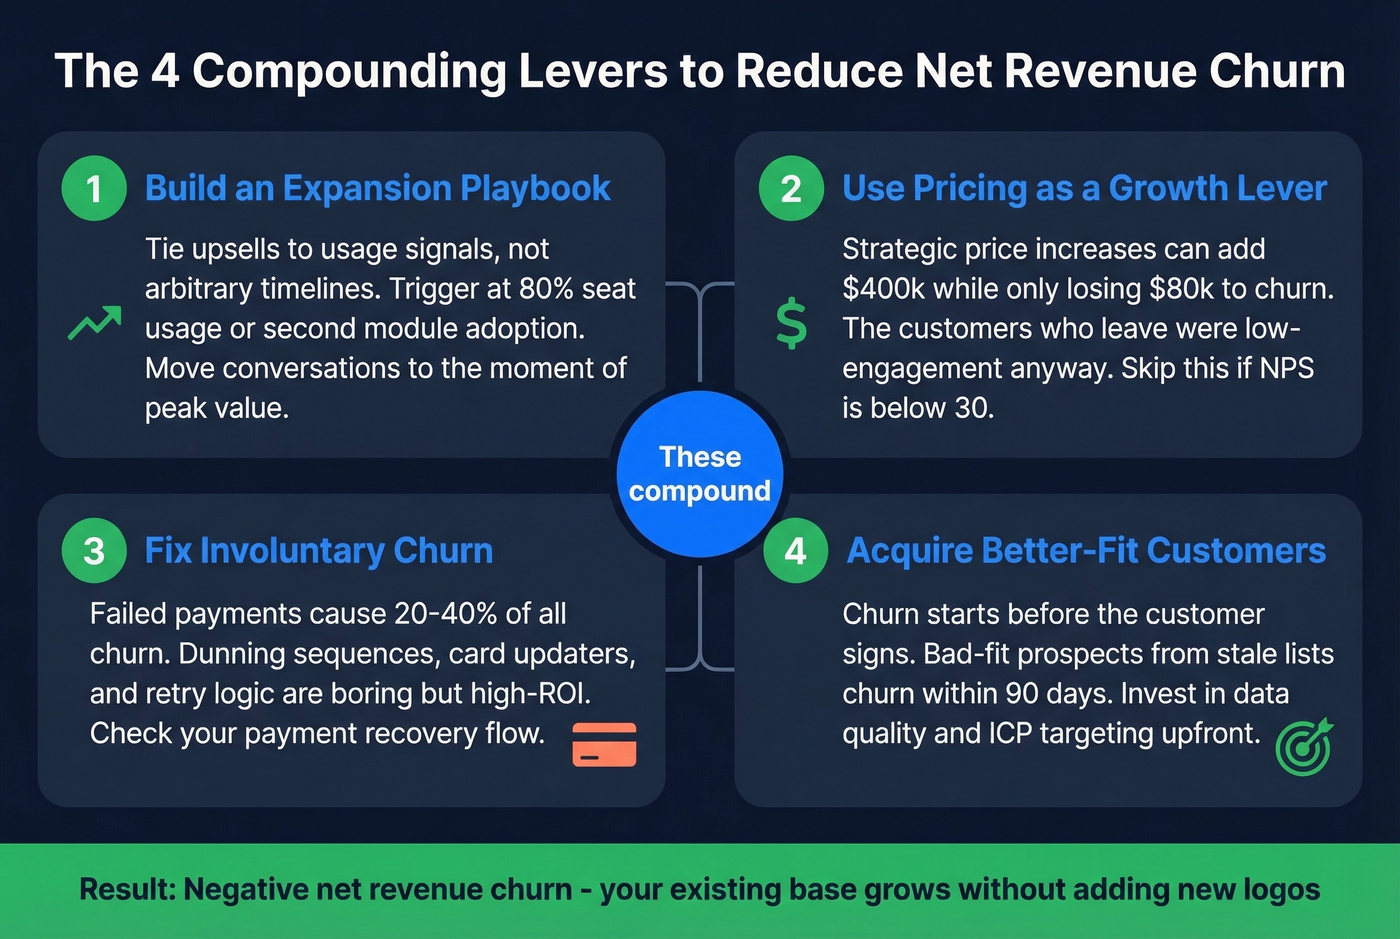
Build an Expansion Playbook
Upsells and cross-sells are the fastest path to negative churn. The key is tying expansion motions to usage signals, not arbitrary timelines. When a customer hits 80% of their seat limit, that's an expansion trigger. When they adopt a second product module, that's a cross-sell signal. Build these into your CS workflows so expansion conversations happen at the moment of maximum value perception, not during a scheduled QBR three months later.
Use Pricing as a Growth Lever
A Reddit case study illustrates this perfectly: a 35% price increase for new customers and 20% at renewal pushed monthly churn from 4.5% to 6.5%, costing roughly $80k. But the price increase added $400k in new revenue, driving 28% YoY growth. The customers who churned were disproportionately low-engagement - the ones who stayed signaled stronger value perception.
Skip this approach if you're pre-PMF or your NPS is below 30. Raising prices on unhappy customers just accelerates the inevitable.
Fix Involuntary Churn
Failed payments and expired cards account for 20-40% of all churn in many SaaS businesses. Dunning sequences, card updater services, and retry logic are boring infrastructure work, but they're high-ROI. If you haven't optimized your payment recovery flow in the last 12 months, you're leaving revenue on the table.
Acquire Better-Fit Customers
Look, churn starts before the customer signs. If your outbound team is working stale lists with bad emails, they're booking demos with whoever responds - not whoever fits. Those misfit customers churn within 90 days, and they drag your revenue retention numbers down every quarter. This is where data quality becomes a retention lever. Tools like Prospeo, with 98% email accuracy and a 7-day data refresh cycle, help reps spend time on prospects who actually match your ICP instead of chasing dead leads that convert into short-lived accounts.
Companies with NRR above 120% trade at 3x the valuation of those below 100%. The fastest path to negative net revenue churn? Reach the right stakeholders inside existing accounts. Prospeo's intent data tracks 15,000 topics so you spot expansion signals before renewal conversations.
Turn your installed base into a growth engine for $0.01 per verified email.
FAQ
Can net revenue churn be negative?
Yes - when expansion revenue from existing customers exceeds contraction and cancellation combined, the rate goes negative. 40% of SaaS companies at $15-30M ARR achieve negative churn, but only 9% of companies under $300k ARR do. It's a scale-dependent capability that requires a working expansion motion.
How do annual contracts affect the calculation?
Convert annual contracts to monthly equivalents (ARR / 12) for MRR-based churn calculations. Prorate mid-period upgrades and downgrades consistent with your revenue recognition policy. Don't annualize a single month's churn - use trailing 12-month averages instead, since one outlier month distorts the annual figure in either direction.
What's the fastest way to improve this metric?
Start upstream by targeting better-fit accounts with accurate, current contact data so your pipeline attracts customers who stick. Then build expansion motions around usage signals and tiered pricing. Fixing involuntary churn through dunning optimization is the quickest tactical win - pure recovery with zero sales effort.