Email Open Rate: The Most Overrated Metric in Email Marketing
Your CMO just pinged you about open rates dropping 8 points quarter-over-quarter. The team's scrambling to A/B test subject lines. Nobody's asking the right question: were last quarter's numbers even real?
Open rate isn't a KPI. It's context at best, noise at worst, and in 2026 it's more broken than it's ever been. We've watched teams burn entire sprints optimizing a metric that's been lying to them since 2021.
The Short Version
- Your open rate is probably inflated 20-50% by machine opens from Apple MPP and other bot activity. Gmail and Yahoo proxying also makes device and location data unreliable.
- A "good" number depends entirely on email type - automated flows crush broadcast campaigns on every engagement metric.
- The highest-leverage fix isn't your subject line. It's your list quality and deliverability.
- Track click-to-open rate, conversions, and revenue per email instead.
What Is Email Open Rate?
Open rate measures the percentage of delivered emails that recipients opened. The formula:
Open Rate = (Unique Opens / Delivered Emails) x 100
Note the denominator: delivered emails, not total subscribers. Some ESP documentation incorrectly uses "total subscribers," which would include bounced addresses and deflate your rate. Delivered means sent minus bounces.
The tracking mechanism is ancient by internet standards. Your ESP embeds a 1x1 invisible image - a tracking pixel - into each email. When a recipient's email client loads that image from the sender's server, it registers as an "open" and captures the IP address, device type, and timestamp. If the image never loads, no open is recorded, even if the person read every word. This system worked reasonably well for a decade. Then privacy happened.
Why Your Numbers Are Probably Wrong
Apple Mail Privacy Protection
Apple's Mail Privacy Protection (MPP), launched in 2021, preloads tracking pixels via Apple's proxy servers before the recipient ever sees the email. Emails delivered to recipients with MPP enabled register as "opened" - whether they read it, glanced at it, or deleted it unread.
The inflation is dramatic. One beehiiv case study showed a newsletter jumping from ~28% to 55% overnight - same audience, same content, just MPP kicking in. Depending on your audience's Apple Mail share, expect 20-50% inflation in your reported numbers.
Gmail and Yahoo Proxying
Gmail routes all images through Google Image Proxy, loading them from Google's servers rather than the sender's. Yahoo does the same. Your device and location data becomes unreliable - you can't tell if someone opened on mobile in Chicago or if an inbox provider's proxy server fetched the image.
Gmail Clipping
Gmail clips emails exceeding 102KB. When that happens, the tracking pixel at the bottom doesn't load unless the recipient clicks "View entire message." This deflates your metrics for longer emails - the opposite problem from MPP.
iOS 18 Made It Worse
Apple's iOS 18 changes piled on. AI-generated previews mean recipients can absorb your message without opening it. Inbox UX changes like categories and digest-style views affect what gets seen and when. And Link Tracking Protection strips tracking parameters (like UTMs) from links in Mail and Safari, degrading not just open tracking but your entire attribution model.
2026 Benchmarks by Industry
Every source reports different numbers because they're measuring different things. Here are two major datasets side by side.
| Industry | Mailchimp (Dec 2023) | ActiveCampaign (Jan-Dec 2025) |
|---|---|---|
| All Industries | 35.63% | 39.26% |
| Ecommerce/Retail | 29.81% | 35.66% |
| Non-Profit | 40.04% | 42.68% |
| Education | 35.64% | - |
| Software/Tech | - | 36.20% |
| Healthcare | - | 41.48% |
| Media/Publishing | - | 43.16% |
Which benchmark is "right"? None of them. Mailchimp's data covers campaigns only, sent to lists of 1,000+ subscribers, last updated December 2023. ActiveCampaign's includes transactional, marketing, and other campaign types from 2025. GetResponse, analyzing 4.4 billion messages, reports a 39.64% global average. The spread across sources proves benchmarks are directional, not gospel.
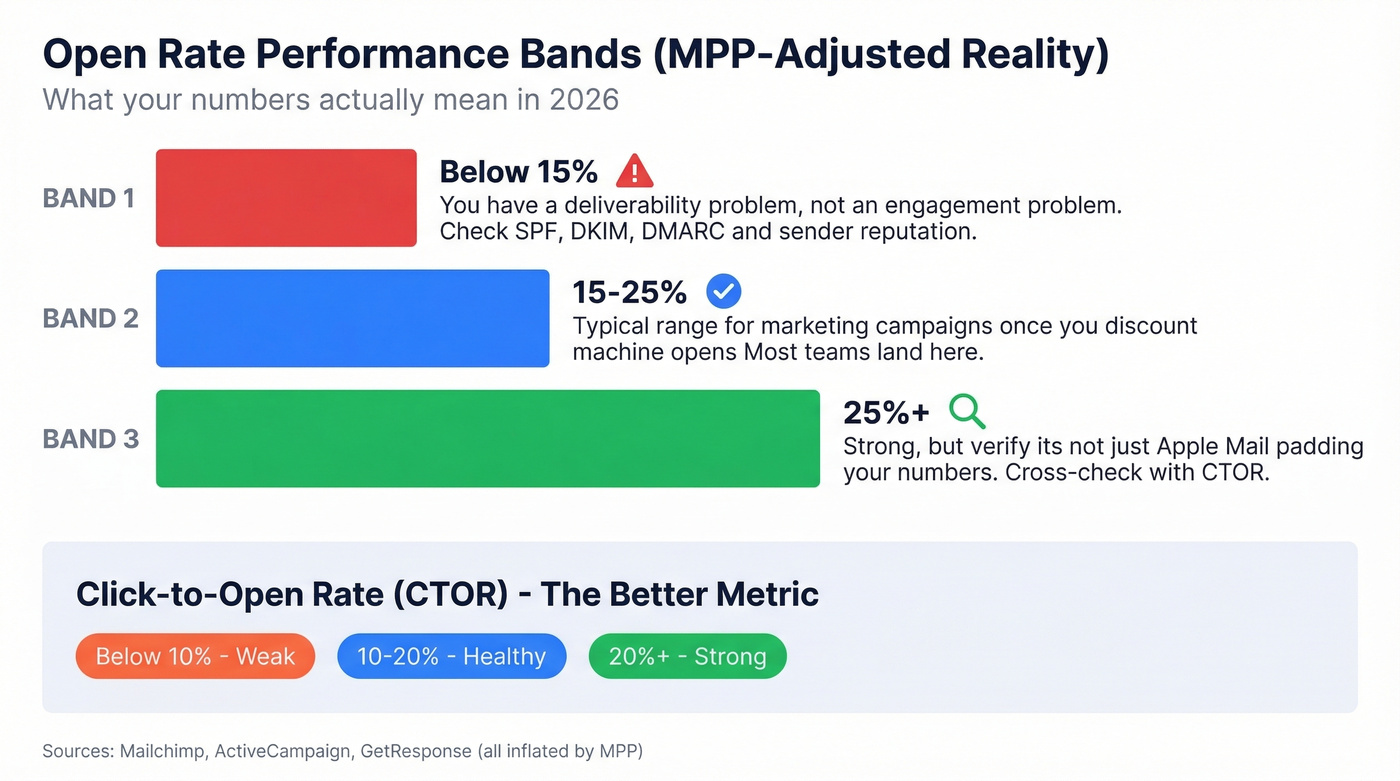
All of these numbers are inflated by MPP. Use these performance bands instead:
- Below 15%: You have a deliverability problem, not an engagement problem.
- 15-25%: Typical range for marketing campaigns once you discount machine opens.
- 25%+: Strong - but verify it's not just Apple Mail padding your numbers.
For click-to-open rate (CTOR), which strips out a lot of the open-count noise, 10-20% is healthy for marketing emails. Above 20% is strong, and highly targeted or transactional emails can run much higher.
Campaigns vs. Automated Flows
Your open rate is meaningless without segmenting by email type. Klaviyo's dataset across 183,000+ customers makes this painfully clear: automated flows represent just 5.3% of total send volume but generate roughly 41% of email revenue.
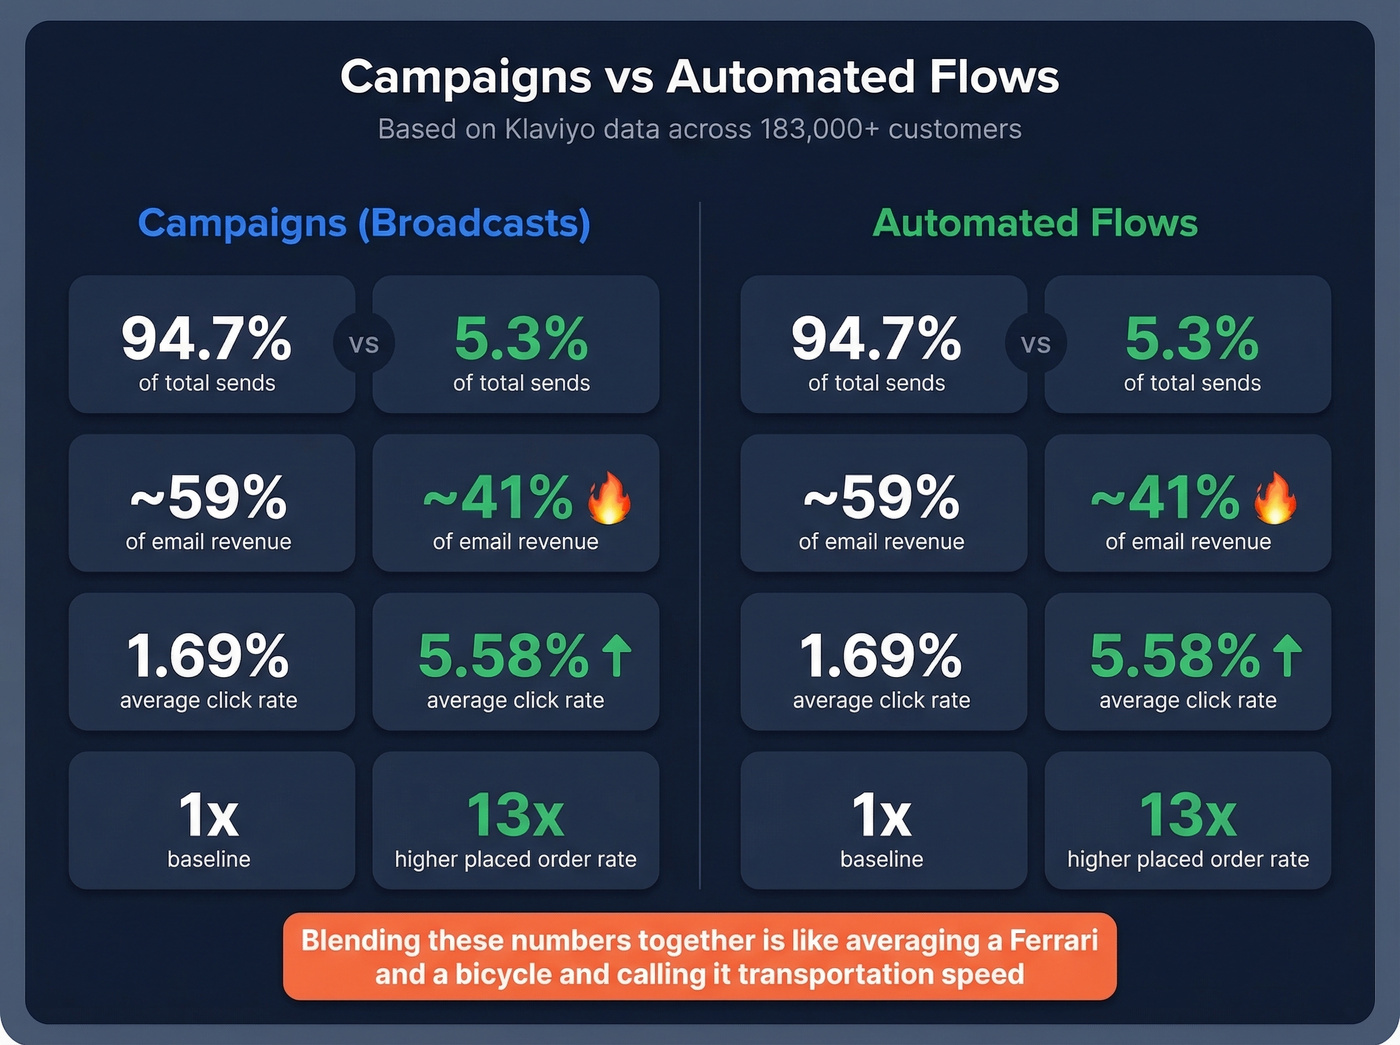
The engagement gap is massive. Flows average a 5.58% click rate versus 1.69% for campaigns. Placed order rates run 13x higher for flows. If you're reporting a blended number across campaigns and automations, you're averaging a Ferrari and a bicycle and calling it "transportation speed." Segment or the number means nothing.
Open rates are broken, but deliverability doesn't have to be. Teams using Prospeo's 98% verified emails see bounce rates drop below 4% - because every address passes 5-step verification with spam-trap and honeypot removal before it ever hits your sequence.
Stop optimizing a broken metric. Start with data that actually lands.
Cold Email Open Rates
Cold email and marketing email metrics share a name but are completely different measurements. Stop comparing them.
Average cold email open rates have stabilized around 27.7% in the 2024-2026 window, down from ~36% in 2023. Reply rates sit at 3.43%, and roughly 17% of cold emails never reach the inbox. Typical cold outreach conversion rates run 0.2-2%, making sequence optimization far more impactful than obsessing over opens.
Here's the thing: 42% of all replies come from follow-up emails, yet 48% of reps never send a second message. The open rate on email #1 matters far less than whether you send email #3. If your deal sizes justify multi-touch sequences and you're not sending at least four touches, you're leaving pipeline on the table.
Best Send Times (2.1 Million Campaigns)
MailerLite analyzed 2,138,817 campaigns sent from the US, UK, Australia, and Canada between December 2024 and November 2025. The patterns are useful even if the absolute numbers run high from MPP inflation.
Friday posted the highest average open rate at 49.72%, with Monday close behind at 49.44%. Opens peak between 8-11 AM local time on weekdays. But clicks tell a different story - they peak in the evenings, around 8-9 PM, when people have time to actually engage. Friday at 6 PM is an anomaly where both opens and clicks peak simultaneously.
Aggregate data only tells part of the story. One Substack creator tracked their 11 sends and found Sunday at 6 PM hit a 64% open rate, while Thursday at 9 AM - the "conventional wisdom" slot - managed only 54%. Small sample, but it underscores how much timing varies by audience. Test your own list before trusting anyone else's averages.
The takeaway isn't "send everything on Friday." It's that open timing and click timing diverge, and optimizing for opens alone catches people who glance but don't act.
How to Improve Your Open Rate
Subject Lines and Sender Name
Keep subject lines under 50 characters. Use a real person's name as the sender - "Sarah from Acme" outperforms "Acme Marketing" almost every time. Write a preheader that complements the subject line rather than repeating it.
Segmentation and List Hygiene
Segment by engagement recency. Subscribers who haven't opened in 90+ days drag your deliverability down, not just your engagement metrics. Run re-permission campaigns for stale segments before you cut them. Skip this step if your list is under 1,000 contacts - at that size, manual review is faster and more accurate than automated re-engagement flows.
Authentication and Deliverability
SPF, DKIM, and DMARC aren't optional anymore. Gmail and Yahoo's 2024 sender requirements made that clear. Warm new domains gradually, monitor sender reputation through Google Postmaster Tools, and treat deliverability as infrastructure, not a one-time setup.
Data Quality - The Highest-Leverage Fix
Bad email addresses lead to bounces, which damage sender reputation, which reduces inbox placement, which tanks open rates. The metric you're obsessing over is downstream of data quality.
We've seen this pattern dozens of times. A team spends months A/B testing subject lines while sitting on a double-digit bounce rate. Snyk had 50 AEs prospecting 4-6 hours per week with a 35-40% bounce rate. After switching to Prospeo for verified contact data, bounces dropped under 5%, AE-sourced pipeline jumped 180%, and the team generated 200+ new opportunities per month. That's what happens when you fix the foundation instead of polishing the surface.

When Open Rate Matters - And When It Doesn't
Let's be honest: if you can only track three things, make them click-to-open rate, conversion rate, and revenue per email.
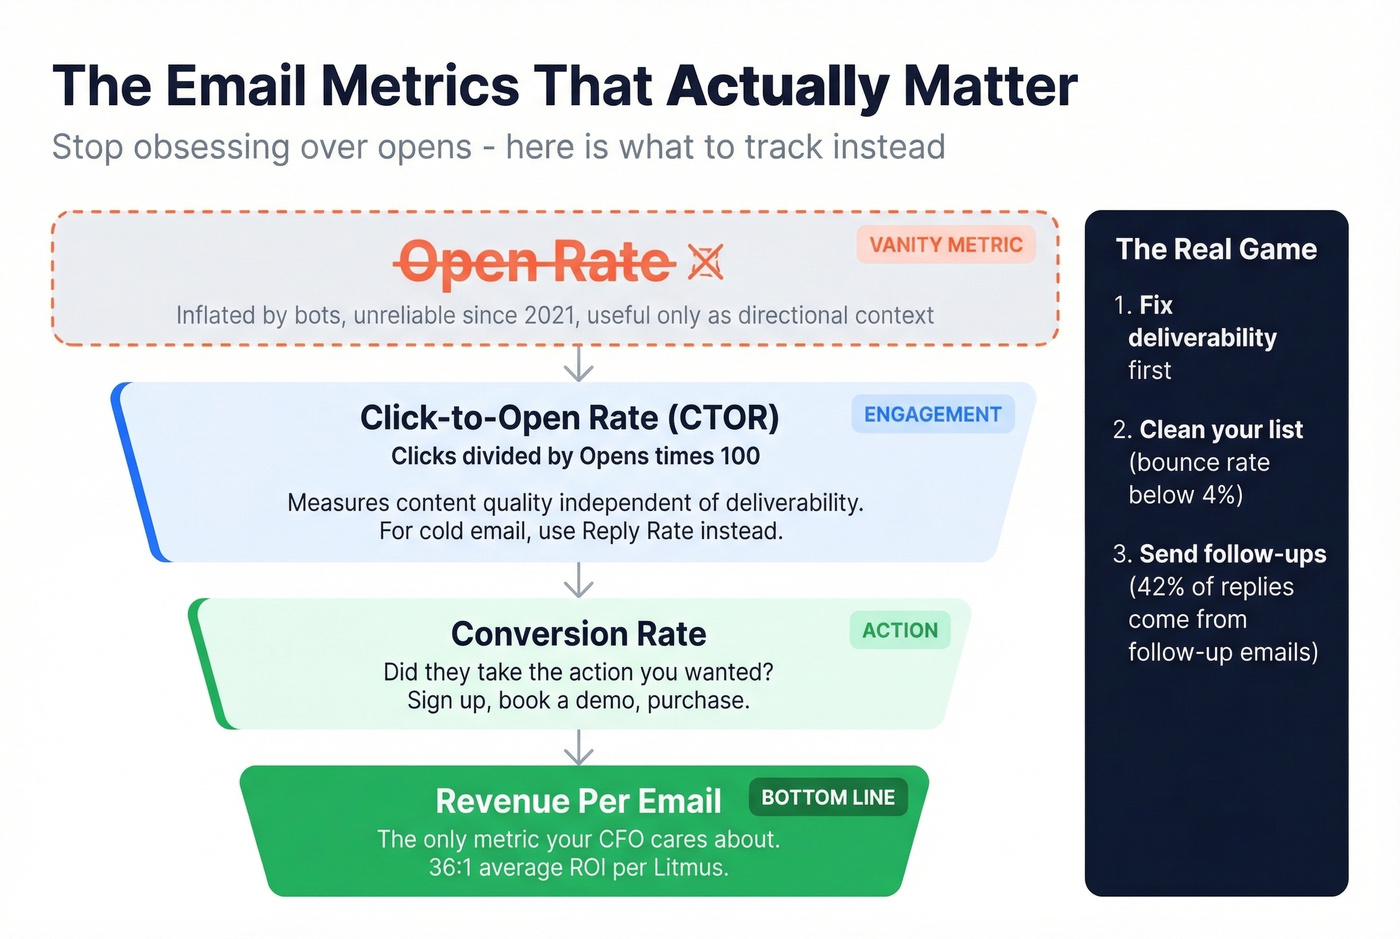
Open rate tells you whether your subject line and sender reputation earned enough trust for someone to look. But it stops there. Click-to-open rate - clicks divided by opens, times 100 - measures content quality independent of deliverability. It tells you whether people who saw your email found it worth clicking. For cold email, reply rate is the equivalent metric.
Email isn't dying. Litmus reports roughly 36:1 ROI, making it the highest-returning channel in most marketing stacks. What's dying is our ability to measure the top of the funnel with pixel-based tracking. The bottom of the funnel - clicks, conversions, revenue - remains perfectly measurable. In our experience, the teams with the best engagement metrics rarely talk about opens. They talk about sender reputation. The consensus on r/emailmarketing backs this up: deliverability is the real game, and open rate is just a side effect. Shift your reporting there and you'll stop chasing a ghost metric.
42% of replies come from follow-ups, but follow-ups only work if email #1 didn't bounce. Prospeo refreshes 300M+ profiles every 7 days - not every 6 weeks - so your sequences hit real inboxes from the first touch. At $0.01 per email, bad data is a choice.
Your sequence can't convert if it never arrives. Fix the foundation.
Email Open Rate FAQ
What's a good open rate in 2026?
A 20-25% open rate for marketing campaigns is solid after discounting machine opens from Apple MPP and bot activity. Automated flows typically run 10-15 points higher than broadcast campaigns. Your own trend line matters more than industry averages - track month-over-month direction, not absolute numbers.
How is open rate calculated?
Open rate equals unique opens divided by delivered emails, multiplied by 100. "Delivered" means sent minus bounces - not total subscribers. Most ESPs weigh recent opens more heavily to help you segment engaged versus disengaged contacts.
Why did my open rate suddenly drop?
Common causes include updated bot filtering by your ESP, Gmail clipping a template past 102KB, list decay from aging contacts, or a deliverability hit from high bounce rates. Check bounce rate and sender reputation first - subject lines are rarely the real problem.
Are email open rates still accurate?
No. Apple MPP and bot activity can inflate the number by 20-50%, and Gmail/Yahoo proxying makes open metadata unreliable. Use open rate as a directional trend indicator, not a KPI you optimize against. Click-to-open rate and conversion rate are far more trustworthy.
How does list quality affect open rates?
Unverified emails bounce, which damages sender reputation, which reduces inbox placement for every subsequent send. Cleaning your list with a verified data provider is the single highest-leverage fix for declining engagement metrics.