Pipeline Conversion Rate: How to Measure It, Benchmarks, and Why Your Number Is Probably Wrong
Your pipeline conversion rate is probably higher than you think - and that's the problem. Most teams measure it wrong, compare it to the wrong benchmarks, and then wonder why forecasts miss by 10%+.
Here's the quick version: Pipeline conversion rate = (Closed-Won / Total Opportunities) x 100. Top performers hit 22-28% per SiriusDecisions benchmarks; the average sits around 13%. Most teams unknowingly inflate this number through period mismatch and denominator manipulation. The fix is cohort-based measurement and clean pipeline data.
What This Metric Actually Measures
Pipeline conversion rate tells you what percentage of opportunities turn into revenue:
(Closed-Won Deals / Total Opportunities) x 100 = Pipeline Conversion Rate
100 opportunities last quarter, 13 closed-won - that's 13%. Simple enough, until you realize "total opportunities" is where every team starts lying to themselves.
That denominator must include every pipeline exit: won, lost, no-decision, and removed. The moment you cherry-pick which deals "really counted," your number becomes fiction. We've seen this firsthand in pipeline audits where a 25% win rate crumbles to 14% once you add back the deals someone quietly deleted from the CRM.
What Are Good Pipeline Conversion Rates?
A blended conversion rate is almost useless without segmentation. I've audited pipelines where an acceptable blended number masked a completely broken enterprise motion - the SMB inbound was carrying the whole thing. You need to break this down by stage, channel, and deal size.
Benchmarks by Stage
The biggest drop-off typically happens at MQL to SQL. That's where marketing's definition of "qualified" meets sales reality.
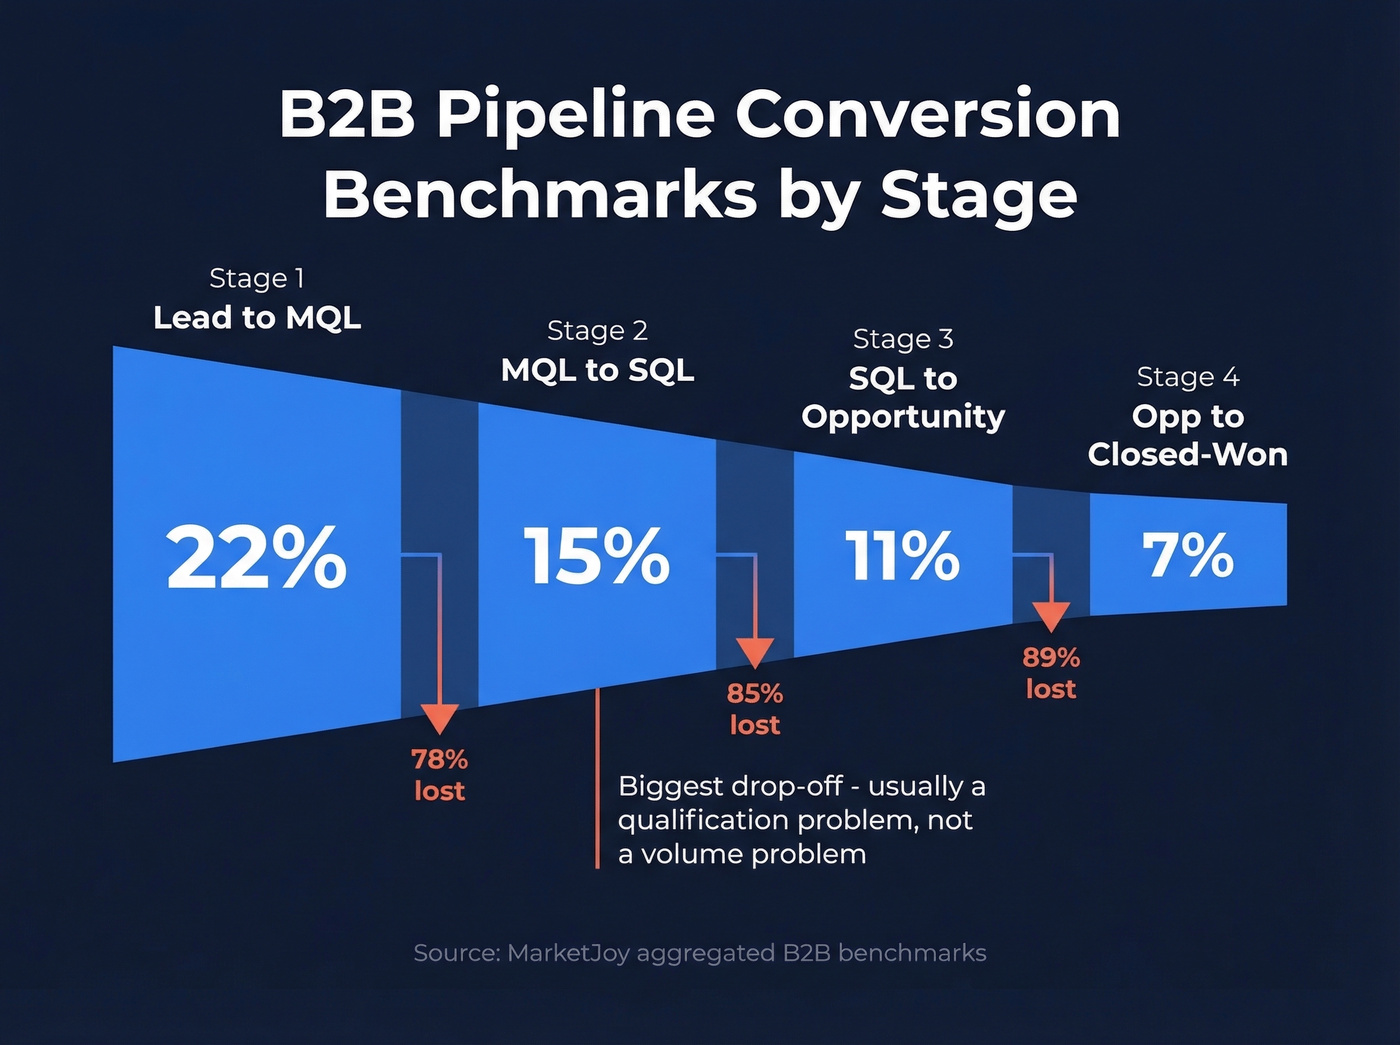
| Stage | Benchmark |
|---|---|
| Lead to MQL | 22% |
| MQL to SQL | 15% |
| SQL to Opportunity | 11% |
| Opp to Closed-Won | 7% |
These numbers come from MarketJoy's aggregated benchmarks across B2B clients. That MQL-to-SQL gap is almost always a qualification problem, not a volume problem.
Benchmarks by Channel
First Page Sage's data across 50+ B2B SaaS clients shows massive variance by source:
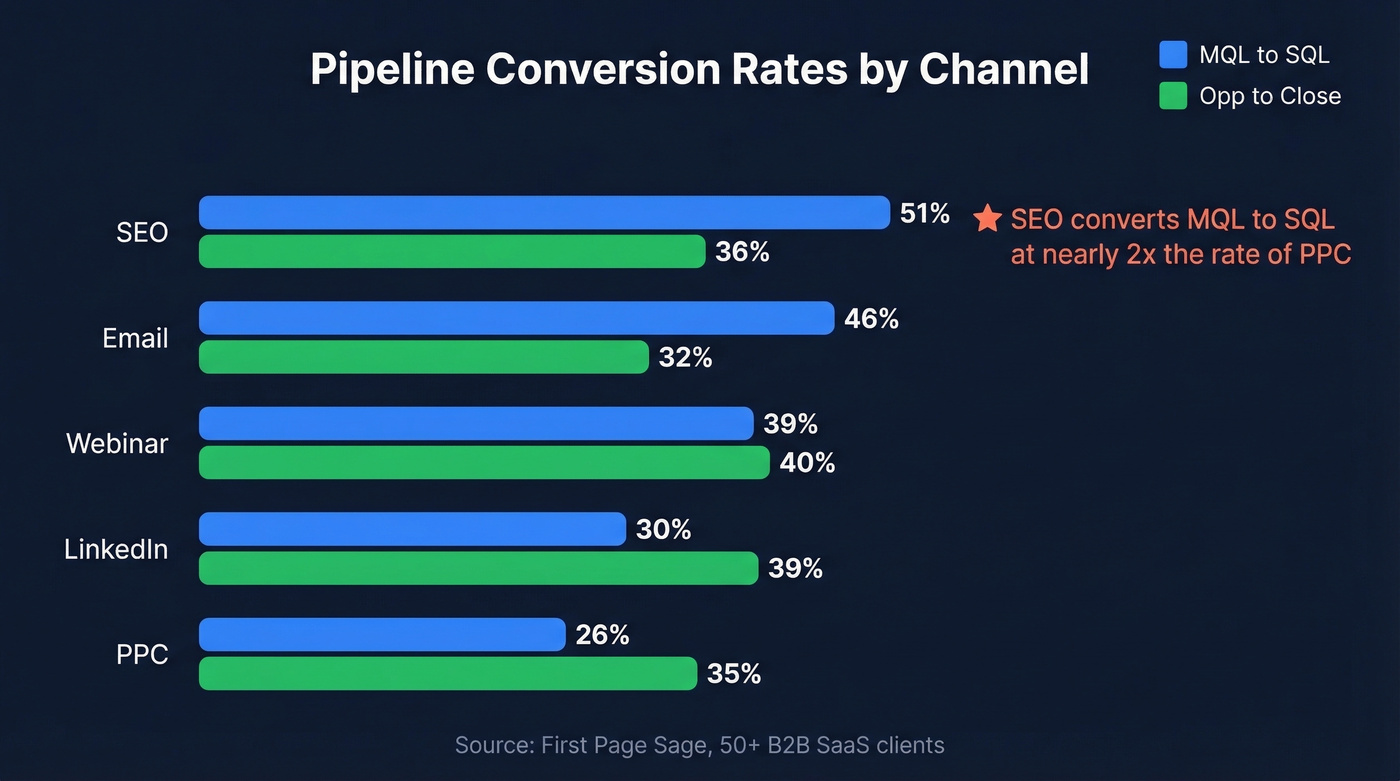
| Channel | MQL to SQL | Opp to Close |
|---|---|---|
| SEO | 51% | 36% |
| 46% | 32% | |
| Webinar | 39% | 40% |
| 30% | 39% | |
| PPC | 26% | 35% |
SEO leads convert MQL-to-SQL at nearly double the rate of PPC. If you're blending these into one number, you're hiding the fact that your paid pipeline converts fundamentally differently from organic.
SMB vs. Enterprise
Deal complexity changes everything. Digital Bloom's latest benchmarks show the gap clearly:
| Stage | SMB | Enterprise |
|---|---|---|
| MQL to SQL | 39% | 31% |
| SQL to Opp | 42% | 36% |
| Opp to Close | 39% | 31% |
Enterprise deals convert at lower rates across every stage. A blended number across both segments tells you nothing actionable.
Here's the thing: if your average deal is under $25K and you're reporting a single blended win rate, you're not doing analytics. You're doing decoration.
How to Calculate It Correctly
Use 90-day cohort windows. Group opportunities by the quarter they were created, then track outcomes over the next 90+ days - or through your typical sales cycle. This eliminates the snapshot problem where you're comparing Q2 closes against Q2 creates, two populations that barely overlap.
You also need to understand the difference between narrow and broad win rates. As Kellblog explains, narrow win rate (wins divided by wins plus losses) always looks better than broad win rate (wins divided by all pipeline exits including no-decisions and removals). The broad version is the honest one.
Snapshot your pipeline monthly. Track each cohort's progression. Measure stage conversion rates as the percentage of opportunities that advance from one stage to the next. It's more work than a single dashboard widget, but it's the difference between a number that makes you feel good and a number that helps you forecast.
Bad data inflates your denominator with deals that were never real. Prospeo's 98% email accuracy and 7-day refresh cycle ensure every opportunity in your pipeline represents a reachable buyer - not a bounced email or a contact who changed jobs six months ago.
Stop measuring phantom pipeline. Start with verified data.
Three Mistakes That Inflate Your Number
1. Period mismatch. A practitioner on r/SalesOperations described the classic version: you look at deals closed in Q2 and divide by deals created in Q2. But most Q2 closes were created in Q1 or earlier - you're comparing two different populations. Watch for CRM edge cases too. HubSpot, for example, defaults to a 31/12/9999 close date for deals that never leave a stage, silently inflating your denominator if you're not filtering exports.
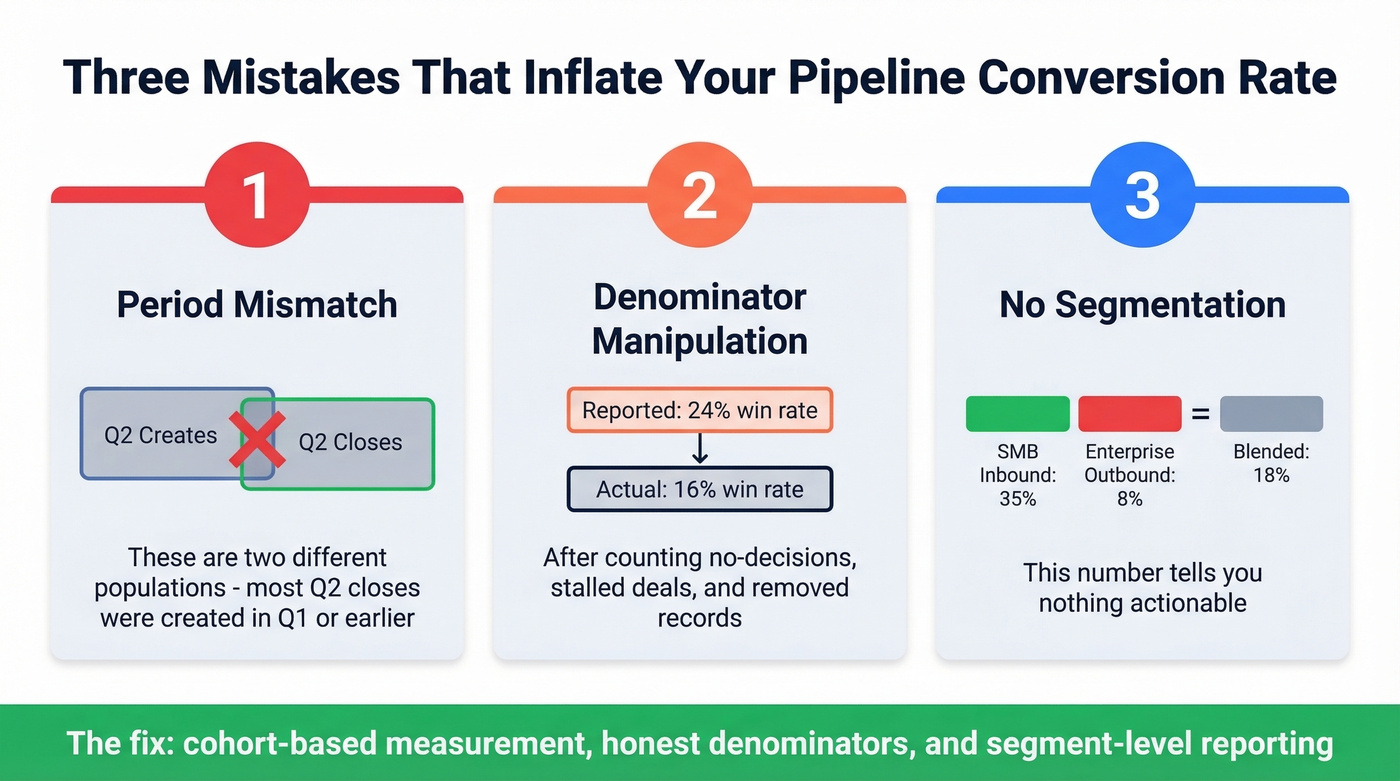
2. Denominator manipulation. A real-world audit revealed a CRO reporting a 24% win rate, but when all pipeline exits were counted - no-decisions, stalled deals, removed records - the system-verified rate was 16%. If a deal entered your pipeline, it belongs in the denominator. Period.
3. No segmentation. Your enterprise outbound might convert at 8% while SMB inbound runs at 35%. The blended 18% tells you nothing. In our experience, this is the single most common reason teams misallocate resources between segments. Skip the blended number entirely and report by segment from day one.
Pipeline Conversion vs. Velocity
Conversion feeds a more useful metric - pipeline velocity:
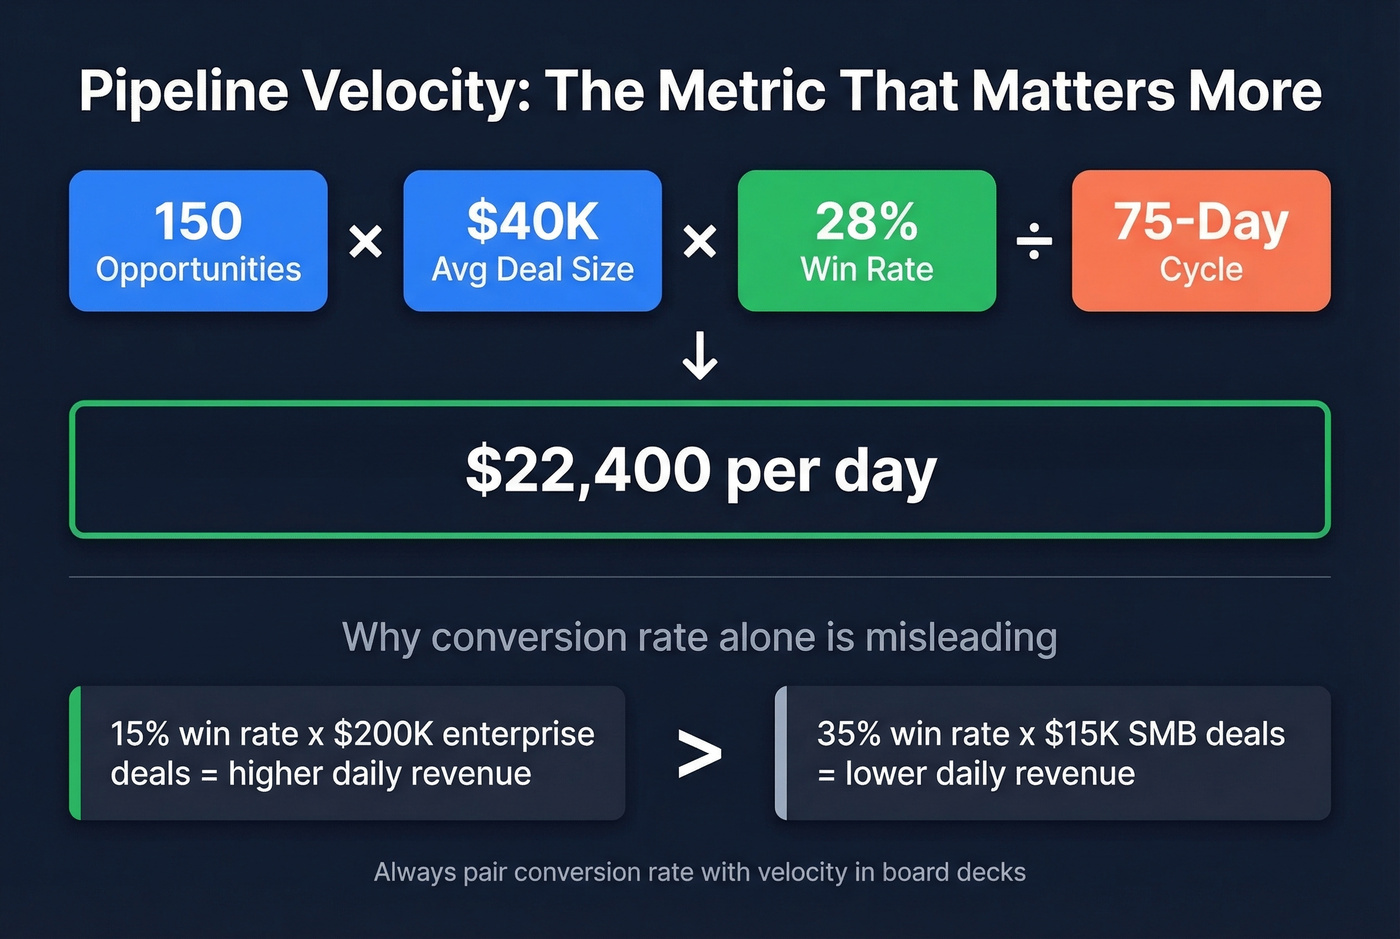
(Opportunities x Avg Deal Size x Win Rate) / Sales Cycle Length
Using Outreach's worked example: 150 mid-market opportunities at $40K average deal size with a 28% win rate over a 75-day cycle produces $22,400/day. A team with a 15% win rate on $200K enterprise deals can generate more revenue per day than a team closing 35% of $15K SMB deals. Conversion rate alone doesn't capture that, which is why velocity should sit alongside it in every board deck.
How to Improve Sales Pipeline Conversion
Three levers actually move this number.
Fix your data first. Forrester research shows bad CRM data skews conversion metrics by up to 25%. Phantom pipeline - opportunities built on unverified emails, wrong numbers, or contacts who've changed jobs - inflates your denominator with deals that were never real. This is where data verification tools earn their keep. Prospeo delivers 98% email accuracy with a 7-day refresh cycle that catches job changes before they become bounced sequences, so every opportunity in your CRM represents someone you can actually reach.

Diagnose by stage, not in aggregate. If MQL-to-SQL is your biggest drop-off, that's a qualification problem. If Opp-to-Close is weak, look at pricing or competitive positioning. Compare your numbers against the benchmarks above and focus resources on the widest gap. Let's be honest - most teams skip this step because it forces uncomfortable conversations about which segments aren't working.
Tighten targeting upstream. Speed matters - contacting leads within 24 hours increases conversion by 5x. But speed doesn't help if you're reaching the wrong people. Verify contact data before it enters the pipeline, and your conversion rate improves without changing anything downstream. Teams like Snyk saw AE-sourced pipeline jump 180% after switching to verified data, largely because reps stopped wasting cycles on dead contacts.
If you want to go deeper on upstream inputs, align this with your lead scoring model and your ideal customer profile so “qualified” means the same thing across marketing and sales.
Your pipeline conversion rate is only as honest as your CRM data. Prospeo enriches contacts with 50+ verified data points at a 92% match rate, so your denominator reflects real opportunities - not stale records dragging your win rate into fiction.
Fix the data and the conversion rate fixes itself.
FAQ
What's a good pipeline conversion rate for B2B SaaS?
Top performers hit 22-28%, while the average sits around 13%. Segment by deal size, source channel, and customer type to get a number you can act on - blended rates hide more than they reveal.
How often should I measure this metric?
Use 90-day cohort windows aligned to your sales cycle. Measure monthly for trend-spotting, but base strategic decisions on quarterly cohorts. The median SaaS sales cycle runs about 84 days, so anything shorter produces noisy data.
How does data quality affect conversion accuracy?
Unverified contacts inflate your denominator with phantom opportunities that were never winnable - Forrester puts the distortion at up to 25%. Clean, verified data ensures every record in your CRM represents a real, reachable buyer, giving you a conversion rate you can actually trust.
What's the difference between narrow and broad win rate?
Narrow win rate divides wins by wins plus losses only, typically yielding 30-40%. Broad win rate includes all pipeline exits - no-decisions, stalled deals, and removals - producing a lower but more honest figure, usually 13-20%. Always report the broad version for forecasting.