The Revenue Growth Rate Formula - And What Most Guides Get Wrong
You'd think a formula this simple wouldn't trip people up. Subtract, divide, multiply by 100 - done. But we've found that half the guides ranking for "revenue growth rate formula" contain actual math errors, and the other half stop at the formula without telling you what a good number looks like for your specific situation. Let's fix both problems.
The Quick Version
Revenue Growth Rate = (Current Revenue - Previous Revenue) / Previous Revenue x 100
Worked example: your company did $2M last quarter and $2.4M this quarter.
($2.4M - $2M) / $2M x 100 = 20% quarterly growth
What's "good"? The generic answer is 10-25% annually, but that range is nearly useless without context. A bootstrapped SaaS company in the $3M-$20M ARR band growing 20% is median. A regional bank growing 20% would be extraordinary. Benchmarks by industry and stage are below.
What Revenue Growth Rate Actually Measures
Revenue growth rate measures the percentage change in top-line revenue between two periods. It tells you whether you're selling more than before and by how much. It says nothing about profitability, margins, or whether that growth is sustainable - it's the starting point for financial analysis, not the finish line.
The Formula (And Why It Works)
The standard formula:
Revenue Growth Rate (%) = (Current Period Revenue - Previous Period Revenue) / Previous Period Revenue x 100
You can also express it as (Current / Previous) - 1, then multiply by 100. Both are mathematically identical.
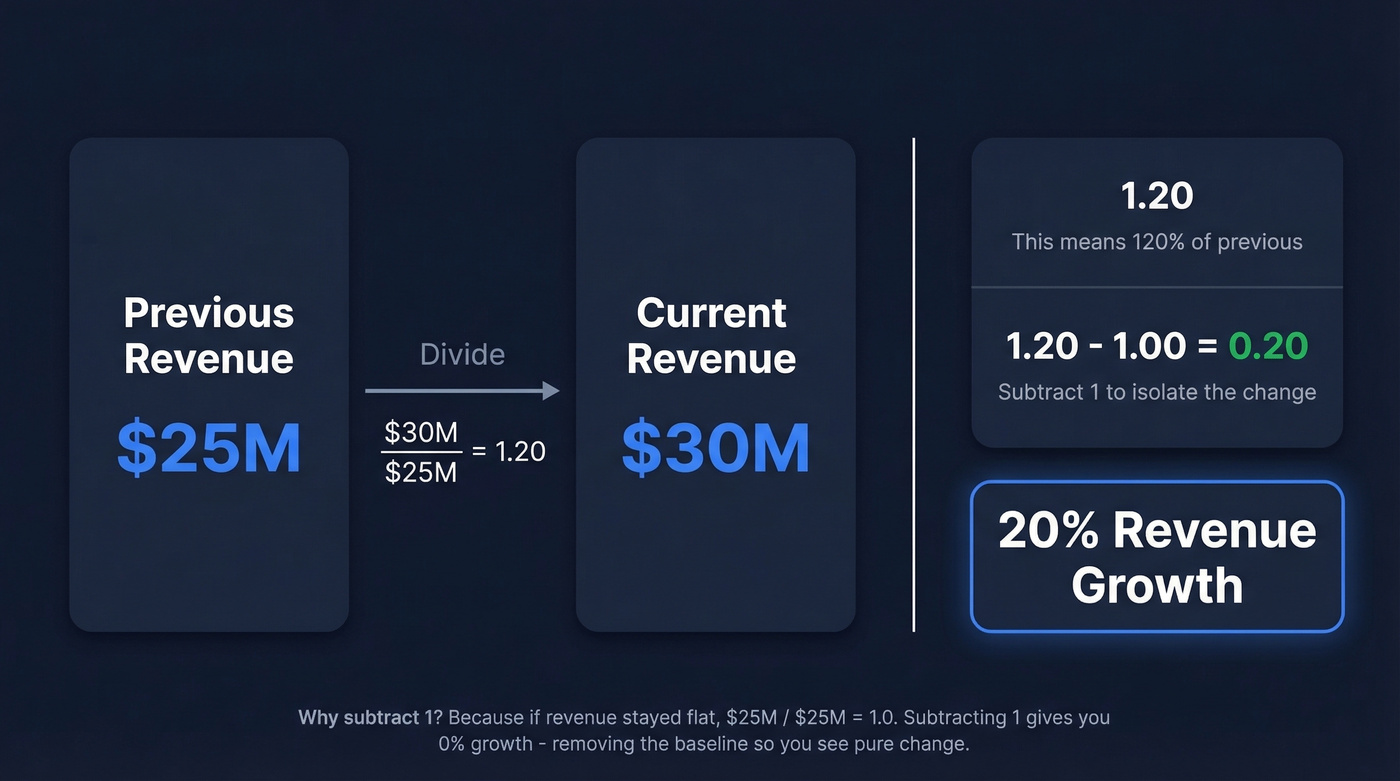
Here's where beginners get confused: why subtract 1? A common question on r/Accounting asks exactly this, and the intuition is straightforward. If you divide $30M by $25M, you get 1.2 - meaning current revenue is 120% of previous revenue. But you want to know how much it grew. Subtracting 1 isolates the 0.2, the 20% change above your starting base.
Think of it this way: if revenue stayed flat, $25M / $25M = 1.0. Subtracting 1 gives you 0, which is 0% growth. The "minus 1" removes the baseline so you're left with pure change.
The formula works for any time period - monthly, quarterly, annually. Just make sure both numbers cover the same duration. Comparing a 31-day January to a 28-day February introduces noise that has nothing to do with your business.
Worked Examples
Three common time frames with concrete numbers.
Month-over-Month (MoM): March revenue = $180,000. February revenue = $150,000. ($180,000 - $150,000) / $150,000 x 100 = 20% MoM growth
Quarter-over-Quarter (QoQ): Q2 revenue = $1.1M. Q1 revenue = $950,000. ($1,100,000 - $950,000) / $950,000 x 100 = 15.8% QoQ growth
Tracking quarter-over-quarter revenue growth is especially useful for spotting momentum shifts before they show up in annual numbers.
Year-over-Year (YoY): 2026 revenue = $8.5M. 2025 revenue = $7.2M. ($8,500,000 - $7,200,000) / $7,200,000 x 100 = 18.1% YoY growth
| Period | Previous | Current | Growth Rate |
|---|---|---|---|
| MoM | $150K | $180K | 20.0% |
| QoQ | $950K | $1.1M | 15.8% |
| YoY | $7.2M | $8.5M | 18.1% |
CAGR: The Multi-Year Formula
When you need to compare growth across multiple years, the simple formula falls short. That's where Compound Annual Growth Rate comes in.
CAGR = ((Ending Value / Beginning Value) ^ (1/n) - 1) x 100
Where n is the number of years.
Investopedia's classic example: an investment grows from $10,000 to $19,000 over 3 years. CAGR = (($19,000 / $10,000) ^ (1/3) - 1) x 100 = 23.86%. That doesn't mean the investment grew exactly 23.86% each year - it smooths the volatility into a single annualized rate.
Use CAGR when you're comparing multi-year performance across companies or industries. Use the simple formula when you're tracking period-over-period changes for operational decisions. CAGR is a smoothing tool, not an operational metric.
Knowing your revenue growth rate formula is table stakes. Actually accelerating that number requires a pipeline full of real buyers. Prospeo gives you 300M+ profiles with 98% email accuracy and intent data across 15,000 topics - so every dollar you spend on outbound drives measurable top-line growth.
Stop calculating slow growth. Start building pipeline that compounds.
What's a Good Growth Rate?
The textbook answer - 10-25% annually - is technically correct and practically useless. A 15% growth rate is phenomenal for a $500M revenue bank and mediocre for a $3M ARR SaaS startup. Context is everything.
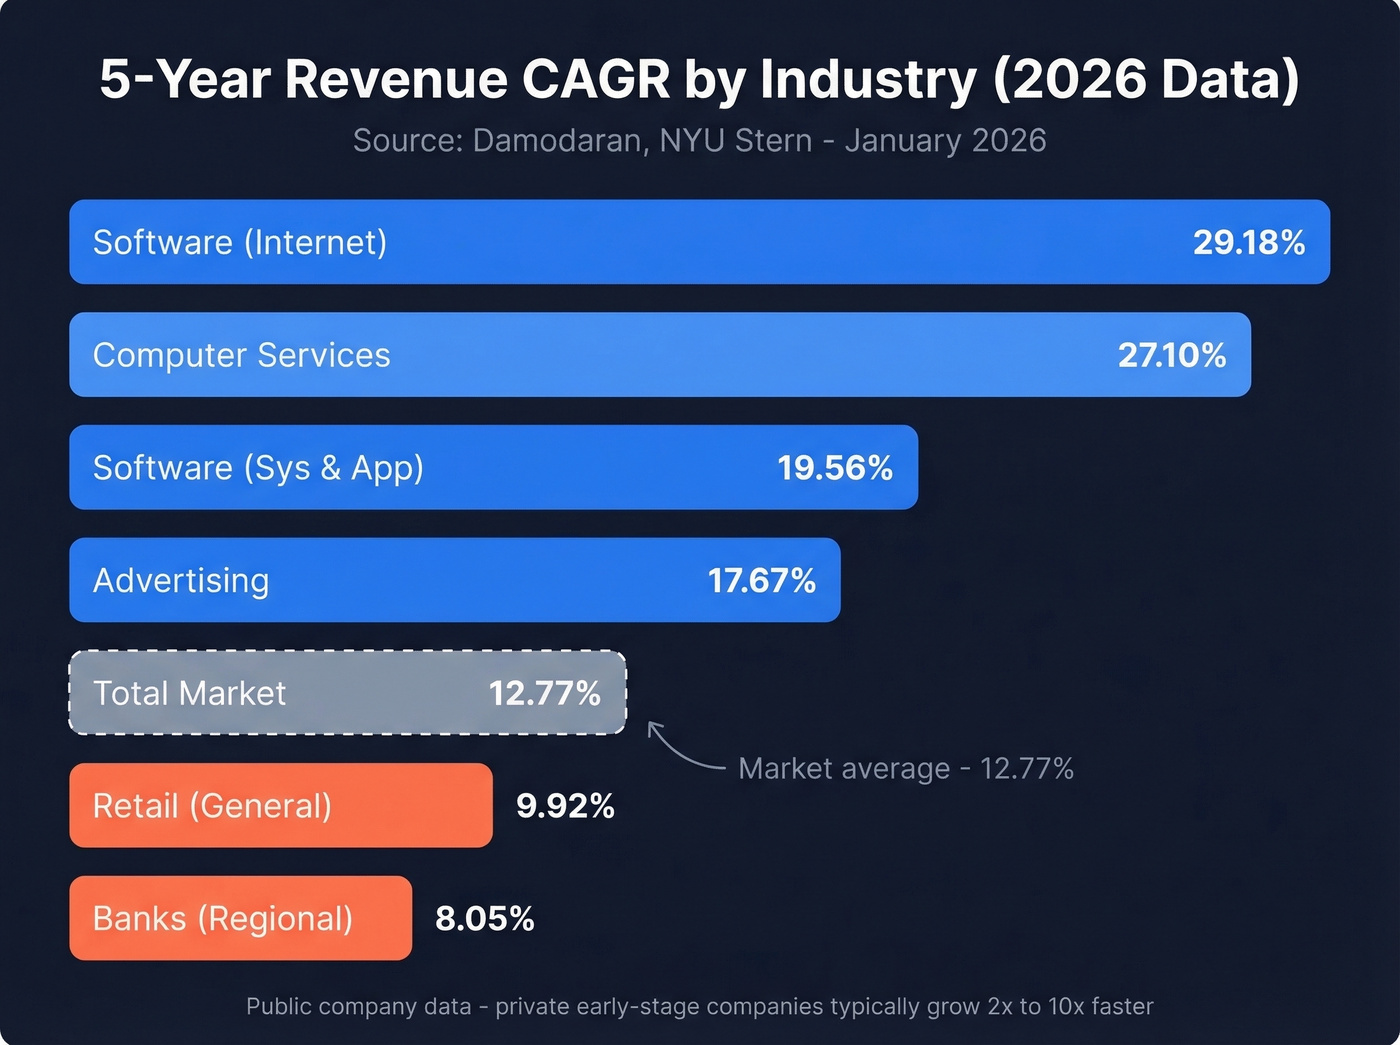
Damodaran's January 2026 dataset from NYU Stern provides 5-year revenue CAGRs across public companies:
| Industry | 5-Year Revenue CAGR | Firms |
|---|---|---|
| Software (Internet) | 29.18% | 29 |
| Computer Services | 27.10% | 64 |
| Software (Sys & App) | 19.56% | 309 |
| Advertising | 17.67% | 52 |
| Total Market | 12.77% | 5,994 |
| Retail (General) | 9.92% | 23 |
| Banks (Regional) | 8.05% | 568 |

These are public-company numbers, which skew mature. Private companies - especially early-stage ones - operate in a different universe, so you need stage-appropriate targets.
A simple SaaS stage framing that's widely used:
- Early-stage SaaS (Series A-B): 100-300% annual growth
- Growth-stage SaaS (Series C+): 40-100% annual growth
- Mature SaaS (Public): 15-40% annual growth
For SaaS specifically, SaaS Capital's 2025 survey of 1,000+ private companies gives tighter benchmarks for bootstrapped businesses at $3M-$20M ARR:
| Metric | Median | 90th Percentile |
|---|---|---|
| Revenue Growth | 20% | 51% |
| NRR | 104% | 118% |
| GRR | 92% | 98% |
Here's the thing: if you're a bootstrapped SaaS company growing at 20%, you're exactly median. Not bad, not great. Hitting 50%+? Top 10%. These numbers are far more useful than a generic "10-25% is good" heuristic because they're scoped to a specific company type and size.
SaaS Revenue Growth Variants
The basic formula works for any business. But SaaS companies track several specialized variants that paint a more granular picture.
MRR Growth Rate
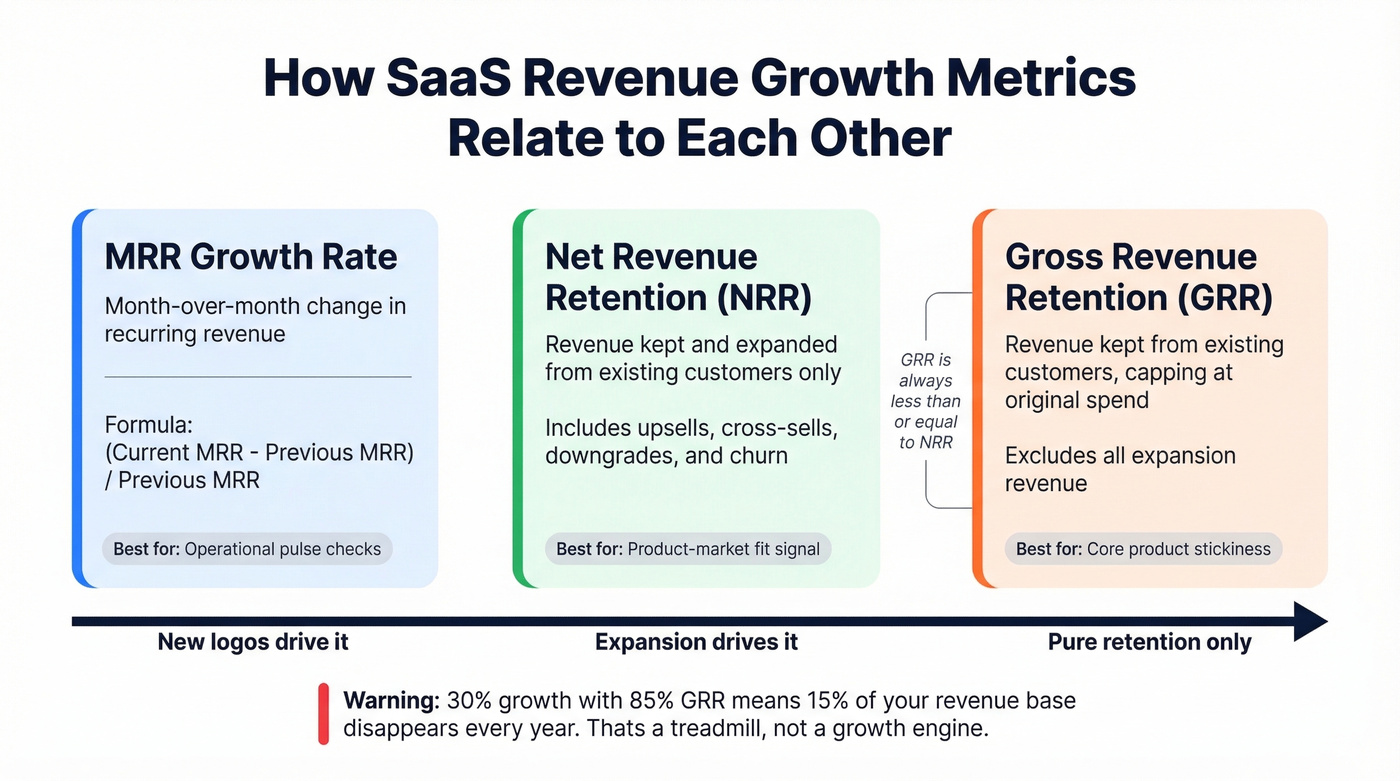
MRR (Monthly Recurring Revenue) growth rate measures the month-over-month change in your recurring revenue base. The formula is identical in structure:
(Current Month MRR - Previous Month MRR) / Previous Month MRR x 100
The more useful variant is Net MRR Growth Rate, which factors in expansion revenue, contraction, and churned MRR separately - telling you whether growth comes from new customers, upsells, or fewer cancellations.
Net Revenue Retention (NRR)
NRR measures how much revenue you retain and expand from existing customers, excluding new logos. It's the single best indicator of product-market fit in SaaS.
You must calculate NRR using per-customer data. Aggregating totals before comparing periods masks churn and mixes new customers with retained ones. SaaS Capital shows how annual aggregation can look fine while monthly GRR collapses late in the year. Track 3-, 6-, and 12-month trailing averages to catch problems early.
Consider a company growing 30% annually but with 85% GRR. That means 15% of its existing revenue base evaporates every year, and growth is entirely dependent on new logos filling the hole. That's a treadmill, not a growth engine.
Gross Revenue Retention (GRR)
GRR caps each customer's second-period revenue at their first-period revenue, excluding upsells. It isolates pure retention - how much revenue you'd keep if you never sold another dollar to existing customers. GRR is always <= NRR by definition, and it reveals whether your core product retains value without help from your expansion sales team.
How to Calculate It in Excel & Sheets
Put your revenue figures in column B (B2 = previous period, B3 = current period). In column C, enter:
=(B3-B2)/B2
Format the cell as a percentage. Done.
But here's the trap that catches people constantly. If you format the cell as percentage, do NOT also multiply by 100 in the formula. Excel and Google Sheets automatically multiply by 100 when displaying a percentage format. So =(B3-B2)/B2 formatted as percent shows "20%." But =(B3-B2)/B2*100 formatted as percent shows "2000%." We've seen this exact mistake in first-page guides for this topic, and it's the kind of error that makes its way into board decks if nobody catches it.
For visualization, build a combo chart: select your revenue and growth rate columns, go to Insert > Chart, then choose a Combo chart. Set revenue as columns on the primary axis and growth rate as a line on the secondary axis. This gives you the classic "bars and line" view that makes trends immediately visible.
Edge Cases and Common Mistakes
Negative-to-Positive Revenue
CAGR is mathematically undefined when the starting value is negative. You can't take a fractional exponent of a negative number in real numbers. A thread on r/learnmath illustrates this well: a company moves from -$386K to +$456K over 5 years, and the standard CAGR formula returns an error.
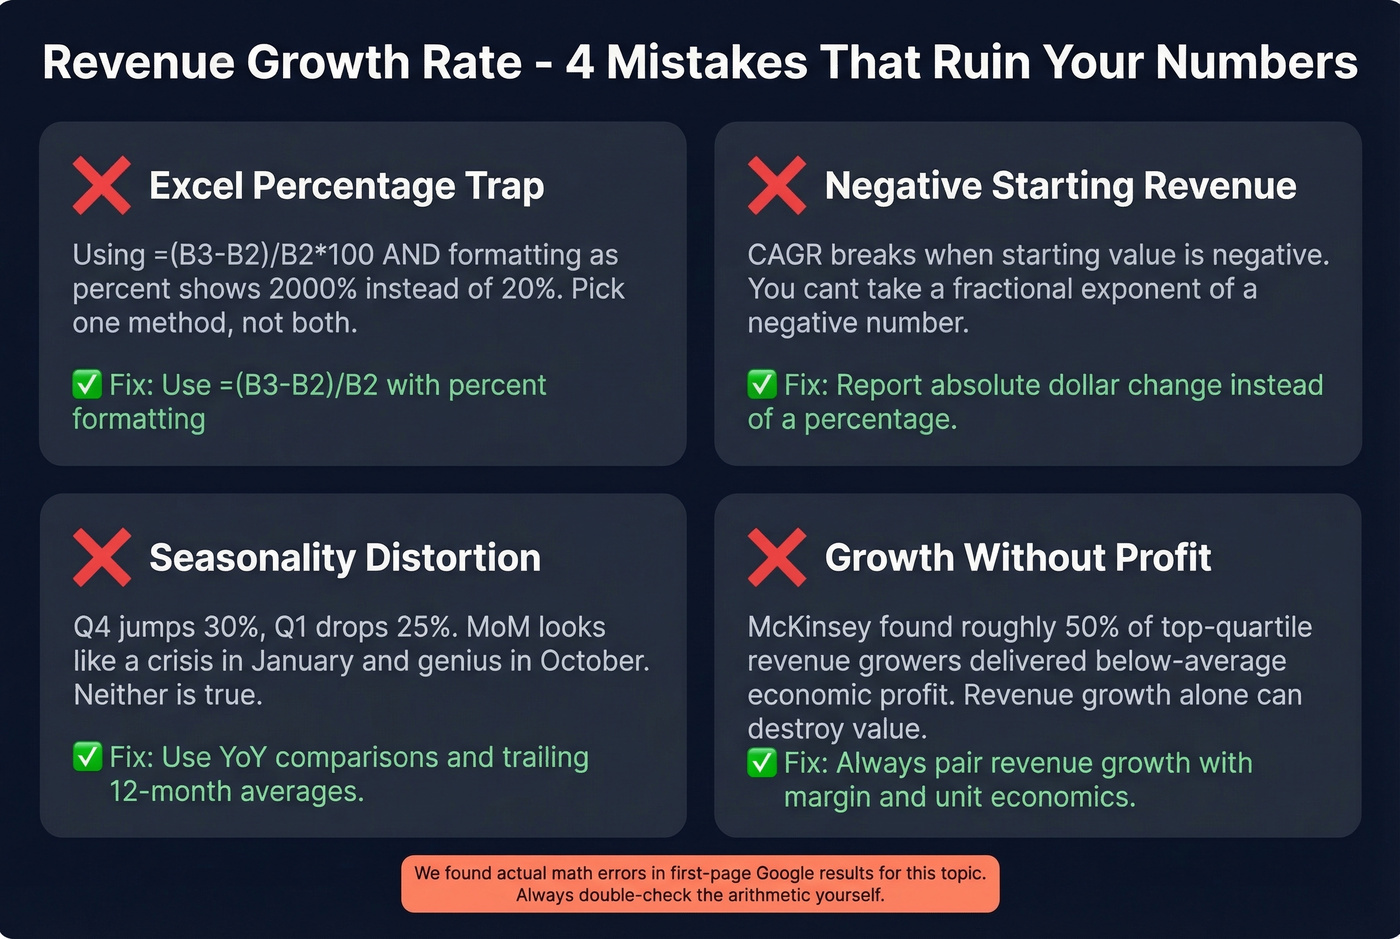
The practical workaround: don't force a percentage. Report the absolute dollar change ($842K improvement) and frame it as a turnaround narrative. Investors understand "we went from losing $386K to earning $456K" far better than a fabricated growth percentage.
Seasonality Distortion
B2B SaaS sees roughly a 30% revenue jump in Q4 and drops 20-25% in Q1. Your MoM growth rate in January will look like a crisis, and your October number will look like genius. Neither is true.
The fix: use YoY comparisons for period-over-period analysis and trailing 12-month averages to isolate the underlying trend. MoM numbers are useful for operational pulse checks, but they're terrible for strategic decisions without seasonal adjustment.
Growth Without Profit
Revenue growth can destroy value. An S&P 500 analysis by McKinsey found that roughly 50% of companies with top-quartile revenue growth delivered below-average economic profit growth - and over 40% of those top growers had bottom-quartile economic profit. Revenue growth is necessary but absolutely not sufficient. If you're growing 30% while burning cash faster than you're collecting it, the formula is lying to you about the health of your business.
Math Errors in Popular Guides
Look, we've seen first-page Google results with incorrect worked examples. One guide computes ($27,000 - $23,000) / $23,000 = 17.39%, then states the answer is "33.33%." We've encountered other examples where basic doubling math gets mangled beyond recognition. If you're cross-referencing your work against online calculators, double-check the arithmetic yourself. Trust the formula, not the screenshot.
How to Improve Revenue Growth
Knowing the formula is step one. Moving the number is what matters. The three fundamental levers are reducing churn, expanding existing accounts through upsells and cross-sells, and improving conversion on new pipeline.
None of these levers work if your outbound pipeline is broken at the source. We've seen teams with brilliant strategy and terrible execution - 30%+ email bounce rates, sub-5% phone connect rates, reps spending half their day hunting for contact data instead of selling. That's not a strategy problem. It's a data quality problem, and it directly suppresses the top-line growth you're trying to calculate.
Tools like Prospeo address this at the foundation. With 98% email accuracy, 125M+ verified mobile numbers, and a 7-day data refresh cycle, your outbound team actually reaches the people they're targeting. More conversations, more pipeline, more revenue.
If you're diagnosing why growth is stalling, start with churn analysis and then audit your pipeline health to see where revenue is leaking.
Teams using Prospeo book 35% more meetings than Apollo users and 26% more than ZoomInfo - at $0.01 per verified email. When your revenue growth rate depends on net-new pipeline, data accuracy is the multiplier most companies overlook.
Better data in, better revenue growth out. It's that simple.
FAQ
What's the difference between revenue growth rate and CAGR?
The revenue growth rate formula measures percentage change between two specific periods - this quarter vs. last, this year vs. last. CAGR smooths growth across multiple years into a single annualized rate, removing year-to-year volatility. Use the simple formula for operational tracking; use CAGR for multi-year comparisons across companies or investments.
Can revenue growth rate be negative?
Yes. A negative rate means revenue declined. The formula works identically: if current revenue is lower than prior revenue, the numerator is negative, producing a negative percentage. A -15% rate means revenue fell by 15% compared to the previous period.
How do I improve a declining growth rate?
Focus on three levers: reduce customer churn by tracking NRR and GRR monthly, expand revenue from existing accounts through upsells, and improve outbound pipeline quality so reps spend time selling instead of searching for contacts.
Is 20% annual revenue growth good?
It depends entirely on your stage and industry. For a bootstrapped SaaS company at $3M-$20M ARR, 20% is exactly median per SaaS Capital's 2025 survey. For a regional bank, 20% would be exceptional given an industry CAGR around 8%. Always benchmark against your specific sector and company size.